I love this chart …
Posted on February 15, 2014 1 Comment
the WX in Northern Virginia today is just down right ugly … snow, winter mix, wind has picked up. Have been doing posts, checking on the wife w/ a herniated disk and the 9 year old w/ a sinus infection and then playing Pink Floyd looking for patterns. As I was going thru the charts I realized 1) I have saved way too many of them … and 2) there are some amazing ones out there …
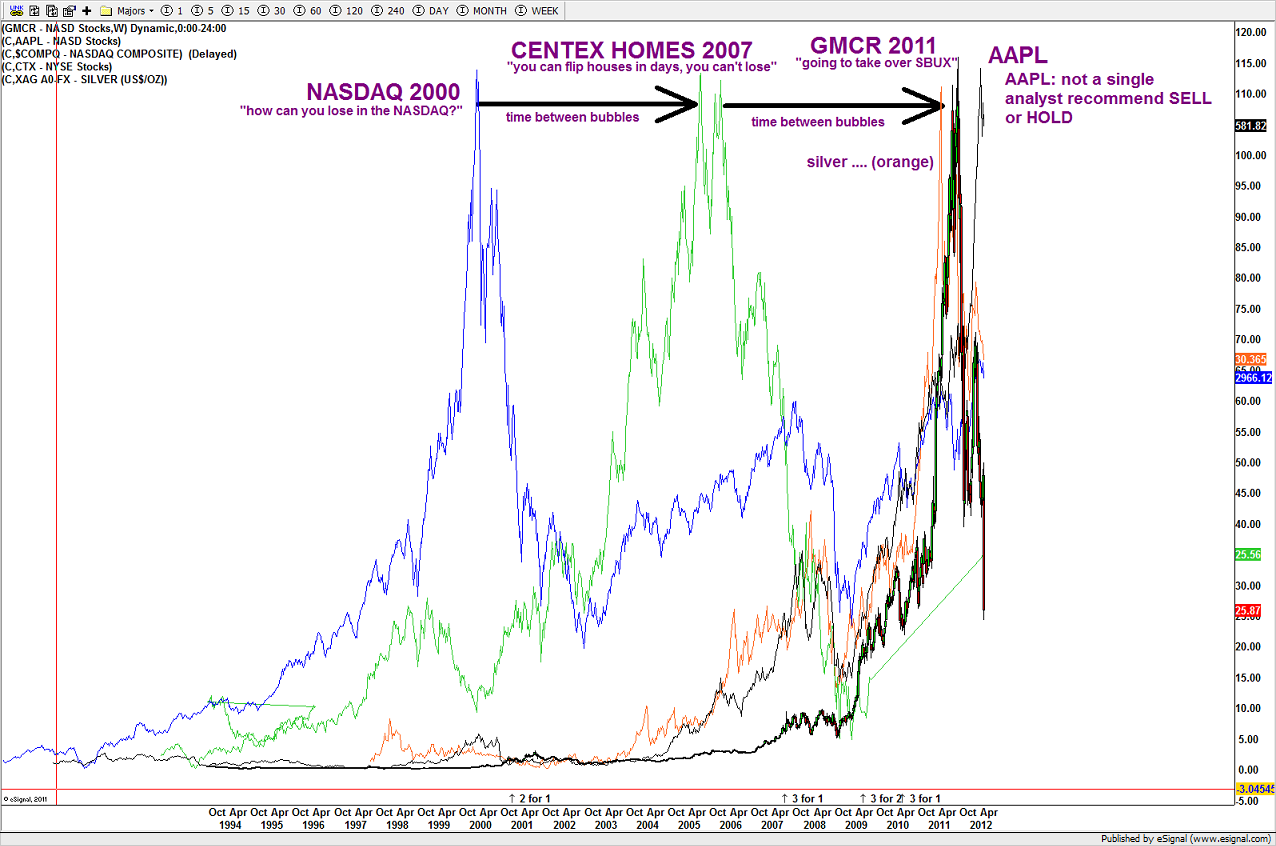
here’s a chart that simply shows the aftermath of parabolic rises … isn’t it a beauty?
 here’s the updated chart …
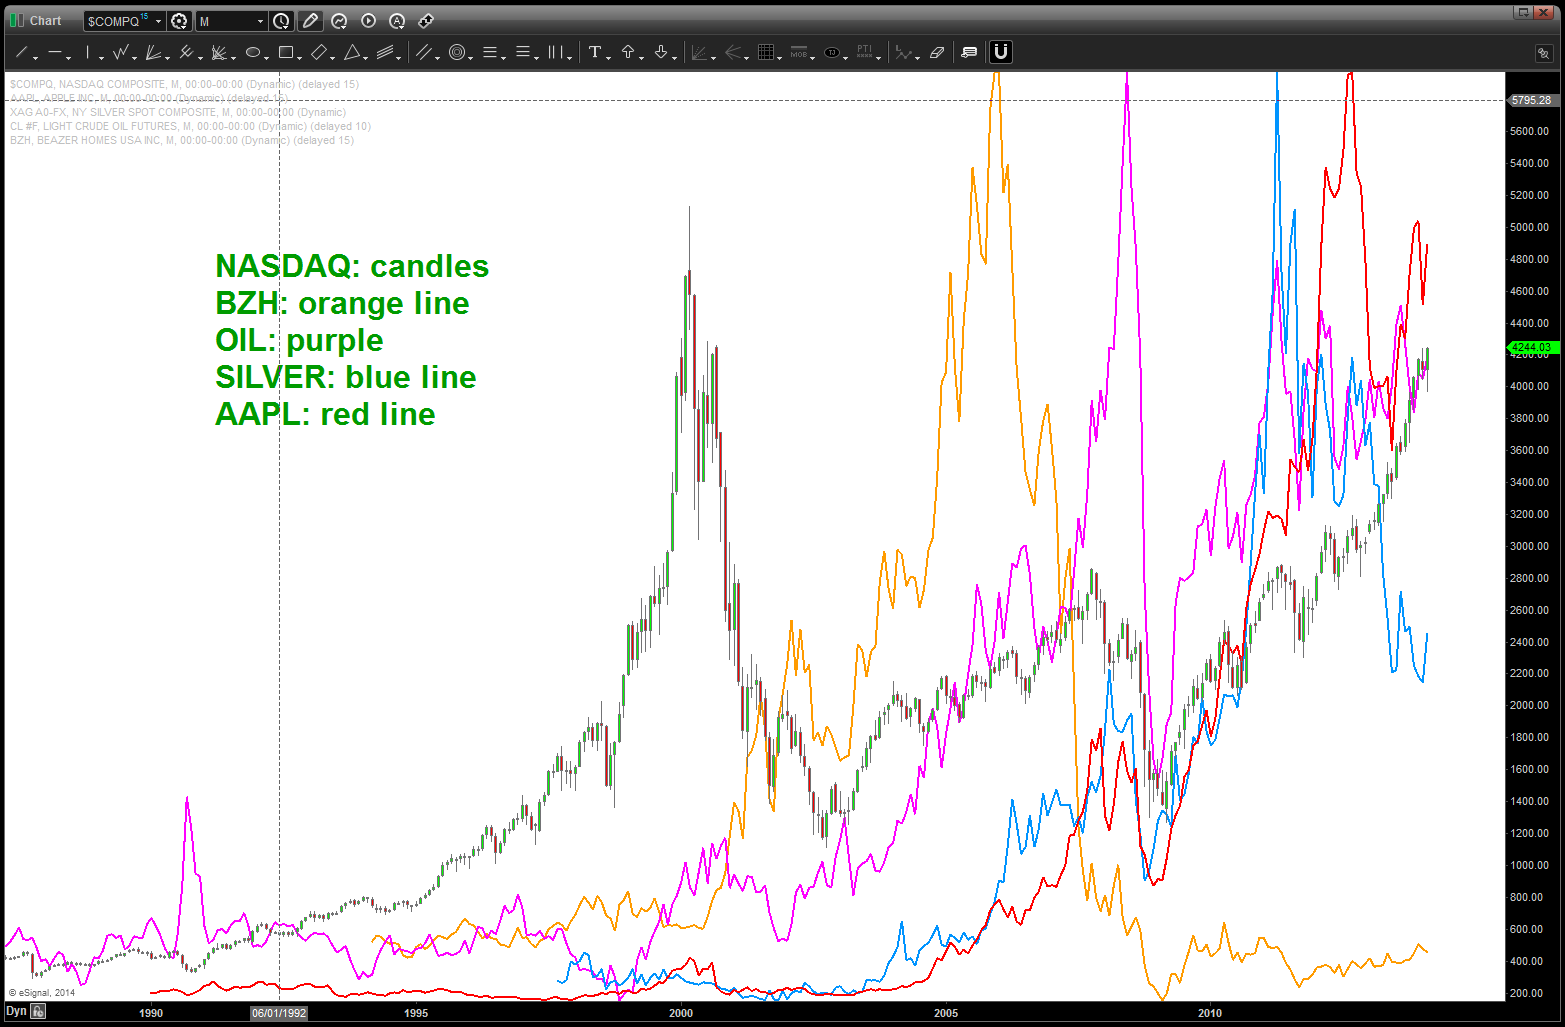
parabolic rises have very powerful corrections …
and here’s the update on GMCR – amazing !!! I haven’t looked at it in a couple years!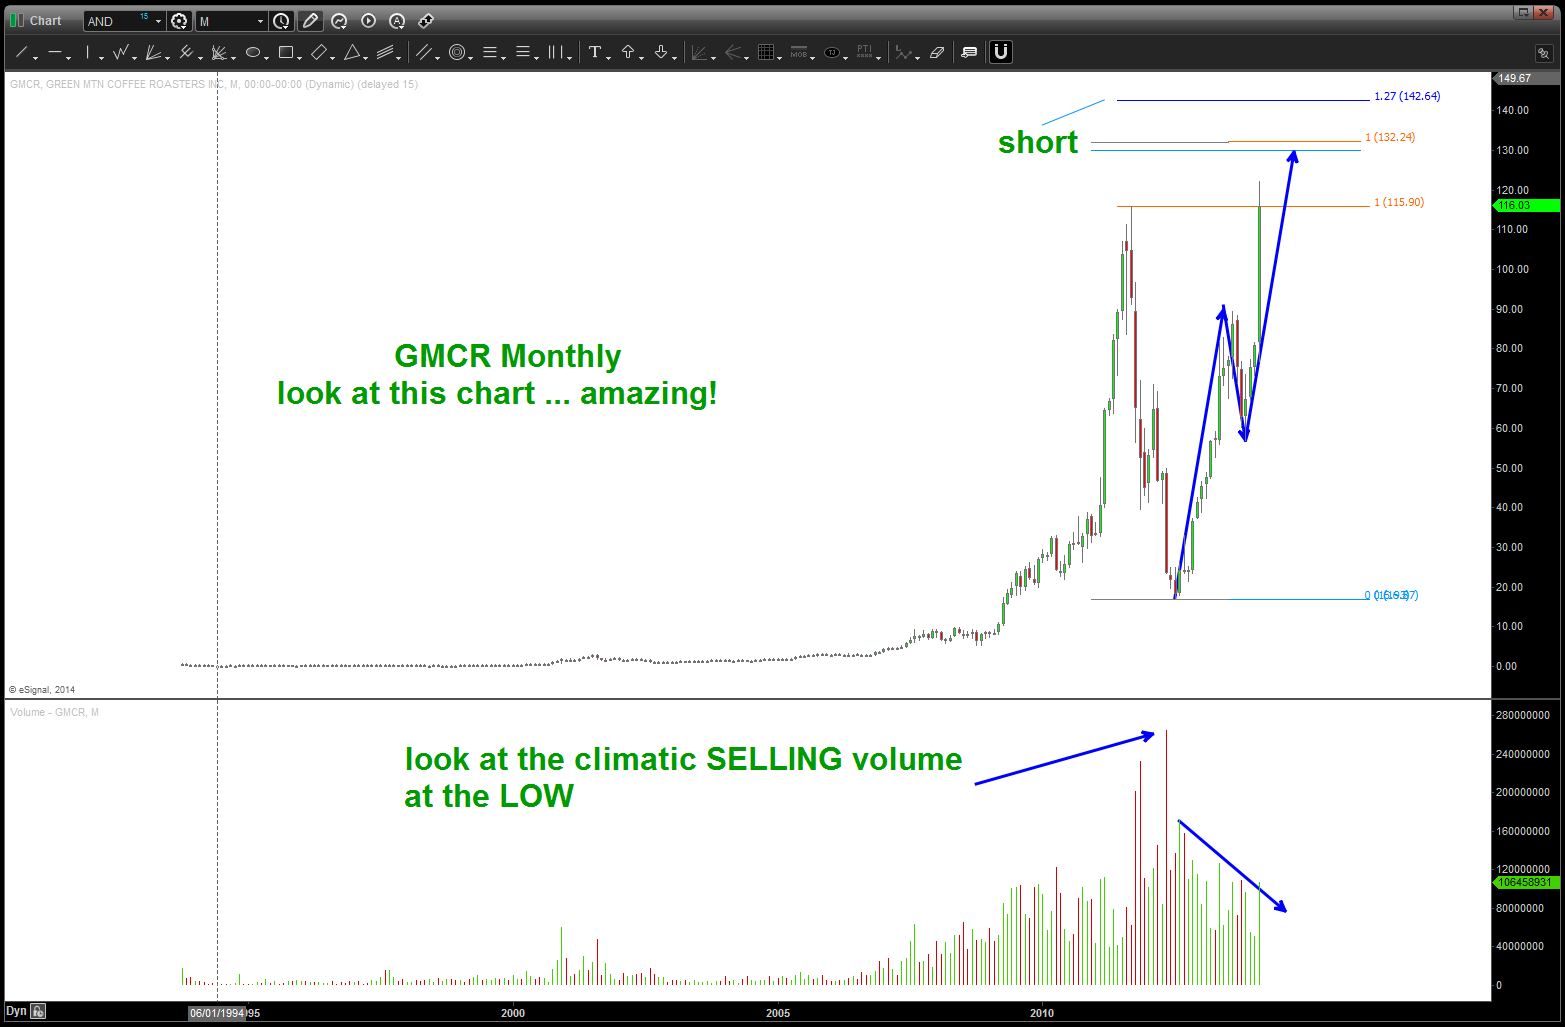
CLIFF NOTES: many, many, many charts are showing these parabolic rises … Sir Isaac Newton has yet to be proven wrong w/ his theory of gravity!
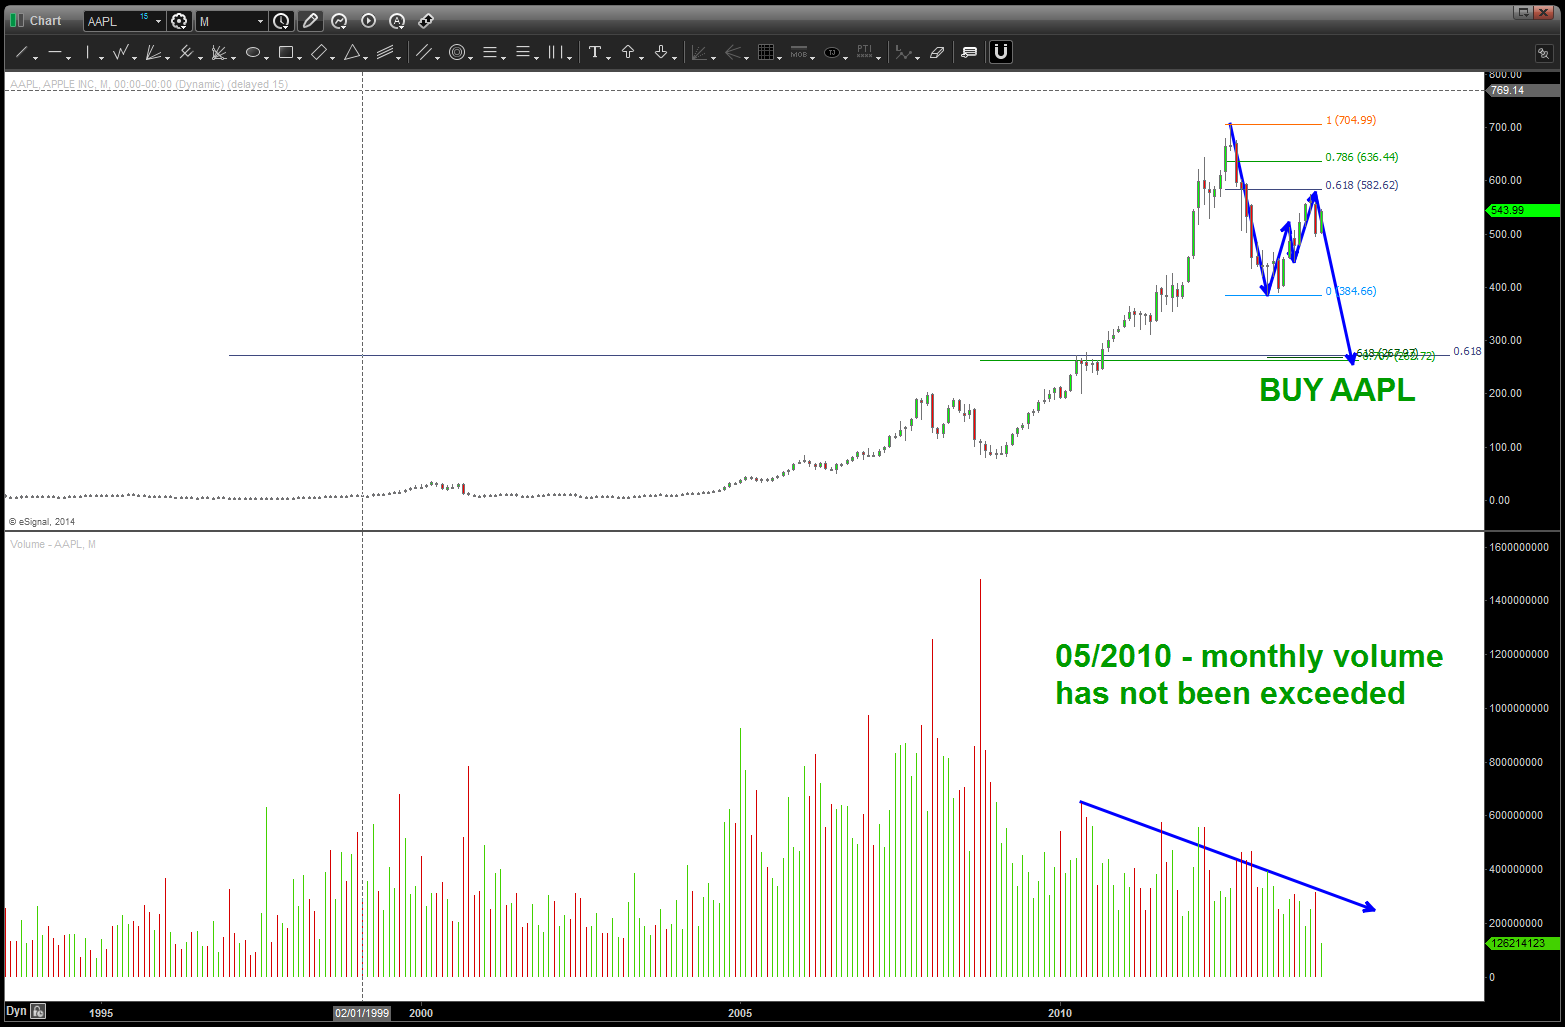
AAPL – window closed, buy in around 260-270
Posted on February 15, 2014 Leave a Comment
well, I guess we’ll see … if you go to the link above you’ll see the work that has been done on AAPL. And, while the AAPL work has called EVERY swing low and swing high – GOOG has kicked our butt. Patterns work and Patterns fail …but they are an edge and that’s what were looking for …
where are we now? We think AAPL is done and an entire leg down is going to being … above 610-620 and this idea is wrong …

CISCO (CSCO) Mirror Image Foldback – BULLISH
Posted on February 15, 2014 Leave a Comment
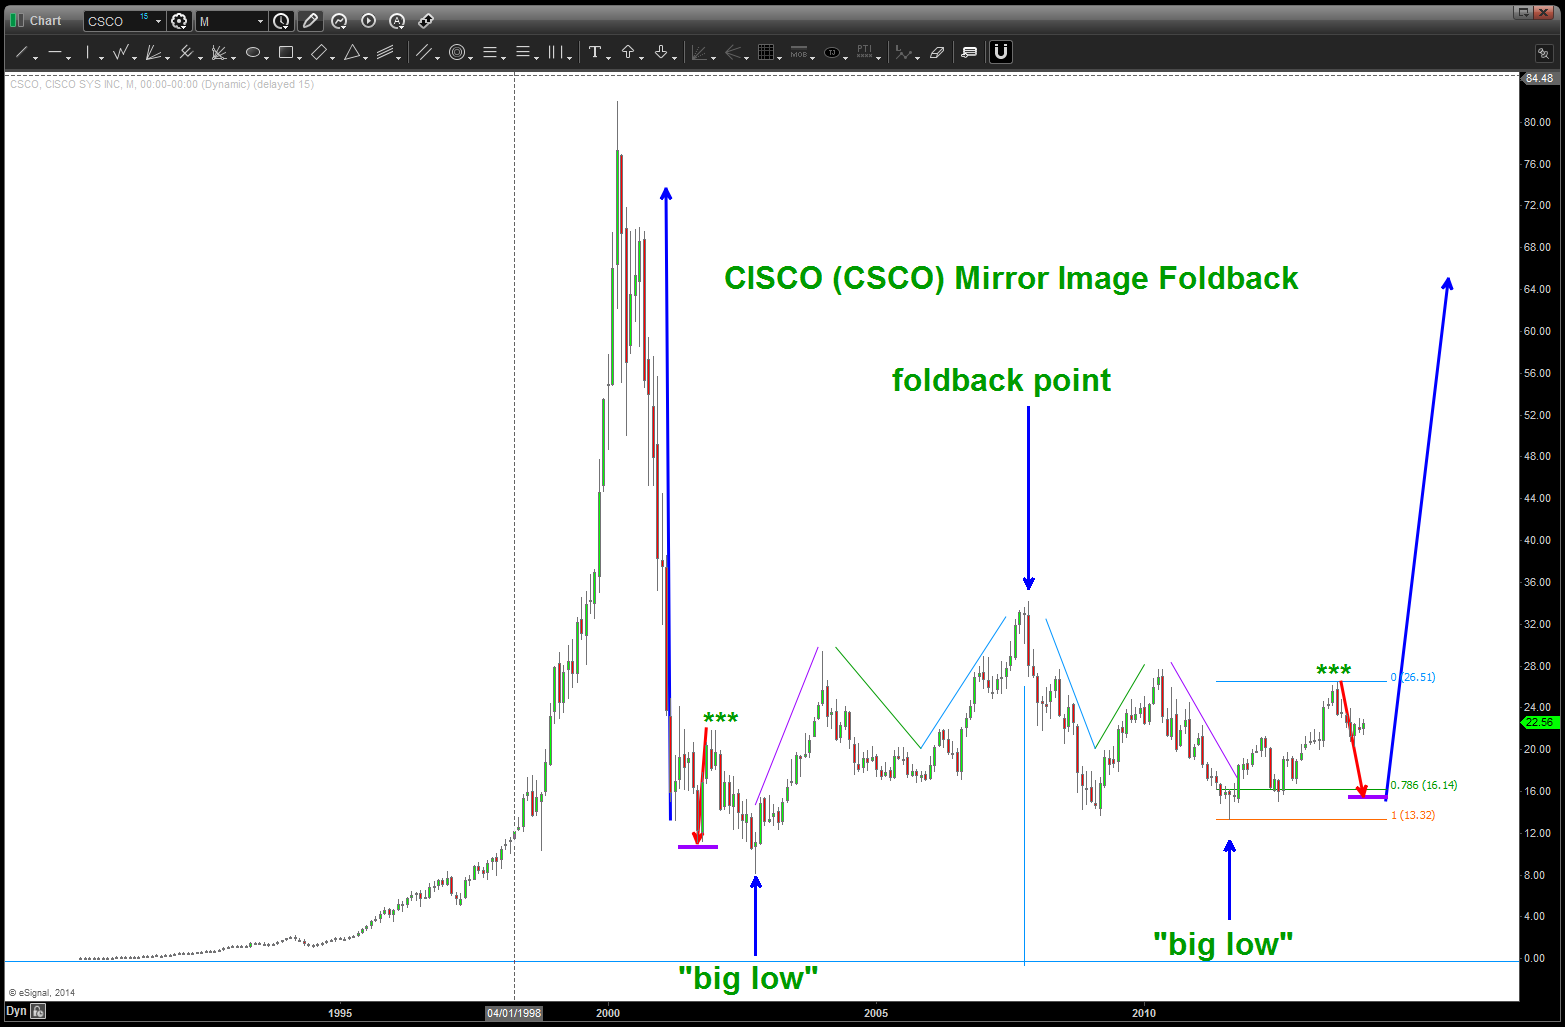
a move down to 16 would be a NICE place to BUY for a potential foldback as shown …KABOOM (?)
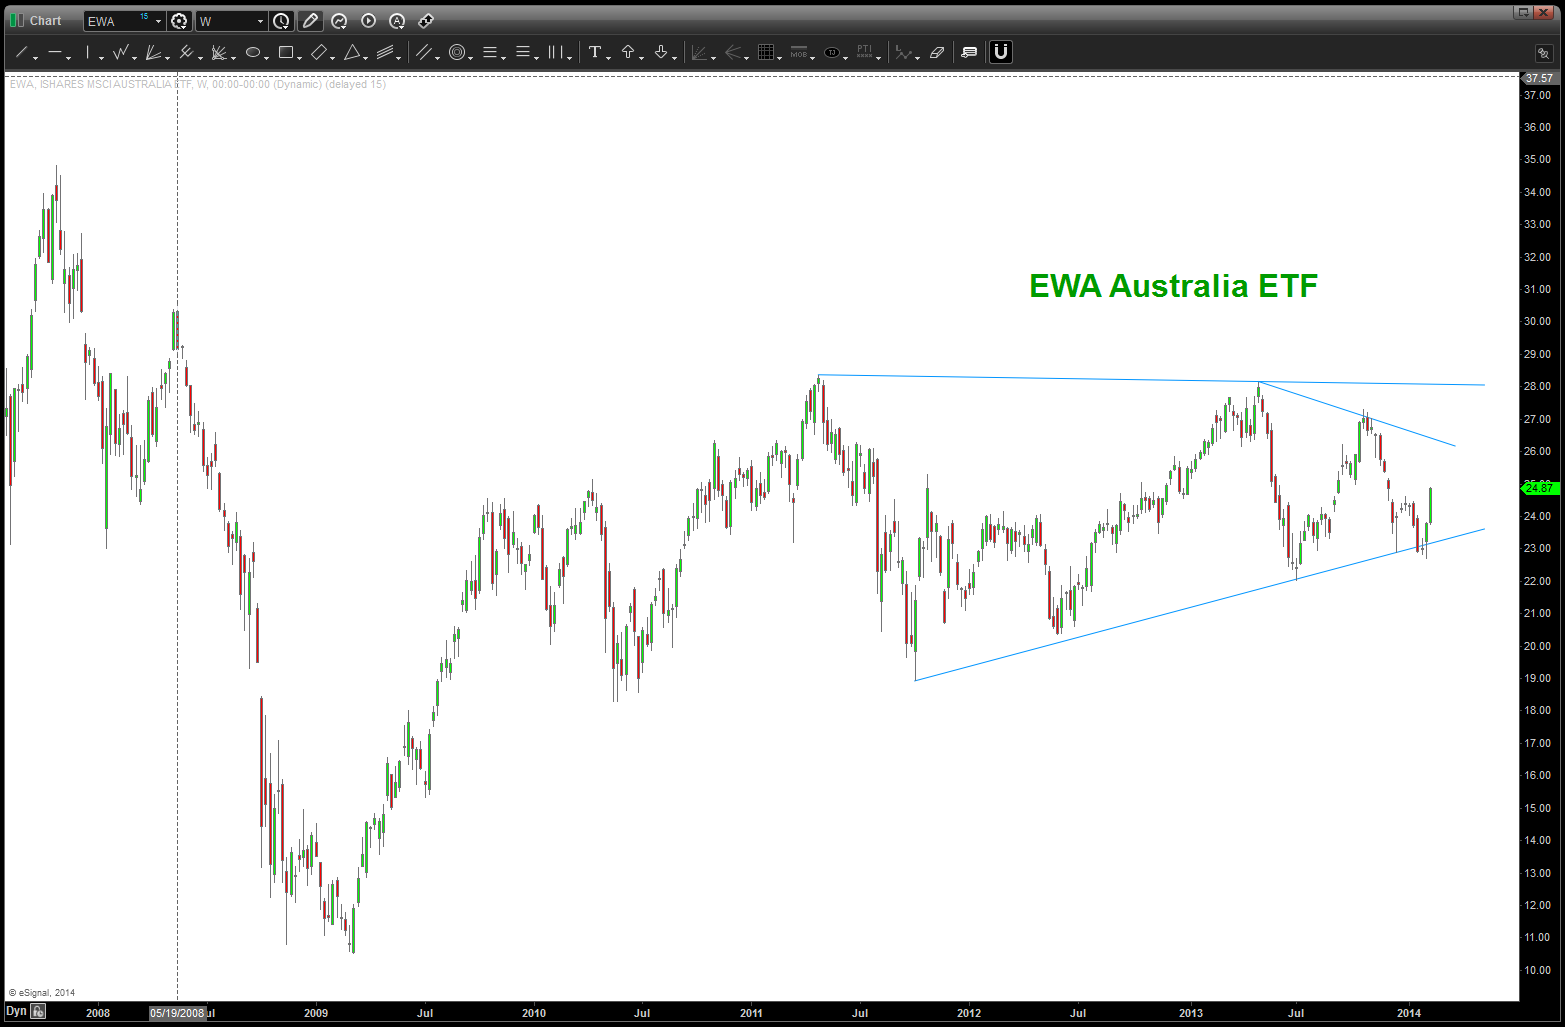
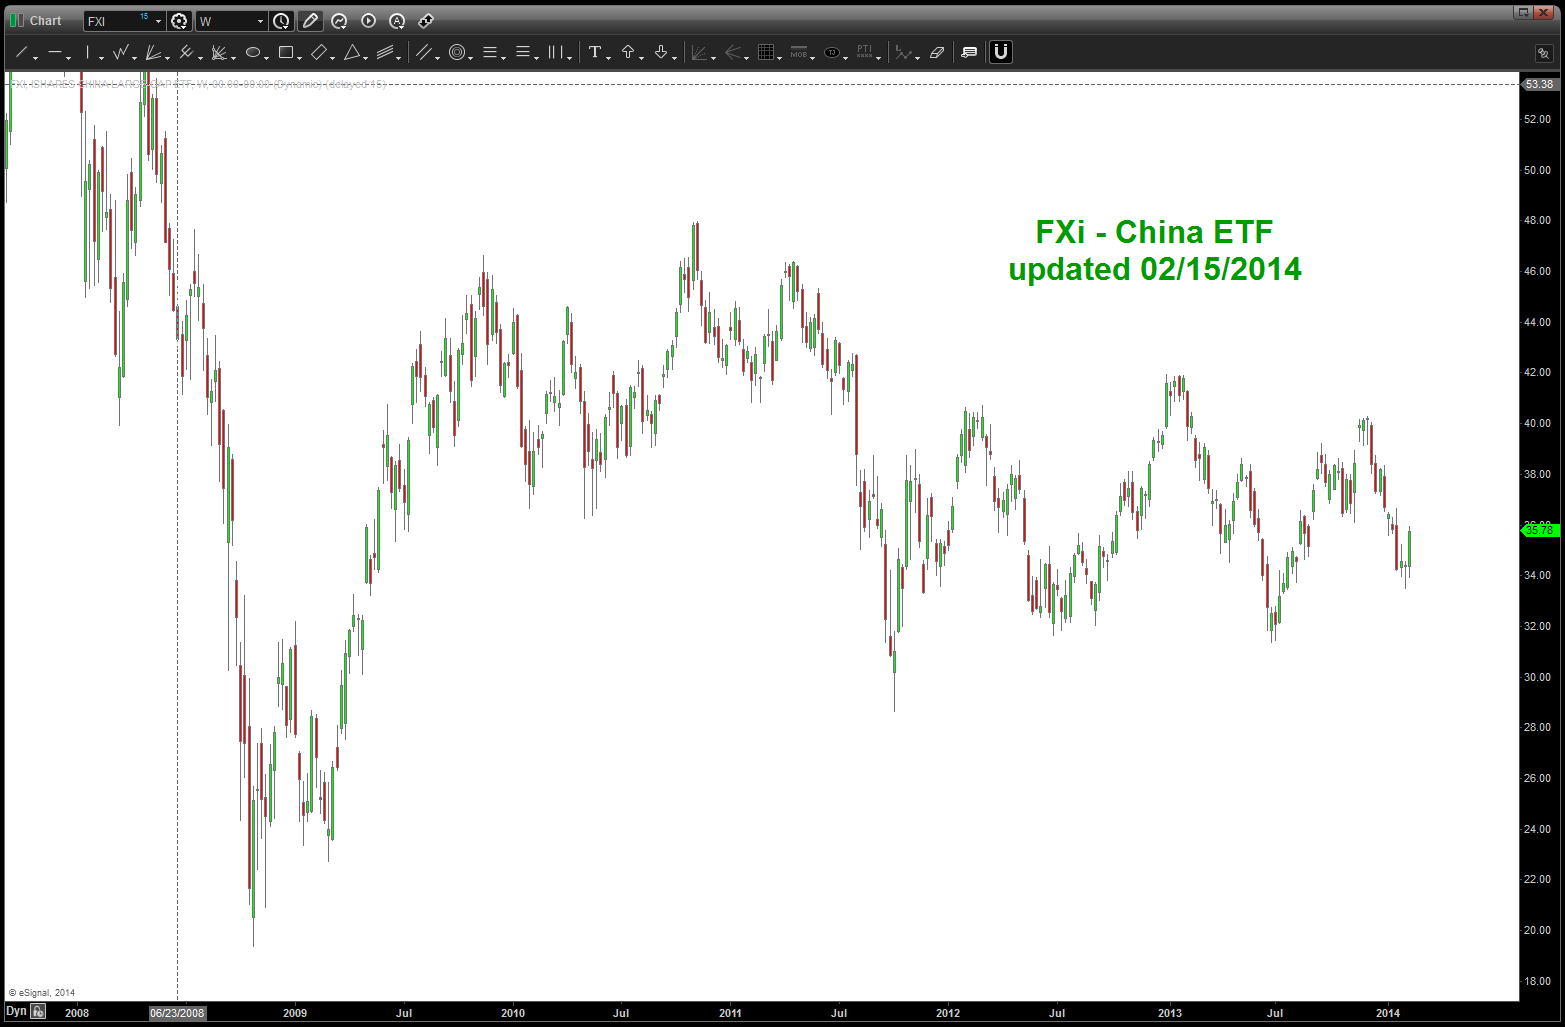
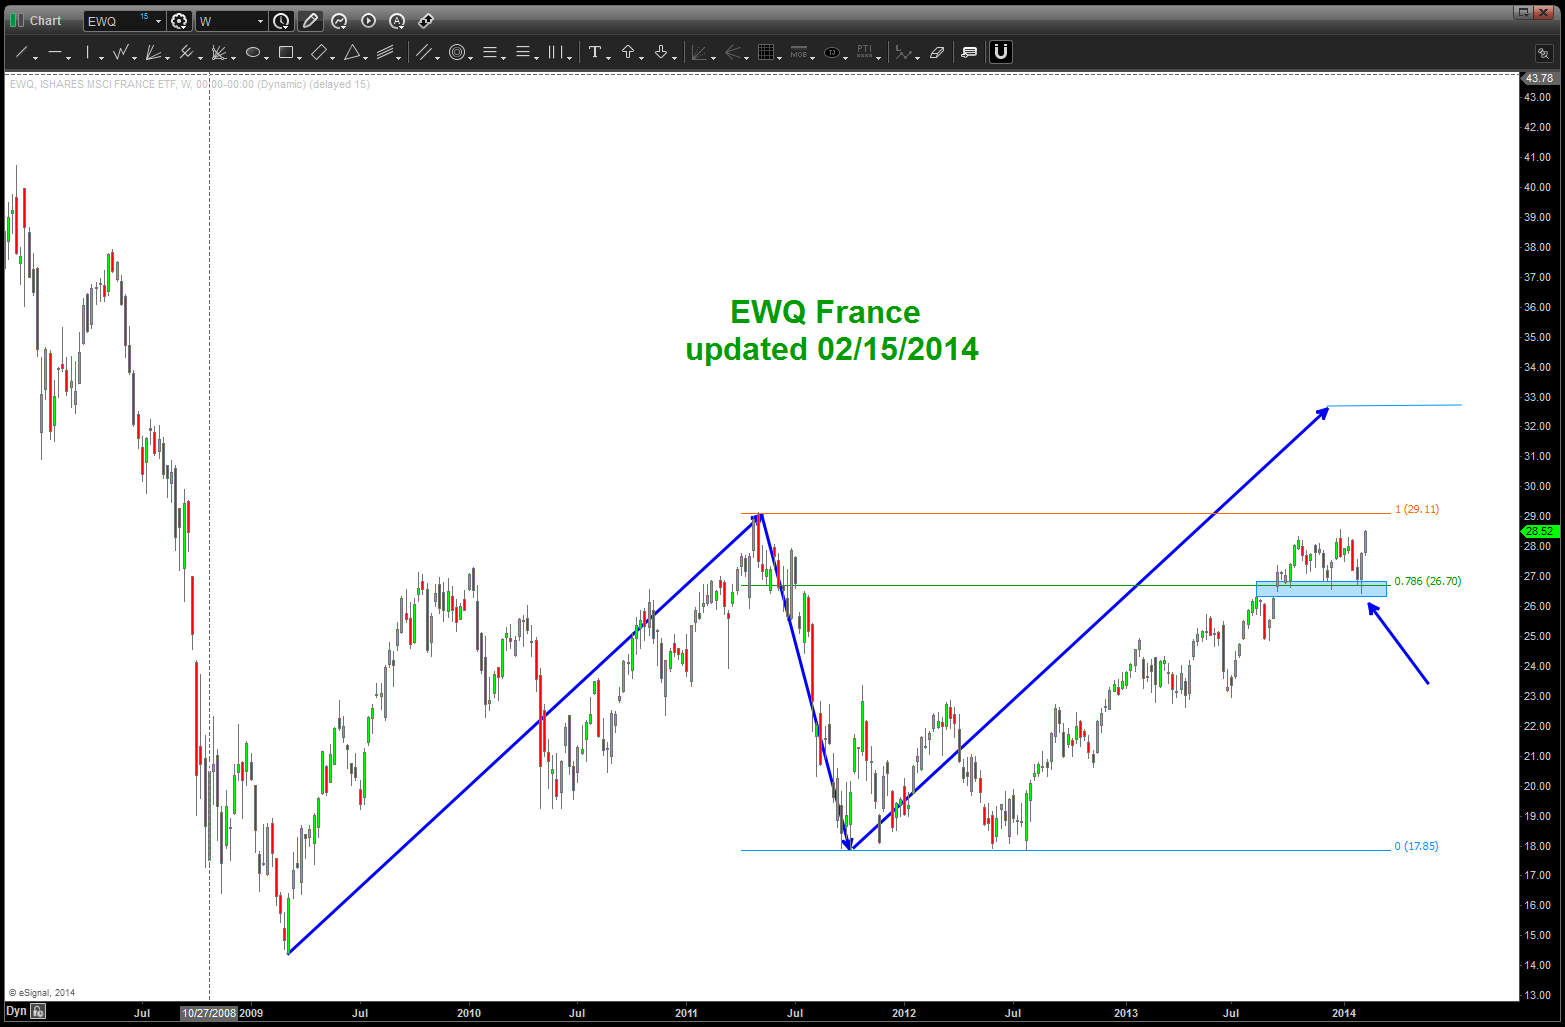
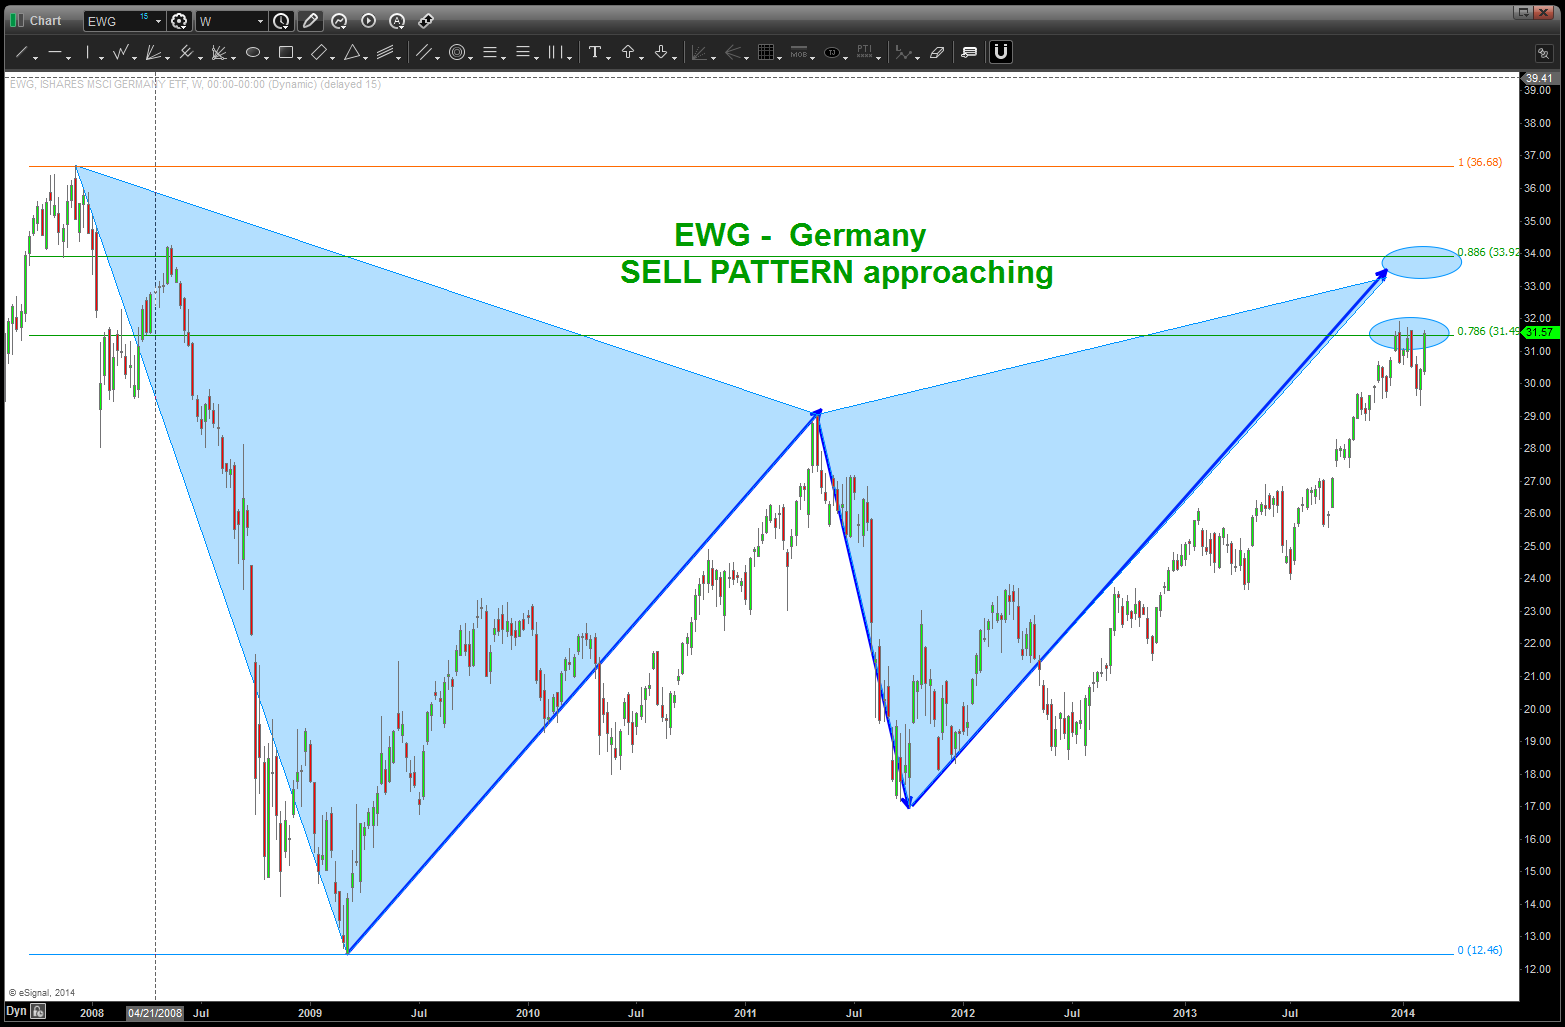
around the world update … part II
Posted on February 15, 2014 Leave a Comment
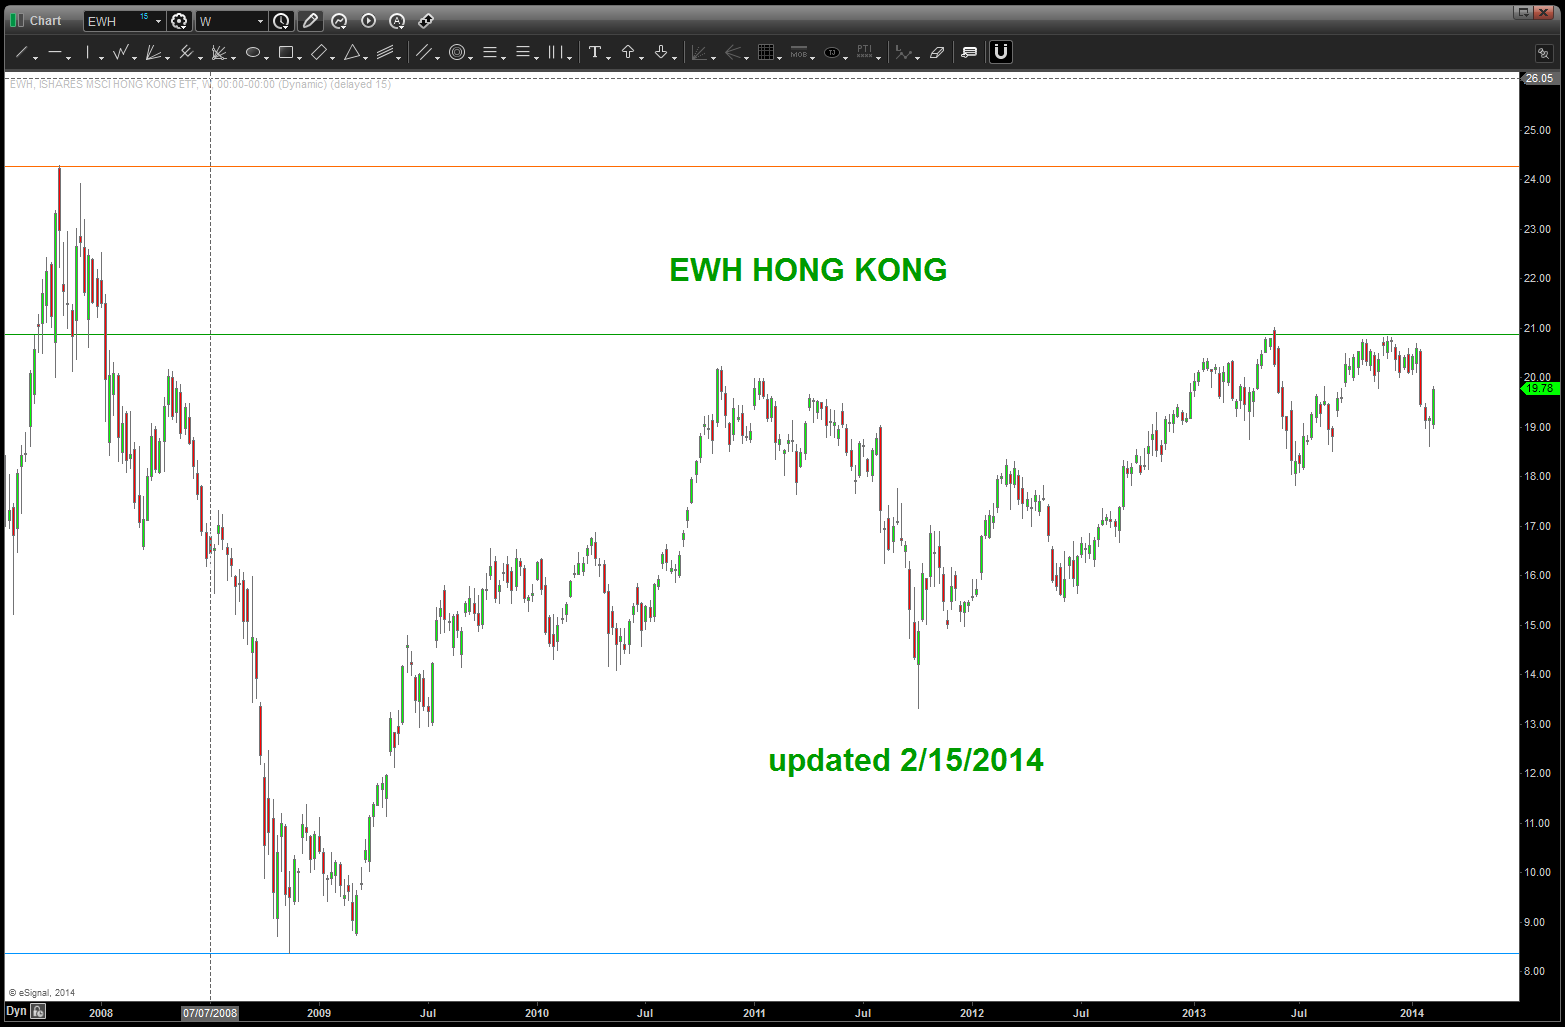
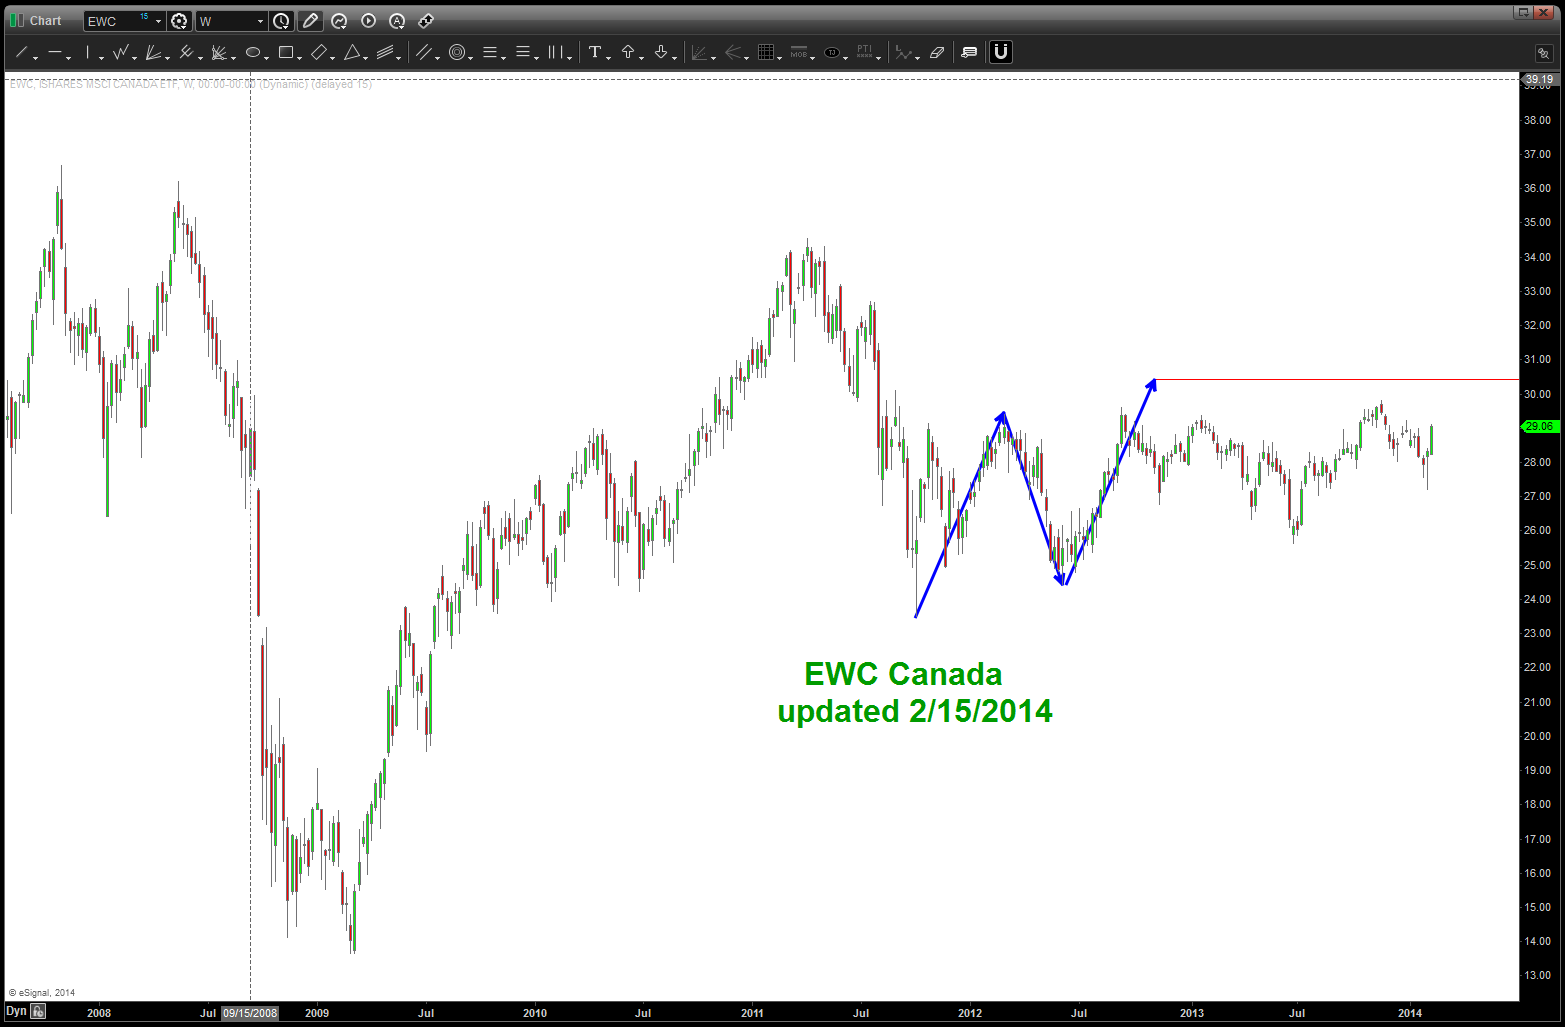
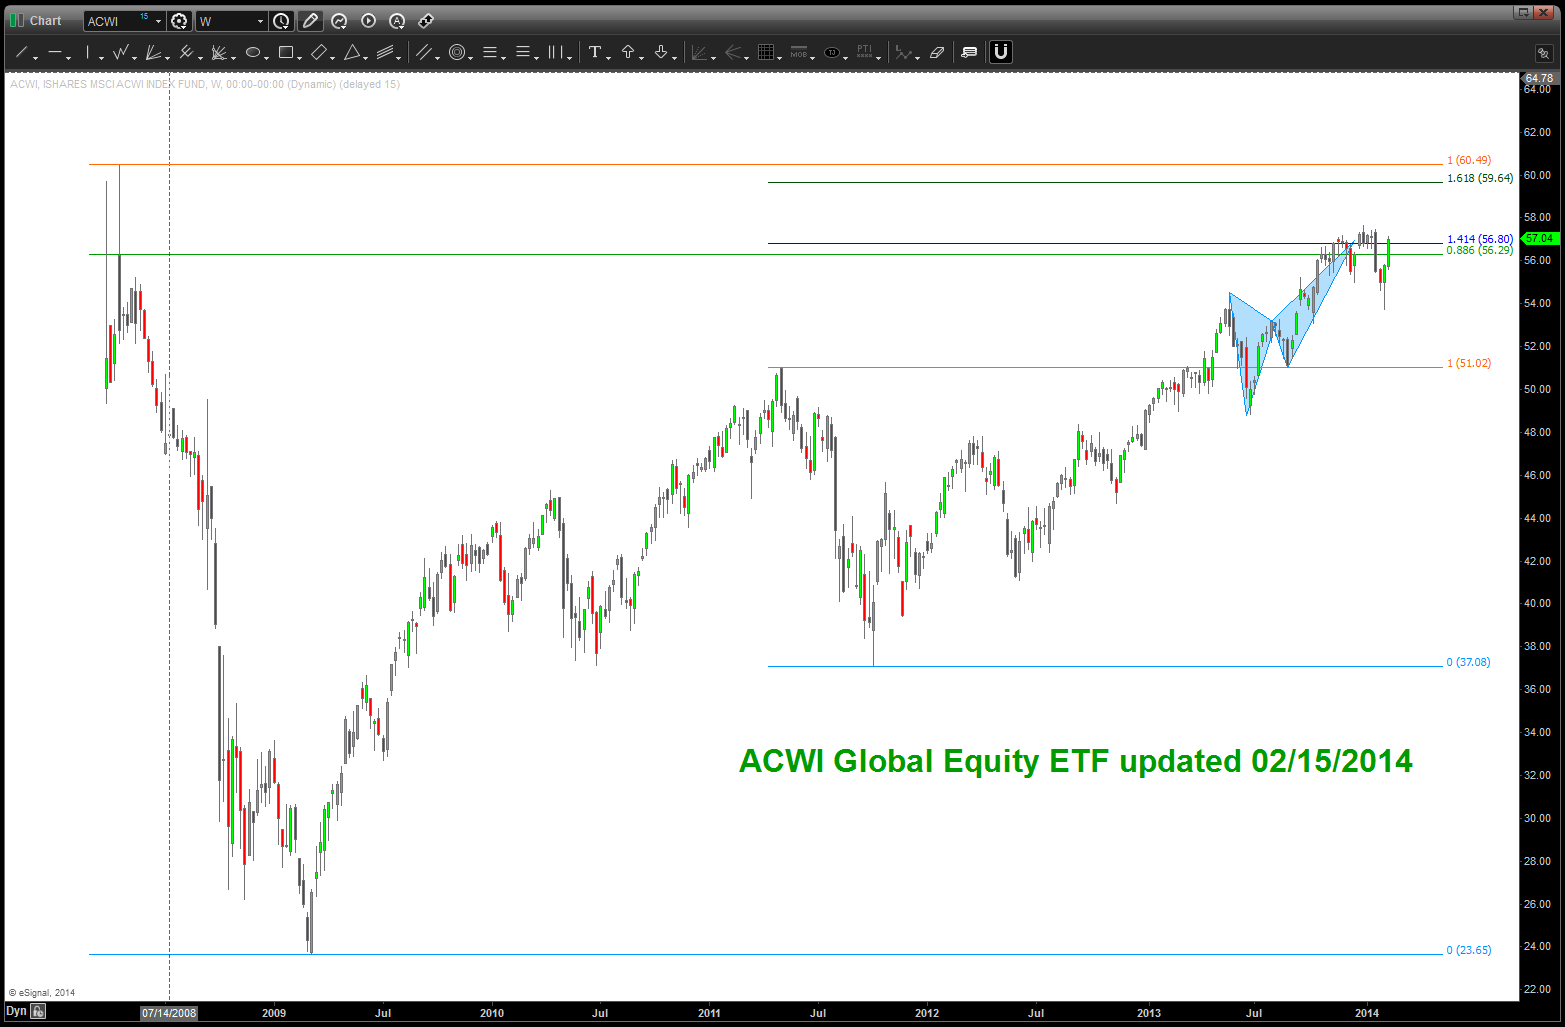
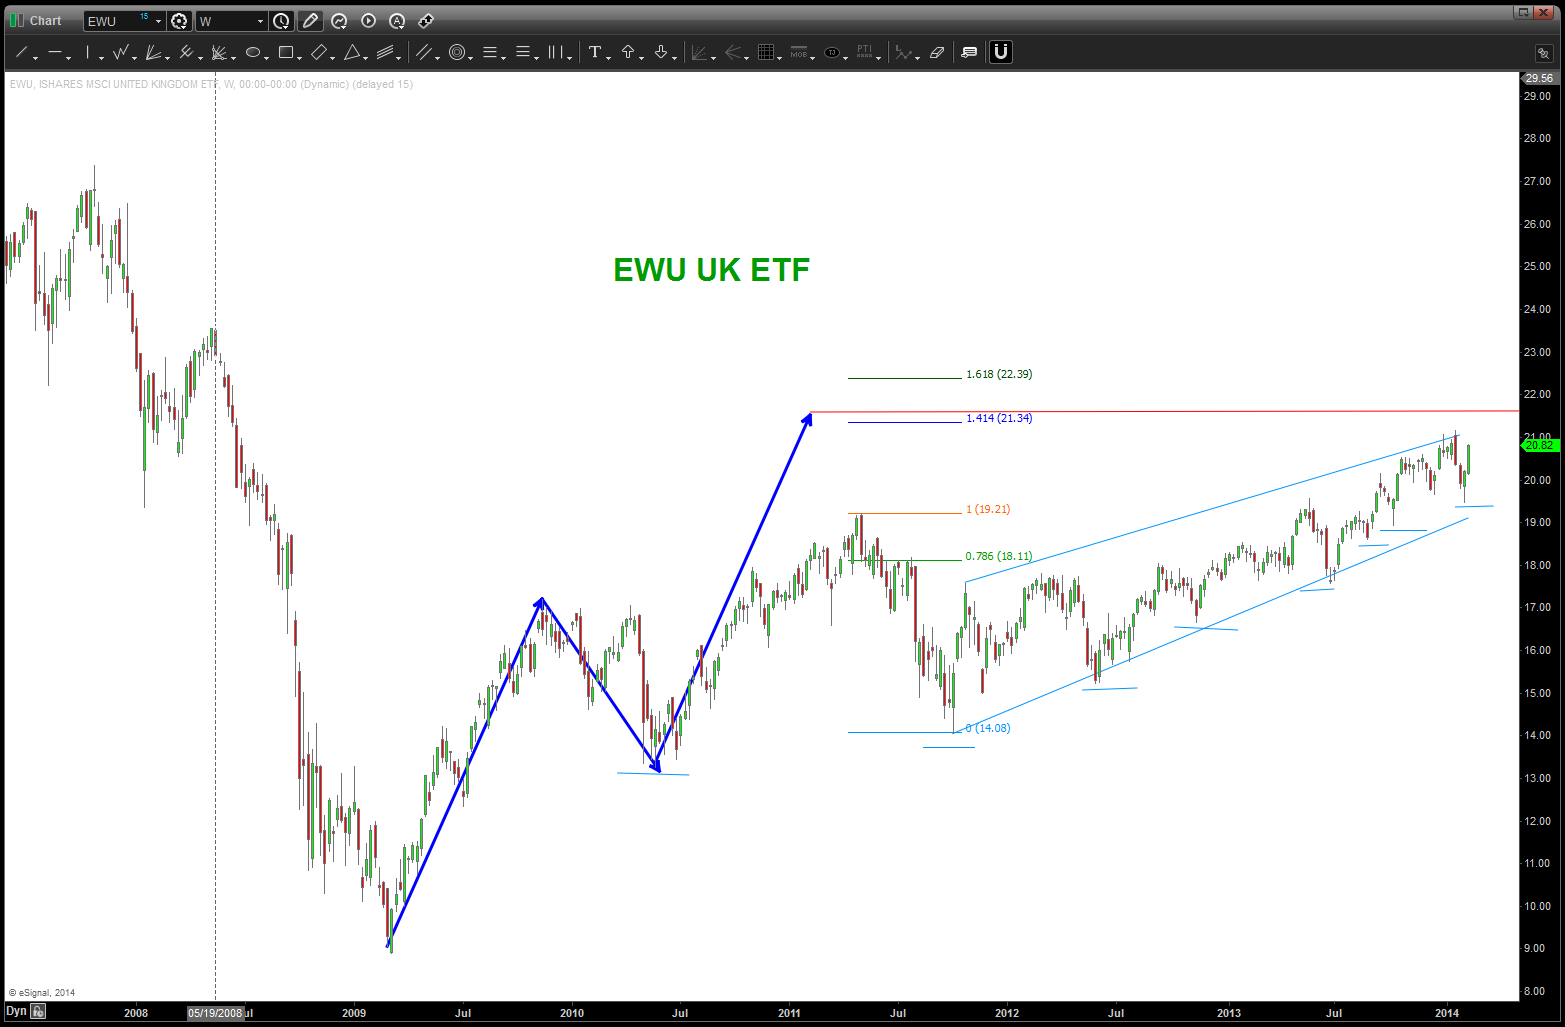
the link above is where you’ll find our around the world cruises since August. this post is an update …what do we see?
- nothing has changed, significantly.
- none of the international indices have made new highs like the US equity markets …
- patterns have provided resistance, BUT not necessarily overt sell signals
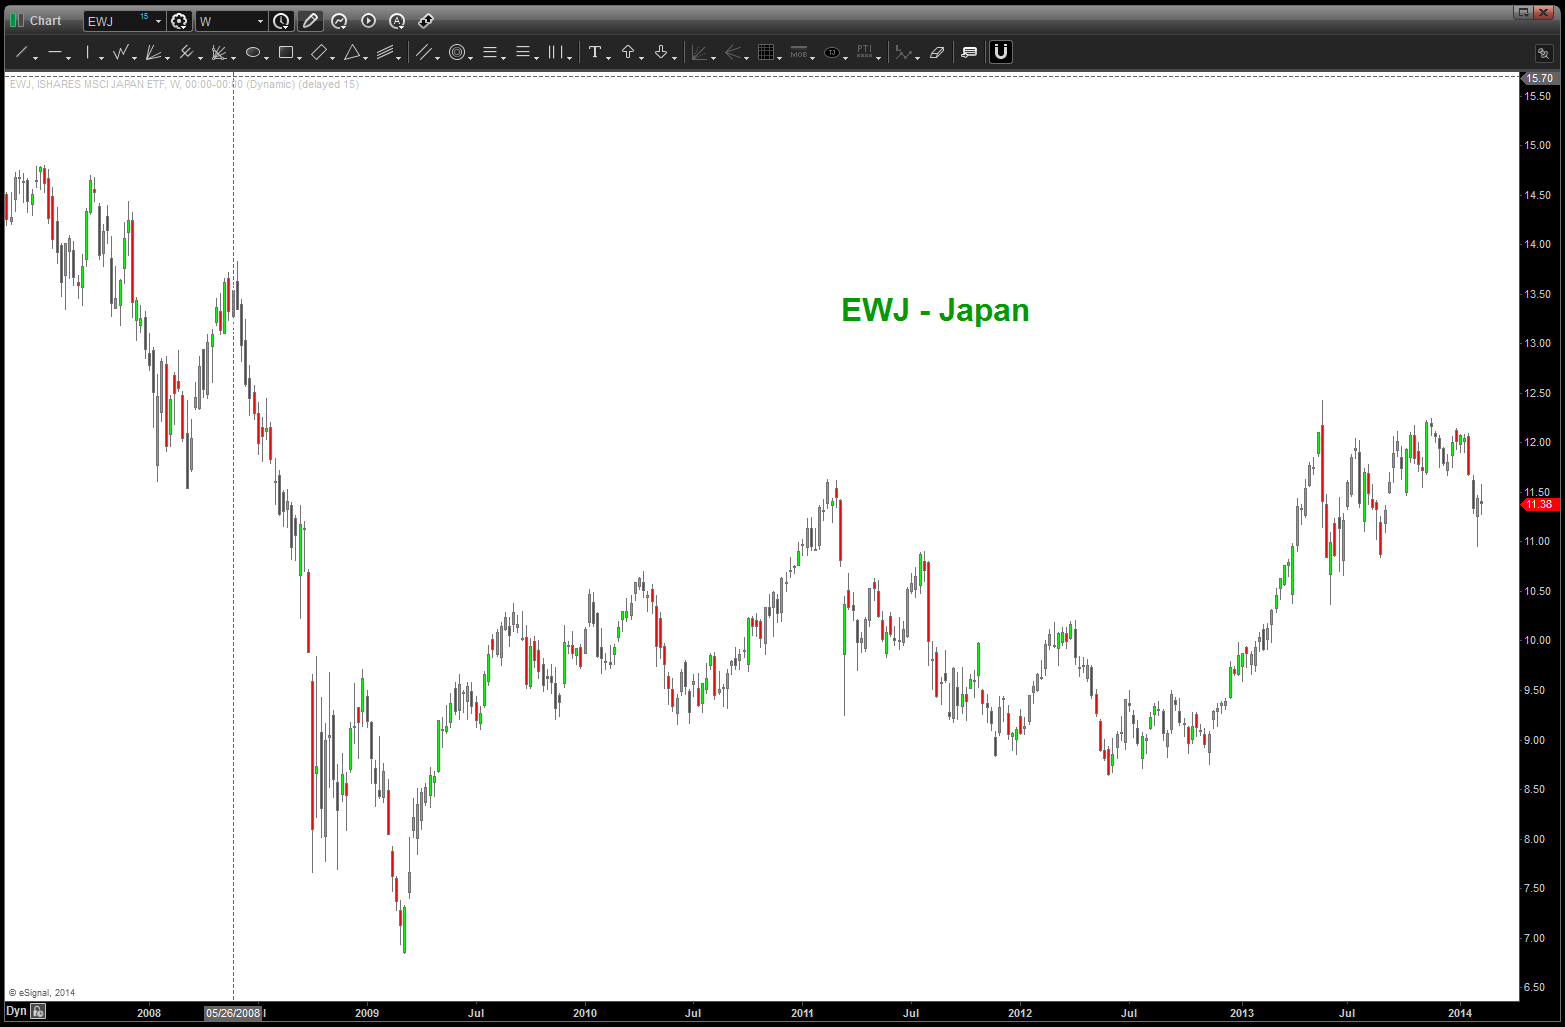
- for the BEARS we are concerned about the SIZE and STRENGTH of the past two weeks of candles. the only country that doesn’t have this feel, as we see the world (literally) is Japan. The European ETF’s show strength in the bullish weekly engulfing patterns.
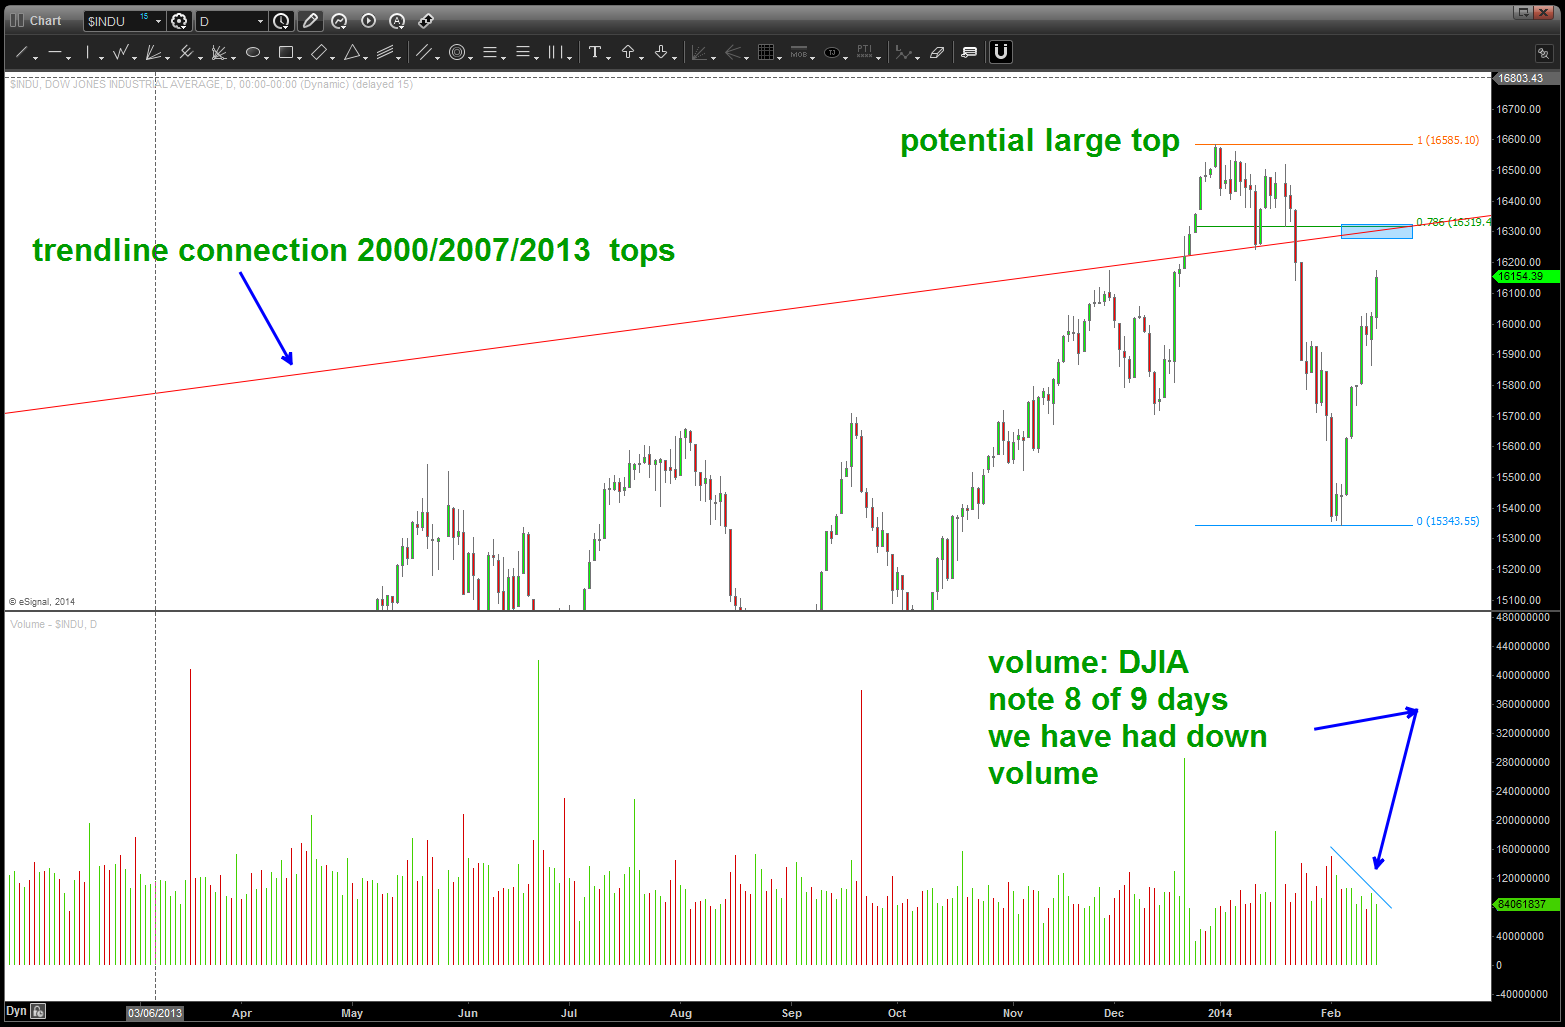
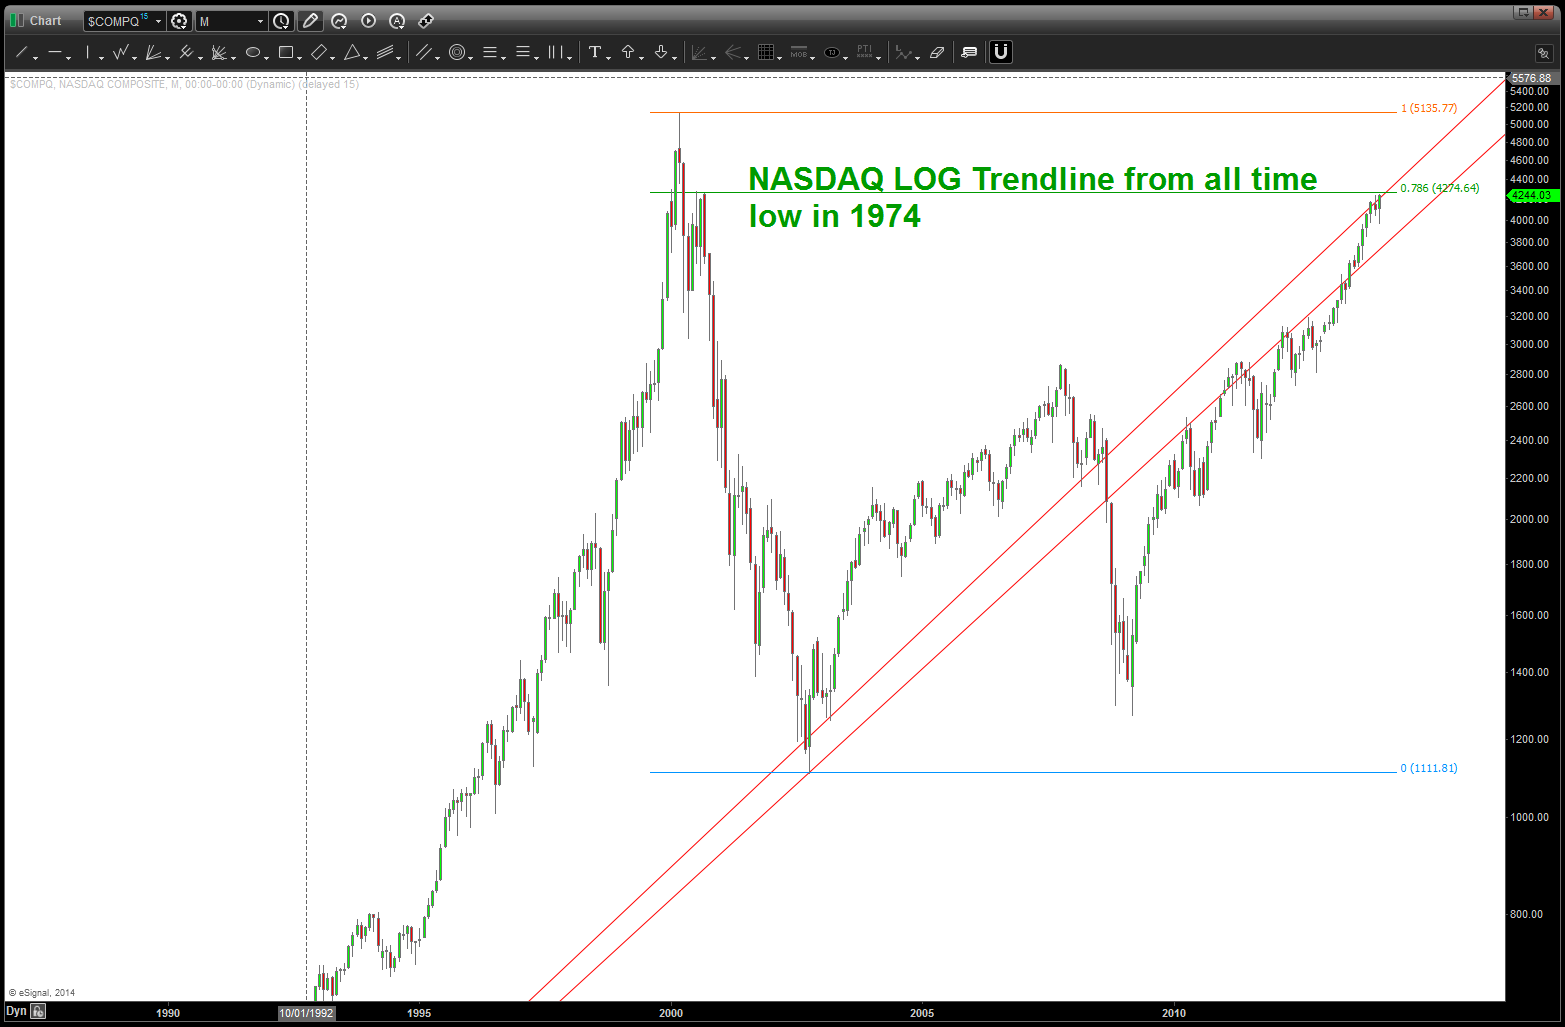
- for the BULLS this is a good sign HOWEVER I’ve enclosed a chart of the DJIA that shows a very strong move UP from the low 9-10 days ago but a VERY significant lack of VOLUME. the VOLUME was BIG going down and SMALL going up (in fact it decreased) hence I find this to be overtly bearish. A very nice 5 waves down can be seen in most of all the indices except the NASDAQ but that is also completing a 1) 5 point reverse wave, 2) 3 drives to a top and 3) all of em’ are smacking into the .786 retracement from 2000. If the US Market starts down again in a “daily C wave” or “continuation 3” we find it hard to believe that the rest of the world won’t also …
- so, we believe this week will be pivotal …
- last, believe it or not, the Dollar is going to be Gorilla that get’s this thing truly rocking and rolling ….one target was hit and held late Friday afternoon.
Here’s a representative example of the VOLUME going UP on the way down and VOLUME going DOWN on the way up …
Gorilla’s juggling dynamite … and the US Dollar
Posted on February 13, 2014 2 Comments
used GOOGLE to look for a picture of Gorillas Juggling dynamite – this is the best I could find
Early in my career I had the wonderful opportunity to get training from Joe Di Napoli (www.fibnodes.com) Highly recommend learning some of his techniques but, most importantly, his understanding of the market structure and the players in the game. One of his favorite sayings is we must realize that “you are entering into a world where the market is truly a caged gorilla juggling dynamite and – the dynamite is lit!”
Additionally, if you have been reading this blog you’ll realize it’s focused 1) 100% on PATTERNS and 2) it’s unique value is tying PATTERNS into the circle of life (fixed income, equities, commodities, FX). W/in the context of the circle, the gorilla is the Foreign Currency Market. According to the Bank for International Settlements – the preliminary global results from the 2013 Triennial Central Bank Survey of Foreign Exchange and OTC Derivatives Markets Activity show that trading in foreign exchange markets averaged $5.3 trillion per day in April 2013.
The Dollar Index is somewhat important as it represents a basket of 9 currencies – the Euro representing a vast majority of it at 58%.
For all intensive purposes – it’s been “stuck” in a 4 cent range but PATTERNS suggest we are “prepping” for a big move … so, in order to get a “feel” for where we MIGHT be let’s go back to the “beginning” at 71 ish and work thru to present…
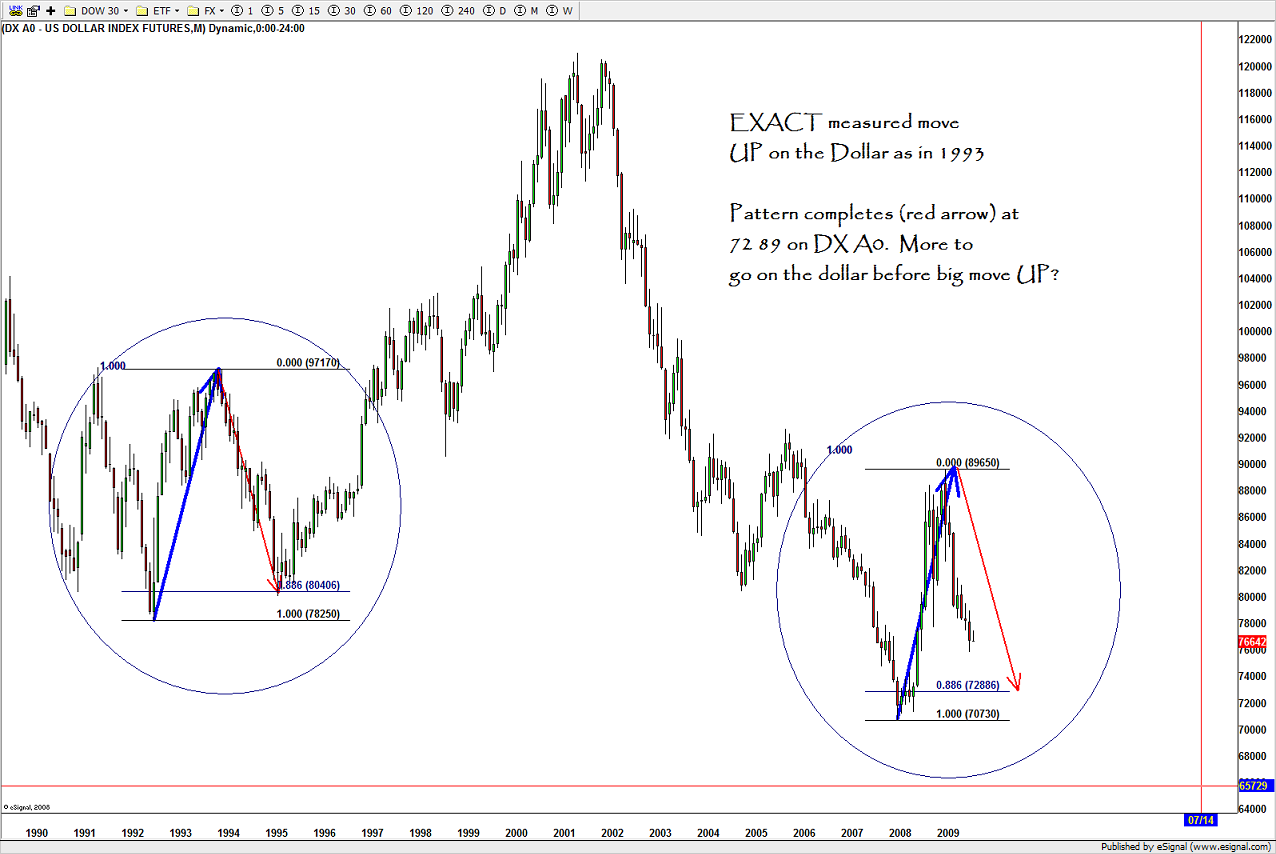
PATTERN at after the 71 low
more detailed look at the mirror image foldback present in the US Dollar
CLIFF NOTES: the BULLISH thesis is that after the 5 waves down from 121, a 3 wave (at a minimum) corrective pattern should ensue (A-B-C) and therefore the bounce has farther to travel. Additionally, it could mark a MAJOR low and we are starting back up for 5 waves. The BULLISH consensus for the US DOLLAR is that this move UP is not complete. Please see this chart below … and, notice the EXACT move up from the PATTERN shown above at the “2 or B” level.
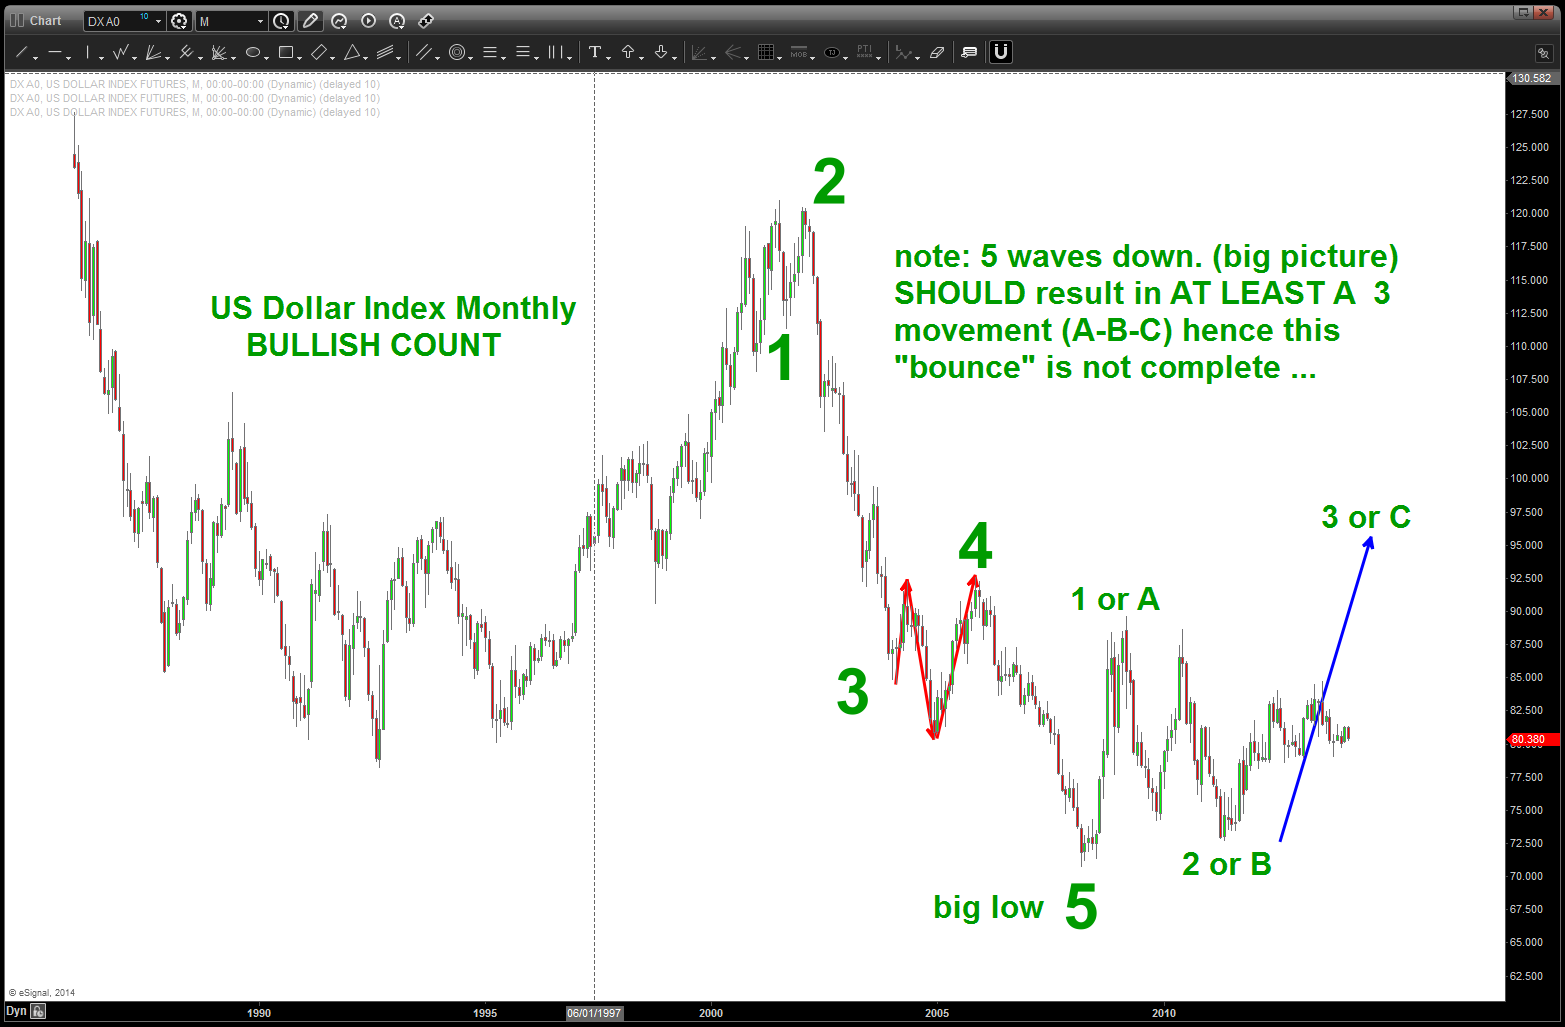
note a clear 5 waves down should lead, big picture, to a 3 wave move up (at a minimum)
so where are we now? Without showing an “elaborate” count, we can see by the chart below that we smacked right into a “big picture” .618 price projection that had it’s genesis from the 71 price low.
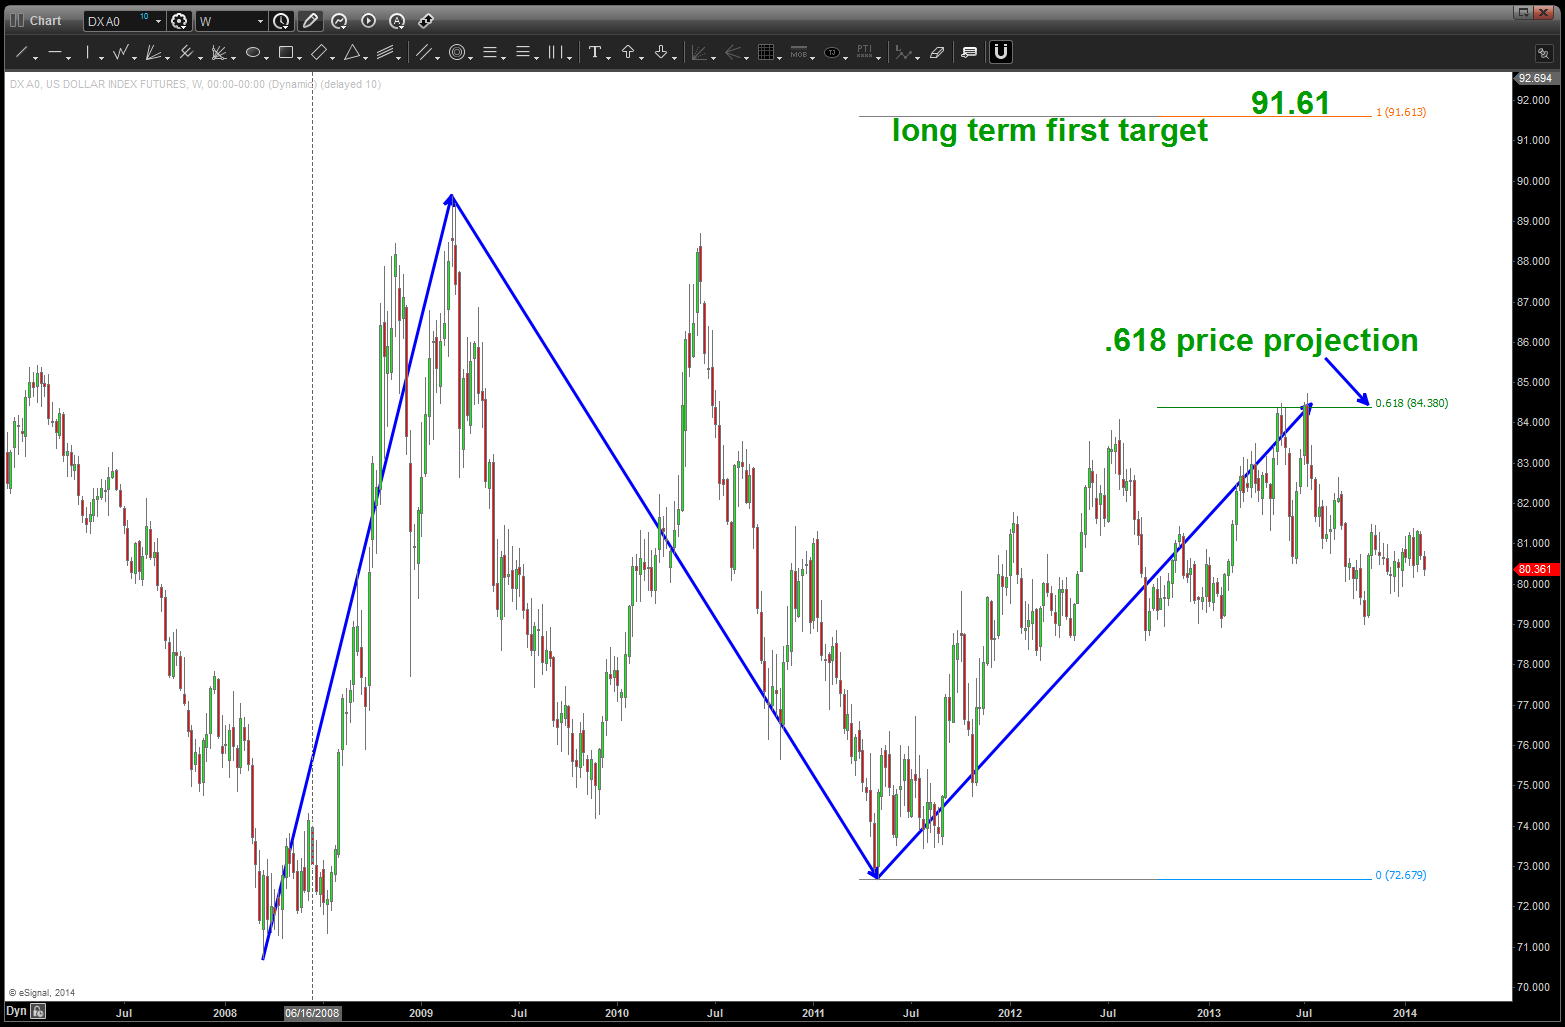
.618 price projection on the US Dollar causing the resistance
here’s the possible bullish count from the “2 or B” low that shows a POTENTIAL 3rd wave underway. IF the count is correct, then the 79 level has to hold and is very crucial as it suggest that the 3rd wave should begin …soon and UP we go.
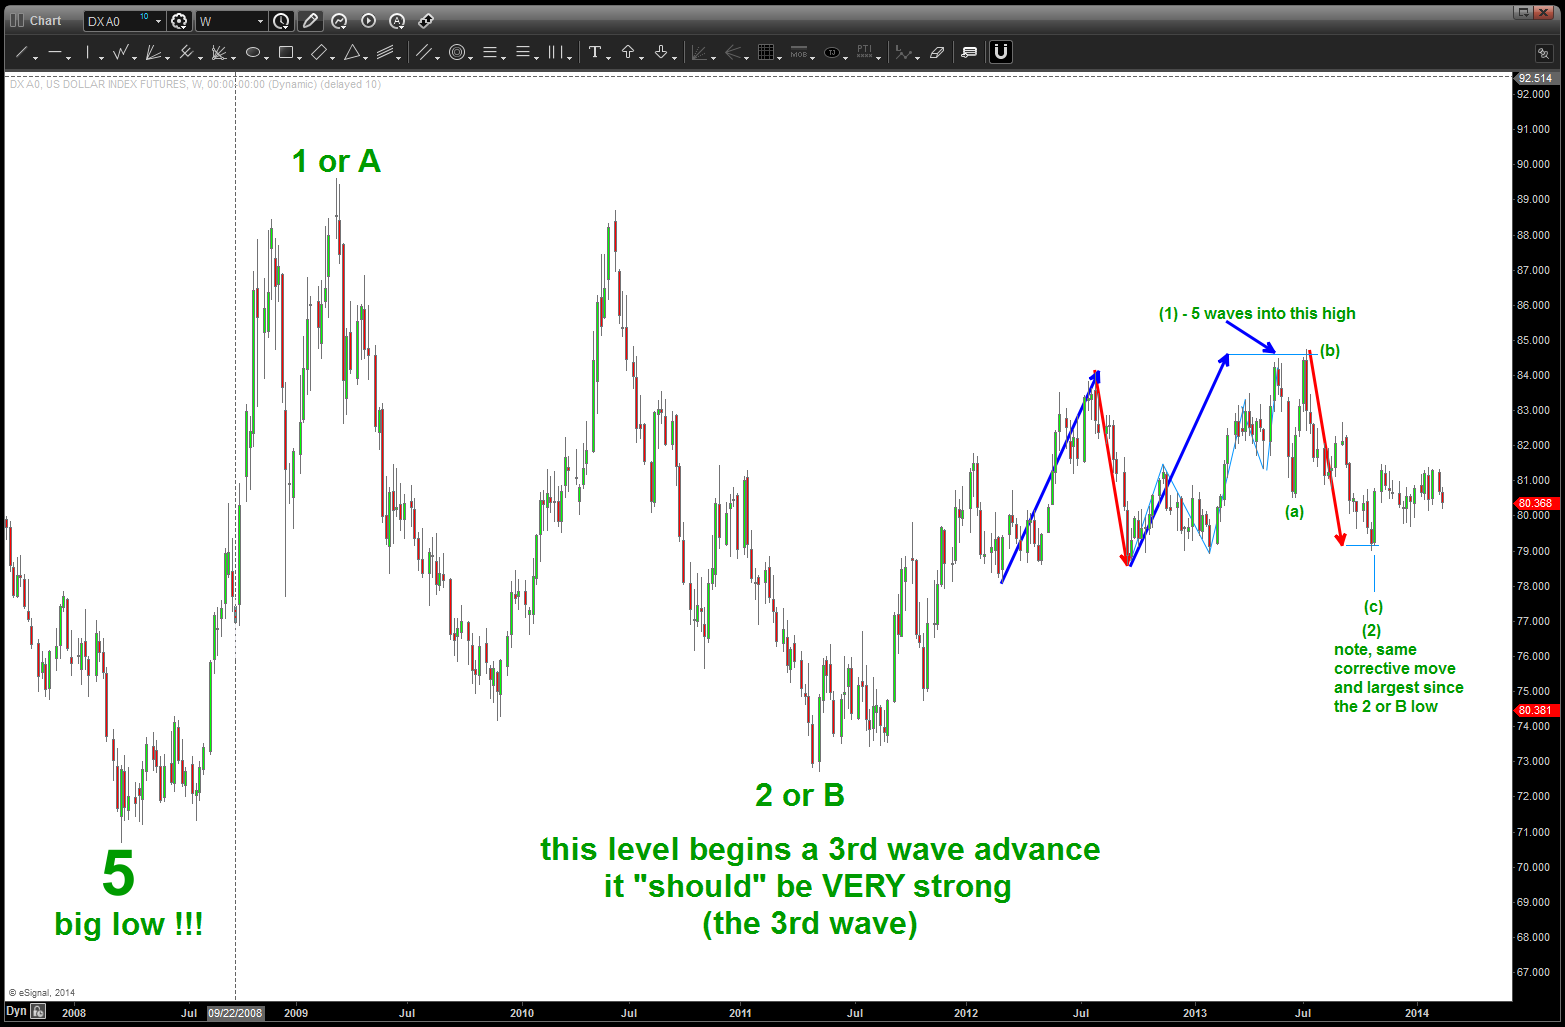
potential count showing a bull move
now, we need to drill down one more time frame – that of the 240 minute chart to see what we have going on. YES, we have a BULLISH PATTERN on the US Dollar at 80.05-80.08. In order for this entire thesis to be correct, then I believe this pattern needs to hold for the strength in the US Dollar to begin…
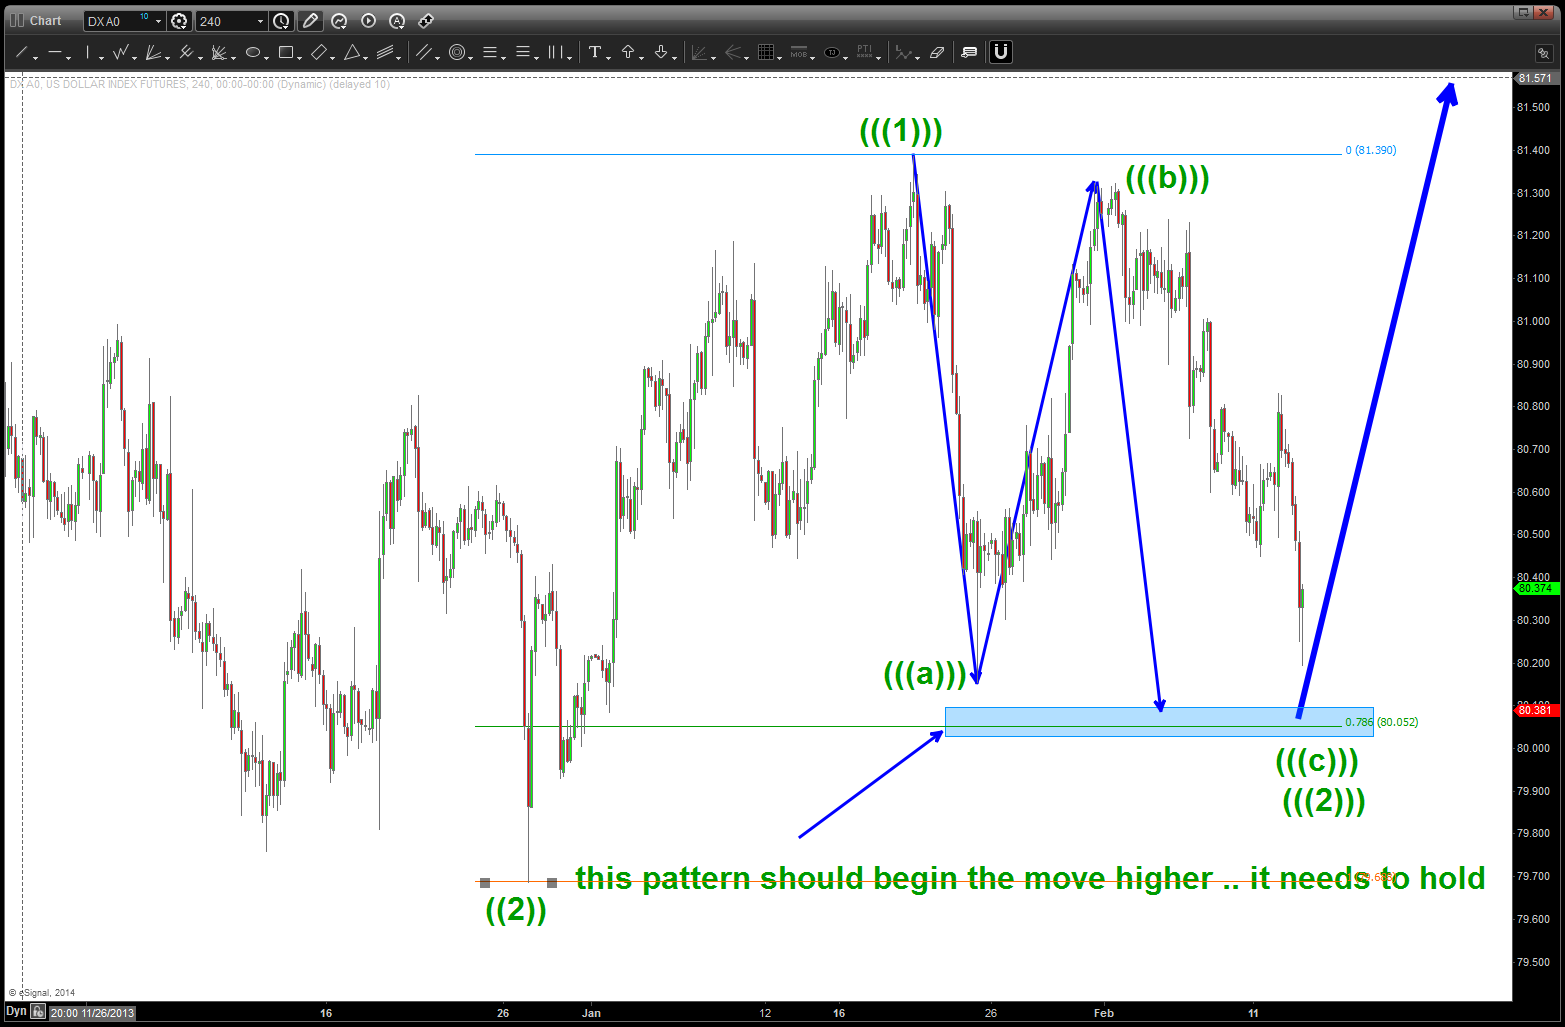
BULLISH BUY PATTERN PRESENT]
the last BULLISH PATTERN present …
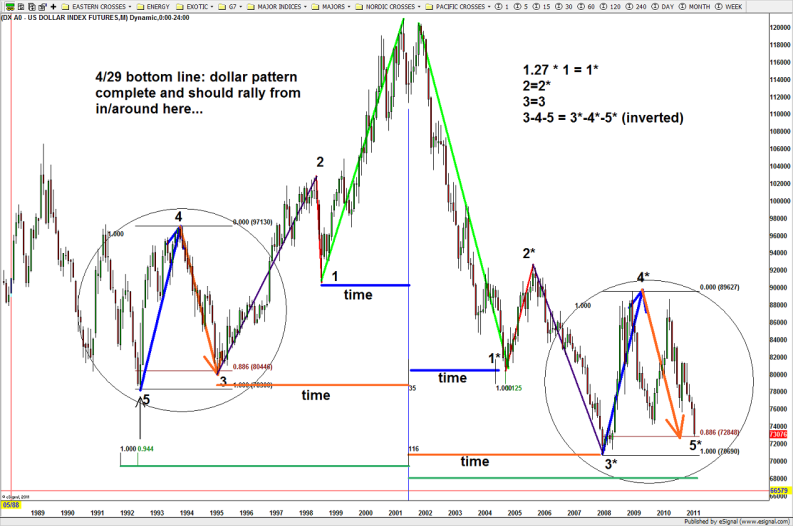
PATTERNS fail …they are an EDGE and over time they have been statistically proven to give us an edge. But, what if this pattern does fail? Take a close look at the following two charts … I have not shown this before, but we need to take into account the 5 wave move down from 121 and the .618 price projection — they are starting to form a huge B wave triangle. The 5 wave move into the low is a BIG BIG A and then current structure is forming a BEARISH TRIANGLE w/ the ‘c’ portion just completing (due to the exact nature of the .618 price projection) and ‘d’ and ‘e’ to come …also note the purple trend lines. One forms a head and shoulders and the other is showing the support for the US Dollar since the ‘b’ wave low …
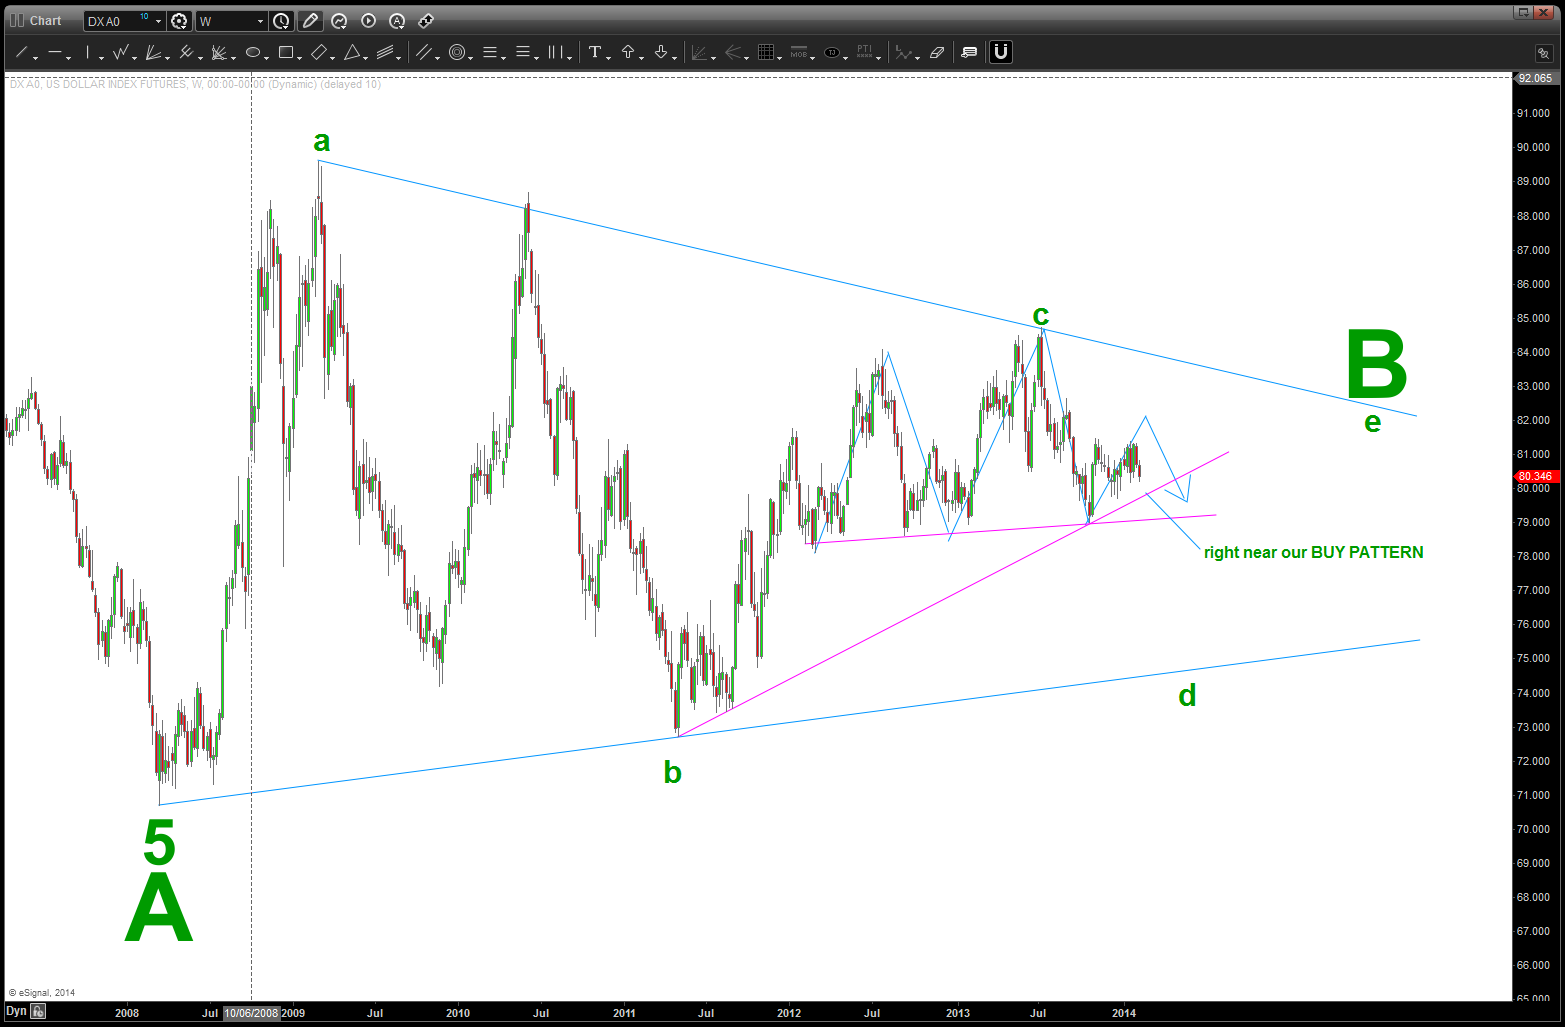
do we have a multi year bearish triangle forming?
here’s one last thing to consider …. take note of the measured move UP move from the past and what happened after it completed … a bearish omen?
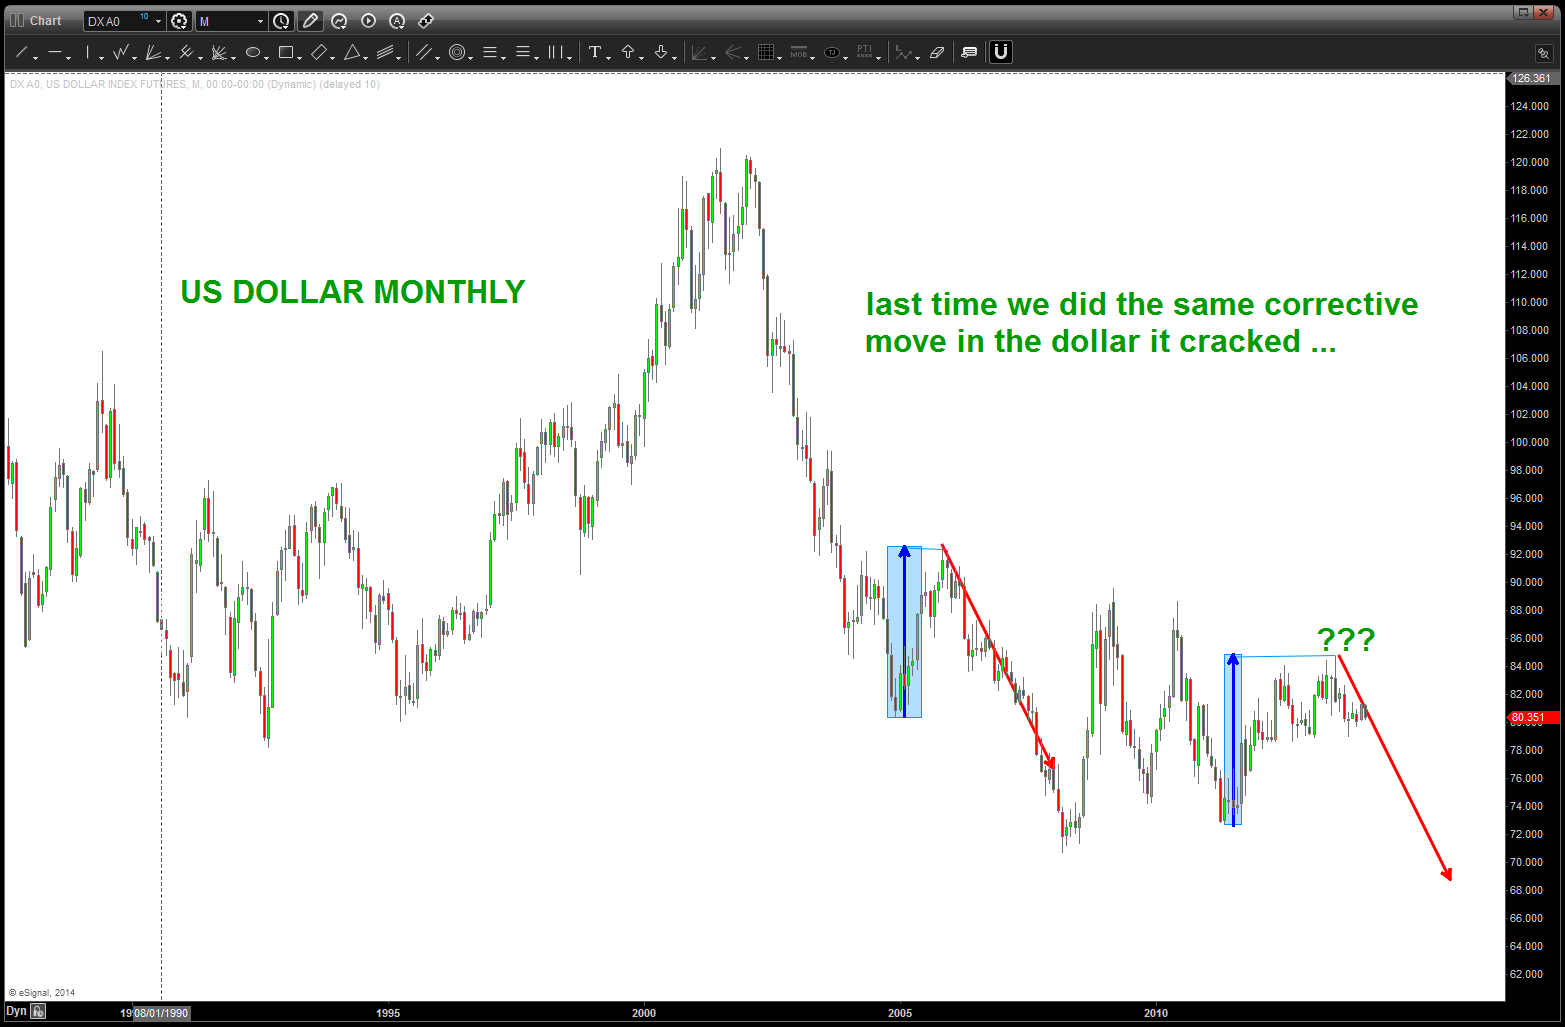
a measure move omen ?
CLIFF NOTES:
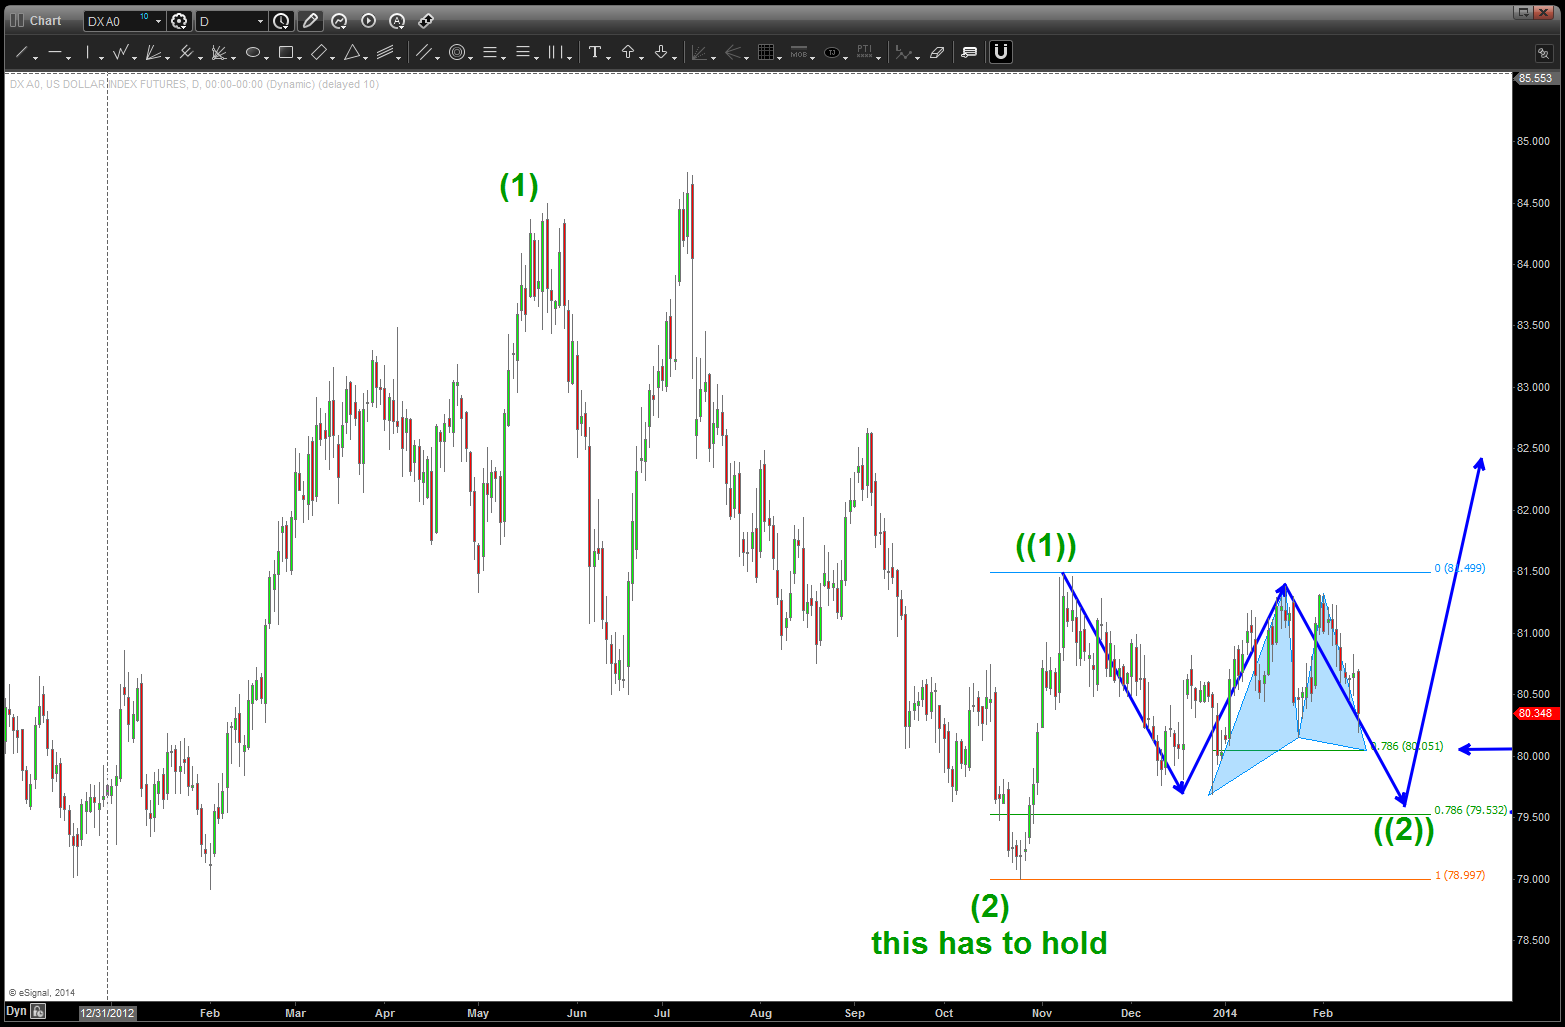
- w/ the deflationary forces present, the dollar SHOULD strengthen. A well formed count supports that and a PATTERN very very close also holds that thesis as correct and positive. The first is the once completing at 80.05 on a shorter time frame and then 79.53 on the daily. They need to hold – w/ the 79.53 as the major pattern if the bullish thesis is correct. Remember, w/ our rules we could go all the way down to 79 again so, for all intensive purposes the 79 level is the line in the sand. We have two symmetrical BUY patterns present …
- HOWEVER, if we lose the 79.53 level THEN it will open up some serious selling. PATTERNS will then shift to the B wave triangle thesis …
- Last, we have MAJOR patterns complete across the indices and they are “acting” like the double tops that formed in 2000 and 2007. We have the Dow Jones Transports finishing a pattern from the late 1800’s, we have a potential generational low in interest rates complete and PATTERNS suggest one more wave lower in the commodities …
It’s all coming together and one of the circle of life gorilla’s is going to drop their stick of dynamite and big old explosion is going to occur …
Gold is getting close …to a BUY
Posted on February 9, 2014 Leave a Comment
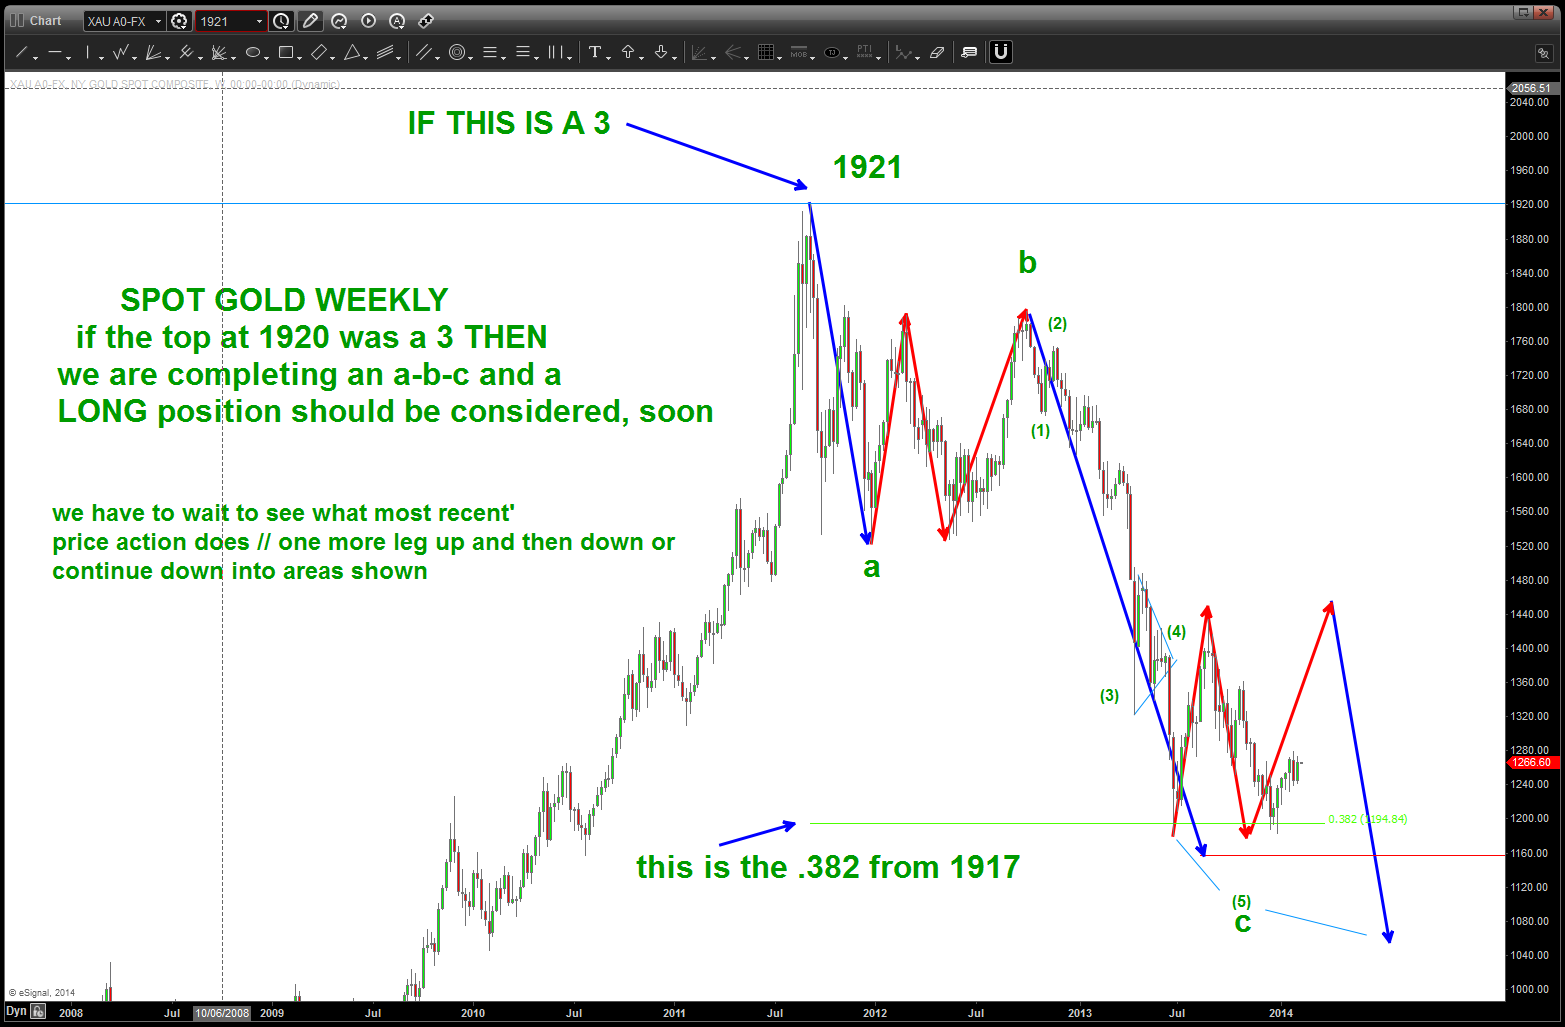
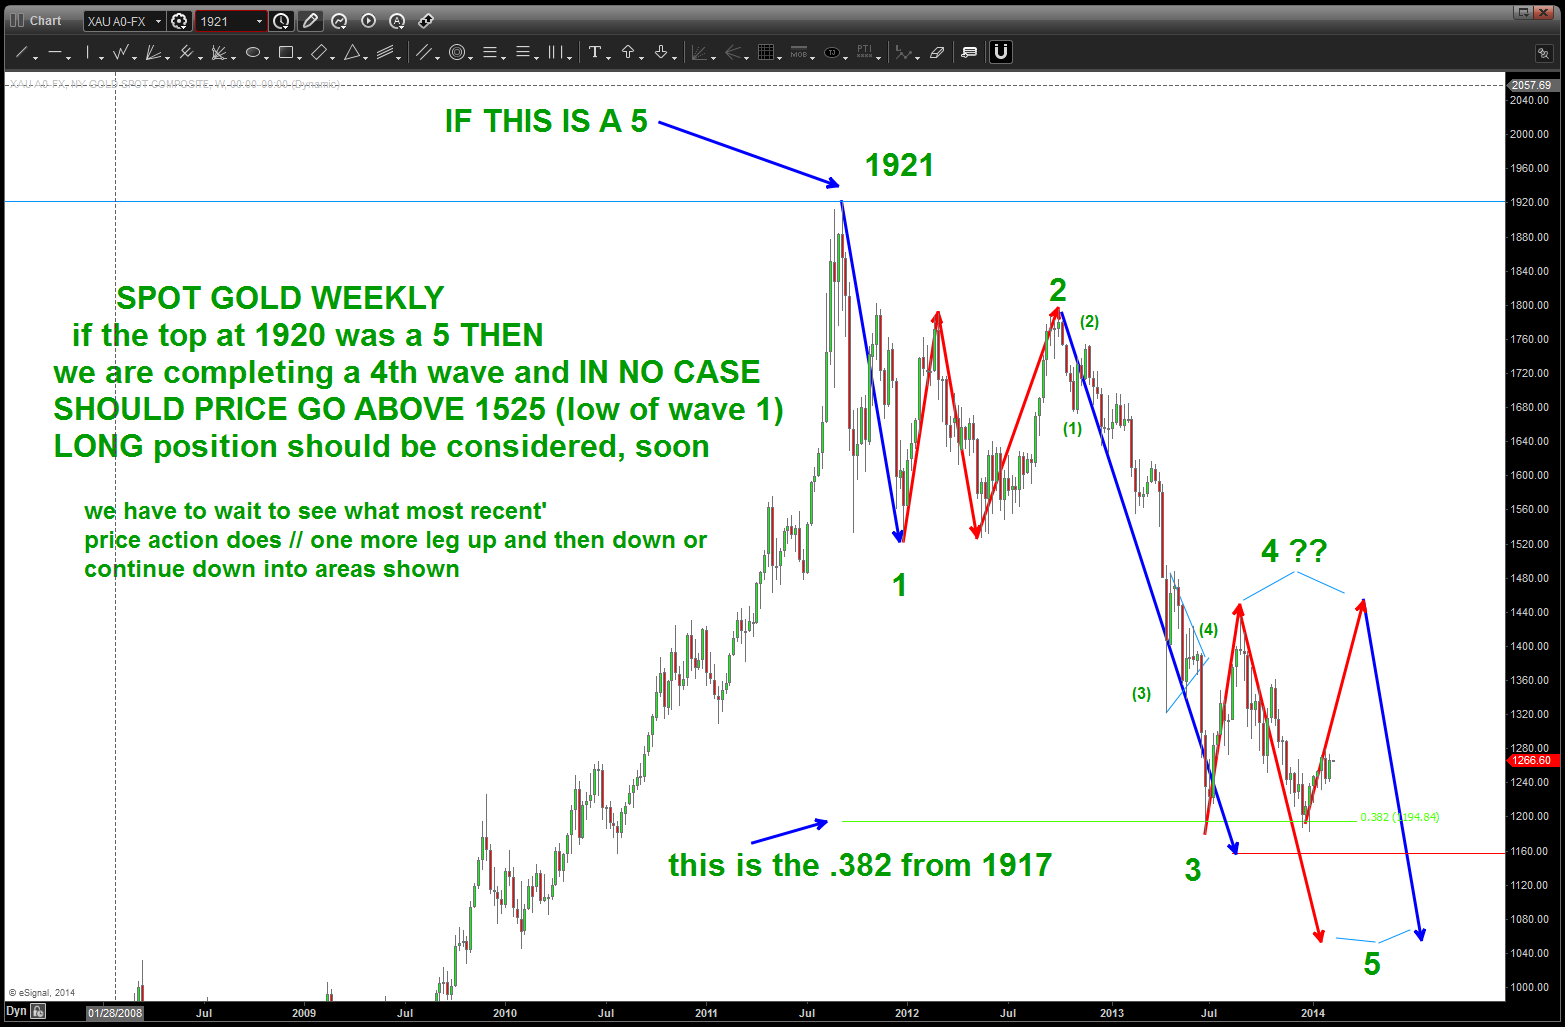
I really DO NOT KNOW or have a BIG OPINION on the top at 1920 on spot Gold. Well, it was either a BIG 3 or BIG 5 but I just don’t know … doesn’t change the fact that a long on Gold could be coming in soon. It’s just how high it will go … if the top was 3 then we’ll see new all time highs. If the top was a 5 then this current bounce shouldn’t see higher than 1525. Then into new lows but a BUY is approaching …
We do know that the correction that started in the 1980’s from 850 to 250 was roughly 600 bucks and we went 160 points lower than that so this current move lower is the largest corrective move in the history of gold prices. so we got that going for us, which is nice….
right now, the spot gold complex reads: WAIT but we do have a strategy to watch and monitor over the coming months ….
Fixed Income Pattern and October 1987
Posted on February 8, 2014 2 Comments
there are some very interesting things to point out regarding fixed income tonight …
in the chart below note the following:
- a swing low has never been broken in this bull market run that started 33 years ago. they are shown by the dashed green lines
- we think a MAJOR top is at hand in the 153 area // this bounce is expected.
- the blue triangle represents the same corrective move that we just completed in both PRICE and TIME. NOTE — this same correction happened before in October 1987. Also note, there was no panic crash in the bonds. I’m not implying the market will crash – I’m saying the exact same PATTERN appeared and we have completed the exact same PATTERN.
- the largest corrective move in fixed income occurred during the 2008-2009 panic. the magnitude of that correction takes us to 123-124 if we do it again.
- SUMMARY: still believe a major top is at hand//breaking a swing low will confirm//bounce occurring now is expected
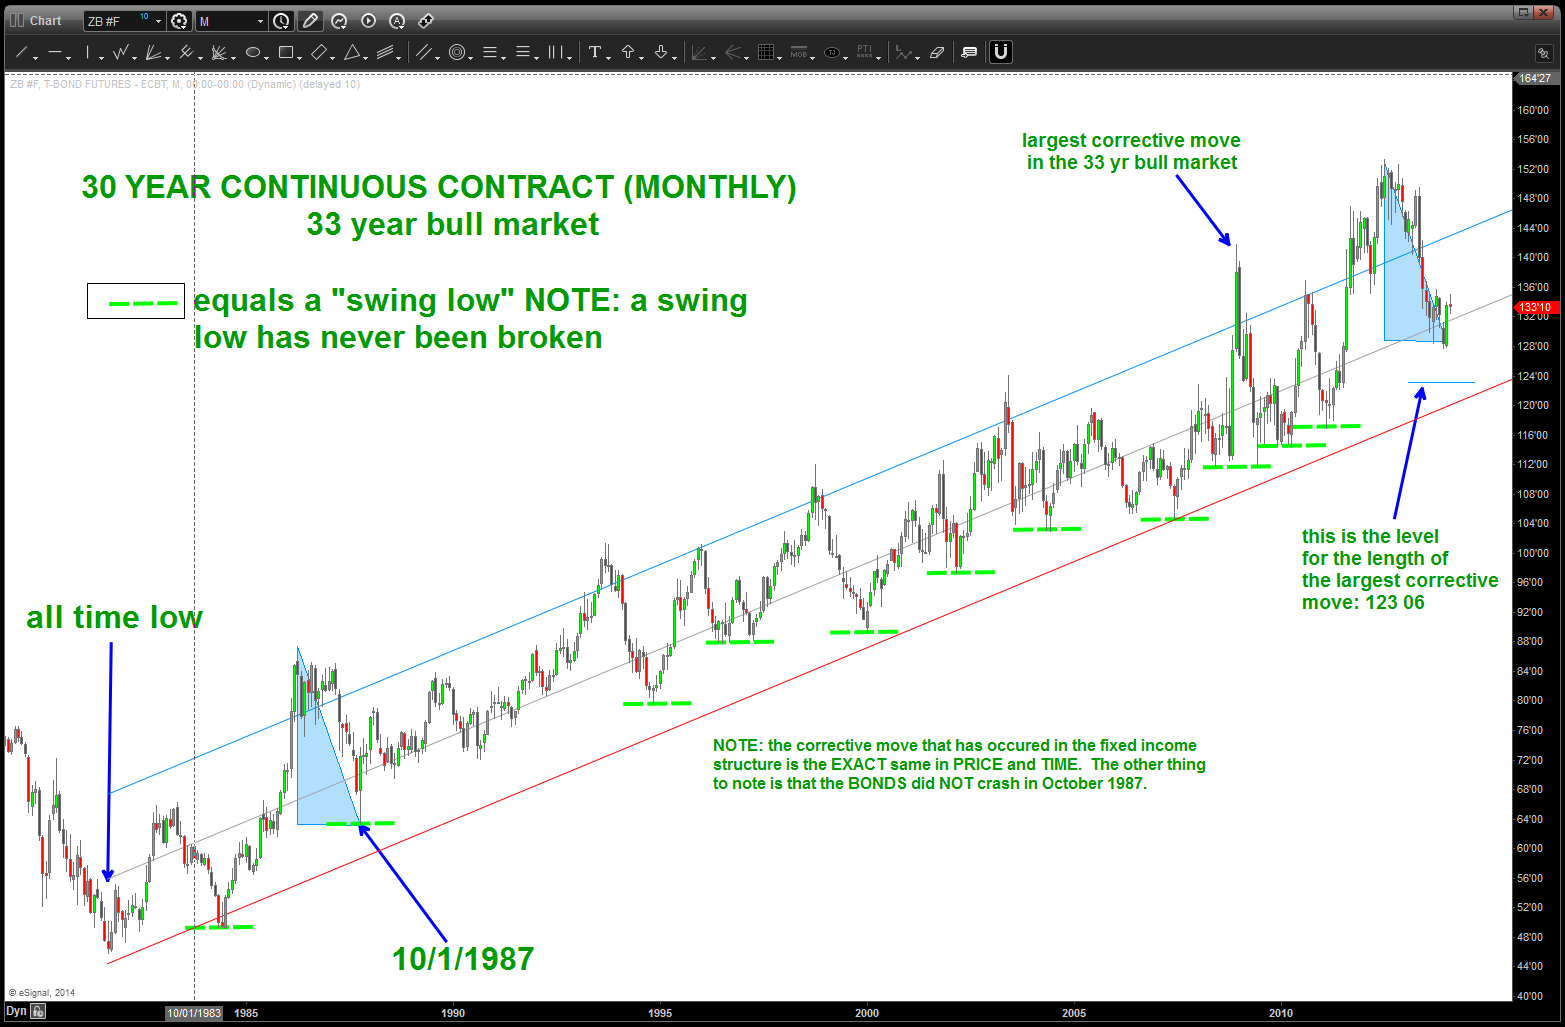
30 year bond continuous contract
next chart is the 10 year treasury yield monthly chart from 1995-2014. Data is not as good as the long bond, but we also have some very interesting developments.
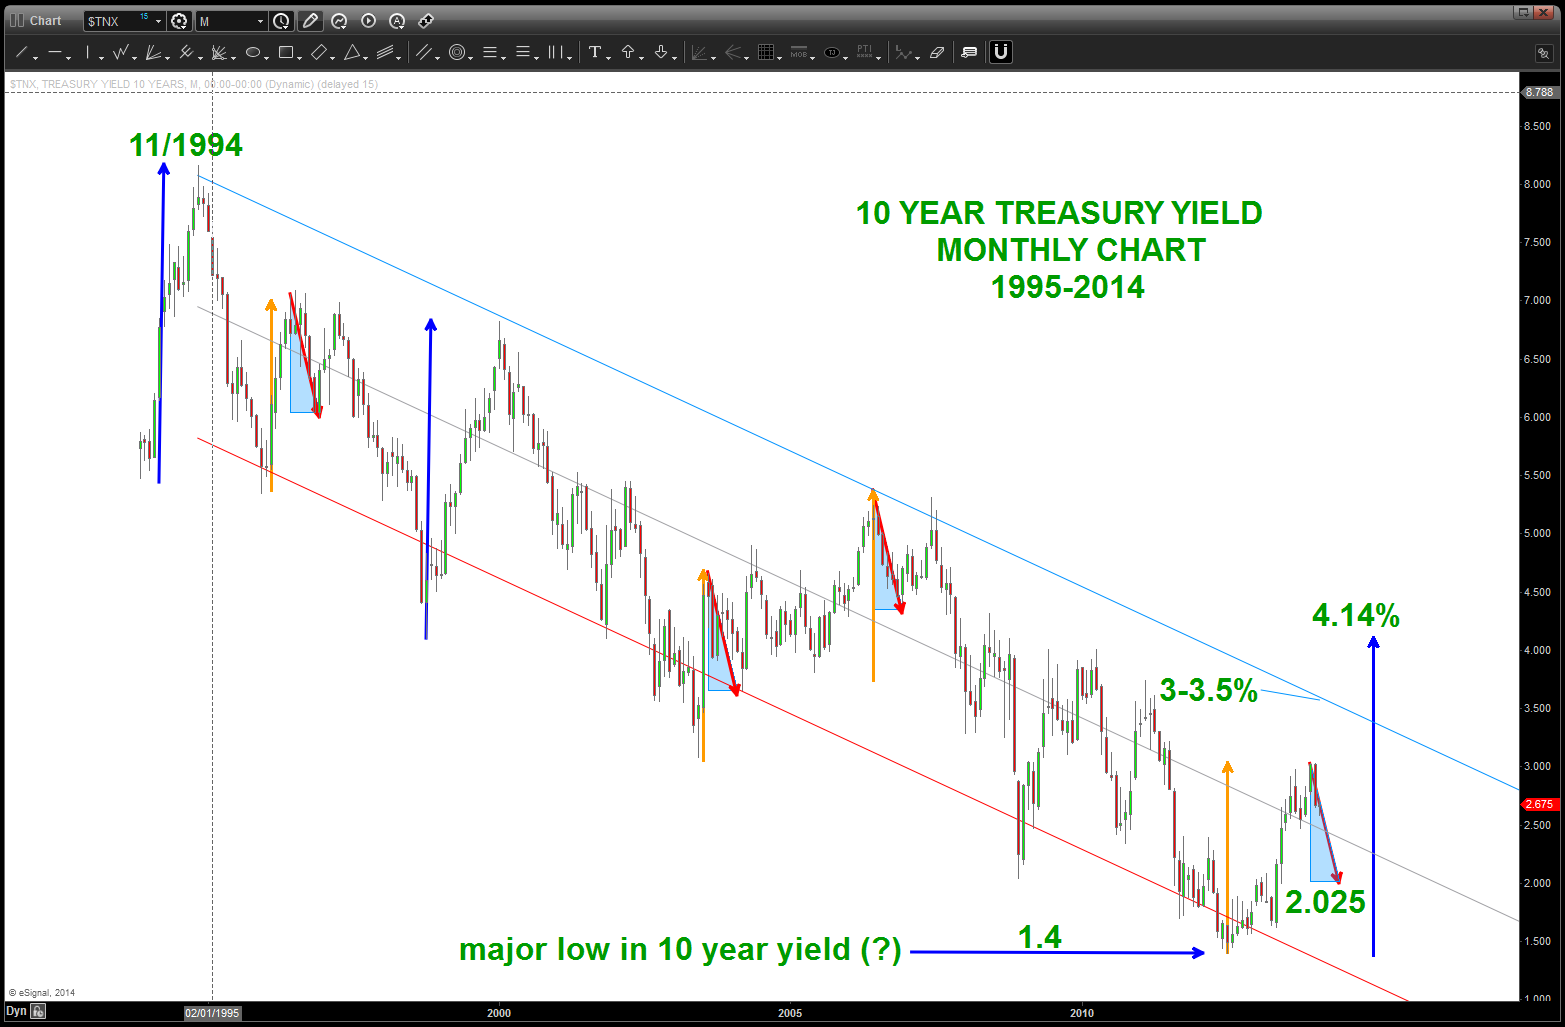
10 year yield
- note the UP orange arrow w/ the DOWN red arrow and how these arrows are overlaid by a blue triangle. the 5 wave sequence UP from the low at 1.4 is equal to the orange arrow UP so the PATTERN is the same so a correction down to the red arrow level would be an opportune time to BUY rates.
- the blue arrows show the largest move up by the interest rate structure shown …to complete that same move again will take rates to 4.14% and out of the channel which is defined by resistance in/around 3-3.5%.
- SUMMARY: believe a major low was made, we have just finished wave 1 of 5 and currently working thru a 3 wave corrective sequence. Would be looking to BUY after the corrective pattern is complete.
next chart is the Montly 30 day Federal Funds Futures … basically, this is what traders think w/ regard short term interest rates and the Fed’s policy from month/month.
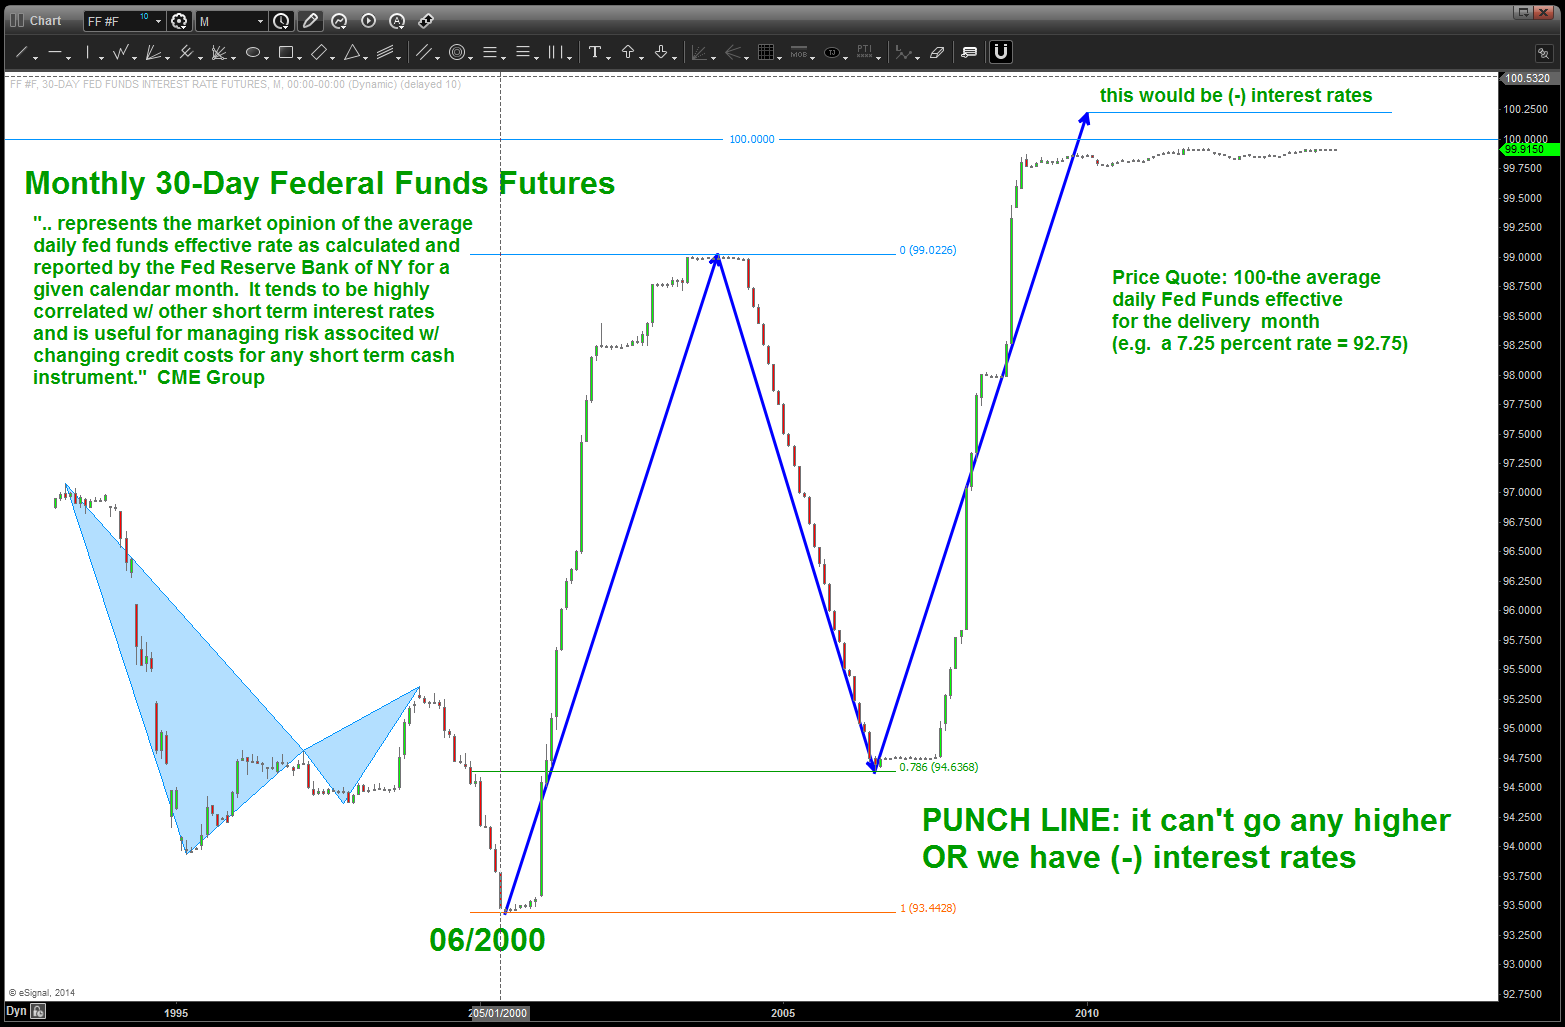
30 day fed fund futures
- NOTE: rates found resistance right at the .786 retracement. Again, the rates stopped going UP and found resistance at .786 retracement. did the fundamentals have anything to do w/ it or not?
- IF we continue the projection it goes above 100. That’s negative interest rates. Don’t think that will happen … (?) BUT for all intensive purposes, it can’t go any higher. It really hasn’t budged, which makes sense. So, if you don’t like playing the LONG side of RATES down here at these levels THEN monitor the Fed Funds for a breakdown. Believe it will be a big move to the downside, ultimately, but will be a nice confirmation of a generational low in interest rates has had it’s day and the “trade of our lifetime” to go LONG RATES is at hand.
make it a great weekend and watch the levels on the long bond AND the fact that the same PATTERN in PRICE and TIME has occurred, just like coming into a low in October of 1987.
Understanding Fractals and the Current Market Environment ..
Posted on February 6, 2014 Leave a Comment
I promise this isn’t going to be a mathematical treatise on the math/geometry behind fractals. We’re going to go down the rabbit hole, slightly, in order to 1) get an understanding of what a fractal is and then 2) relate the current market environment using the Down Jones Transports. We could use more, but that would 1) take too long and 2) I ask that you defy human nature and do the work to prove for yourself. I’m more than happy to answer any questions on a separate thread.
This is from http://mathworld.wolfram.com/Fractal.html : “A fractal is an object or quantity that displays self-similarity, in a somewhat technical sense, on all scales. (my bold) The object need not exhibit exactly the same structure at all scales, but the same “type” of structures must appear on all scales. ” For those not familiar w/ Elliott Wave Theory this is where the “form and proportion” comes into play ….

famous fractal picture ..note how from the LARGE to the SMALL the PATTERN repeats!
For the moment, direct your attention to the far right of the picture above. The large object is the beginning of the PATTERN and produces the form/geometry of all the fractals that will be “spun out” to the most infinitesimal scales. If you spend a modicum of time studying the picture you’ll see that the large “seed” pattern to the right is repeated over and over and over ….
Our thesis is, w/in the traded universe of securities, that PATTERNS do exist and they occur on different time frames and scales but, ultimately, these patterns do repeat. W/ an understanding of the mathematical and geometrical properties present, an edge can be produced to put probability in our favor. Remember, an edge is simply a higher probability of something occurring than not occurring. The patterns DO NOT work every time, but over time they do produce and edge. If we can wrap them into the context of the circle of life (fixed income, equities (global and CONUS), FX, commodities) then we can potentially make accurate forecasts of inflection points.
Let’s go back to the picture above … the pattern had to start somewhere. As discussed, the pattern started to the far right. W/in the world of traded securities we use the IPO date or, say, an all time high or low to begin forming the pattern that all smaller fractals/patterns will respect. That is usually from a monthly chart or an .xls spreadsheet w/ the historical data from inception. The patterns that exist in the entire history of this data will, ultimately, make their way to the tick time frame.
So, w/ regard to say the Dow Jones Transports we know that the all time low was 45.59 on 10/29/1896. Additionally, there have been multiple posts over the past couple months looking for the 7580-7620 area to be a PATTERN COMPLETING. This pattern, for all intensive purposes, has completed. And, while it did not hit the pattern level exactly, it did come w/in .003% after 42,281 days. Perhaps slippage, perhaps my lines were too thick … w/ the 5% down day after the level was hit, I’ll say it’s close enough for government work. Here’s the latest post:
The PATTERN that completed was a basic measured move and using the seed of the pattern from the all time low we were then able to REPRODUCE that measured move and PROJECT where this measured move would complete a similar move and produce a PROBABLE area of major resistance. Thus far, the market respected this area.
What does this mean …? Well, again, in the context of the fractal pattern present it means we are correcting a pattern that took 42,281 days to complete. So, the probability of a “large” correction is favorable. HOWEVER, in the context of the history of the Dow Jones Transports this could be an amazing BUYING opportunity but not after a 40-60% percent correction. If we are a day trader or a daily swing trader then this seems catastrophic. However, if we keep in mind that a PATTERN has completed that is 114 years in the making THEN we realize in the history of the Dow Jones Transports a MONTHLY swing low has never been broken. Last thing … this PATTERN could fail to the upside and then, well, it’s off to the races. The power of the PATTERNS is we know, almost exactly, where the pattern completes.
So … PATTERNS exist, some BIG PATTERNS have completed across the circle of life and, not a bullish pattern is present. The probability is that the market will respect these LARGE PATTERNS and cause a correction that in the minds of the twitter/facebook/”have to have it now” world will seem crazy and chaotic. But, if you step back and take a moment to respect the historical context of this moment, you can 1) adjust your portfolio accordingly and 2) be calm and understand that after this correction an even bigger pattern is now being formed which might be and AMAZING BUYING opportunity …
That will be hard to do … when, this time, blood is truly in the streets. It’s all probability ….
Bart
Utilities as a safe play … not yet!
Posted on February 3, 2014 1 Comment
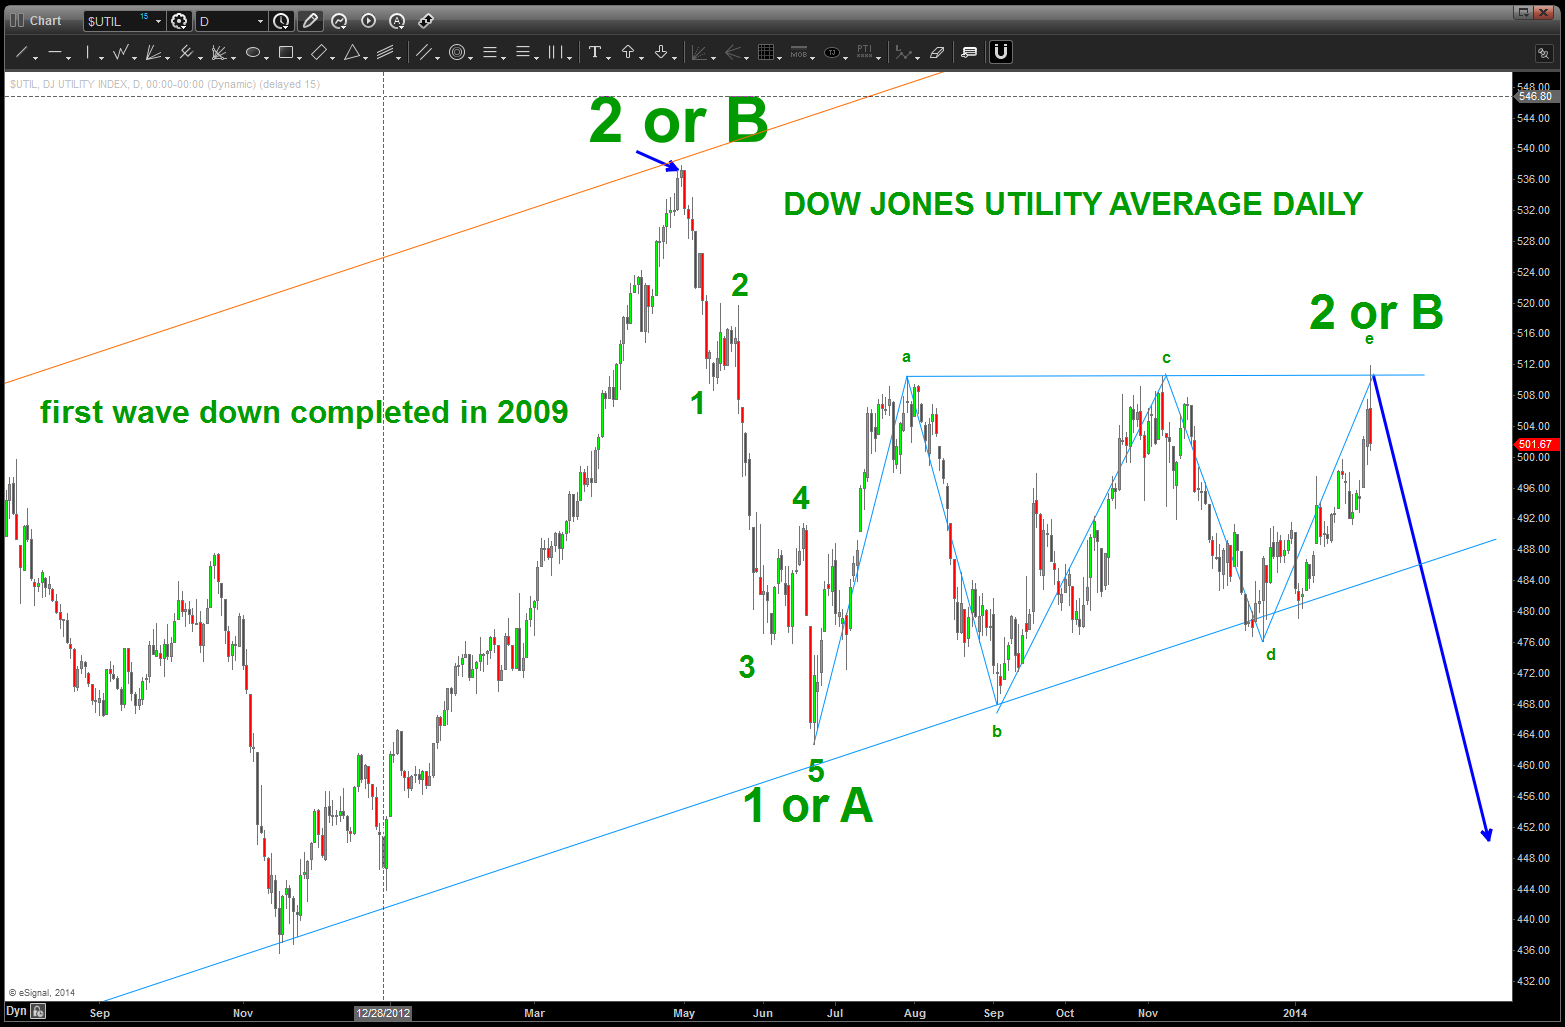
there has been speculation that Utilities are a safe play in a deflationary environment. I don’t know what the fundamentals say, but I do believe we are starting another wave down in the Utilities. After a very clear 5 waves down into the low of 2009, they have behaved much like everything and bounced rather nicely. One caveat … they didn’t make a new high as the rest of the indices were soaring. So, where do I “think” they are now …? If we neck down into a daily chart I am going to say the “bounce” from 2009 ended in April 2013 in/around 540. That’s either a BIG 2 or BIG B. Since then we carved a very “Ray Charles” count in 5 waves and just completed (today) the last leg of a triangle labeled a-b-c-d-e. If we take out the triple top at 512 then perhaps a little higher, a little change count and we can make it a-b-c. What am I trying to say … we have completed a CORRECTIVE PATTERN either HERE or a little higher and the utilities should start down in a potentially violent and large way.
the other thing I see is a FOLDBACK pattern that has folded back up the 2000-2002 meltdown. That puts us cresting at the top for another fall …patterns SUGGEST we foldback down to the left in a bear market for utilities.
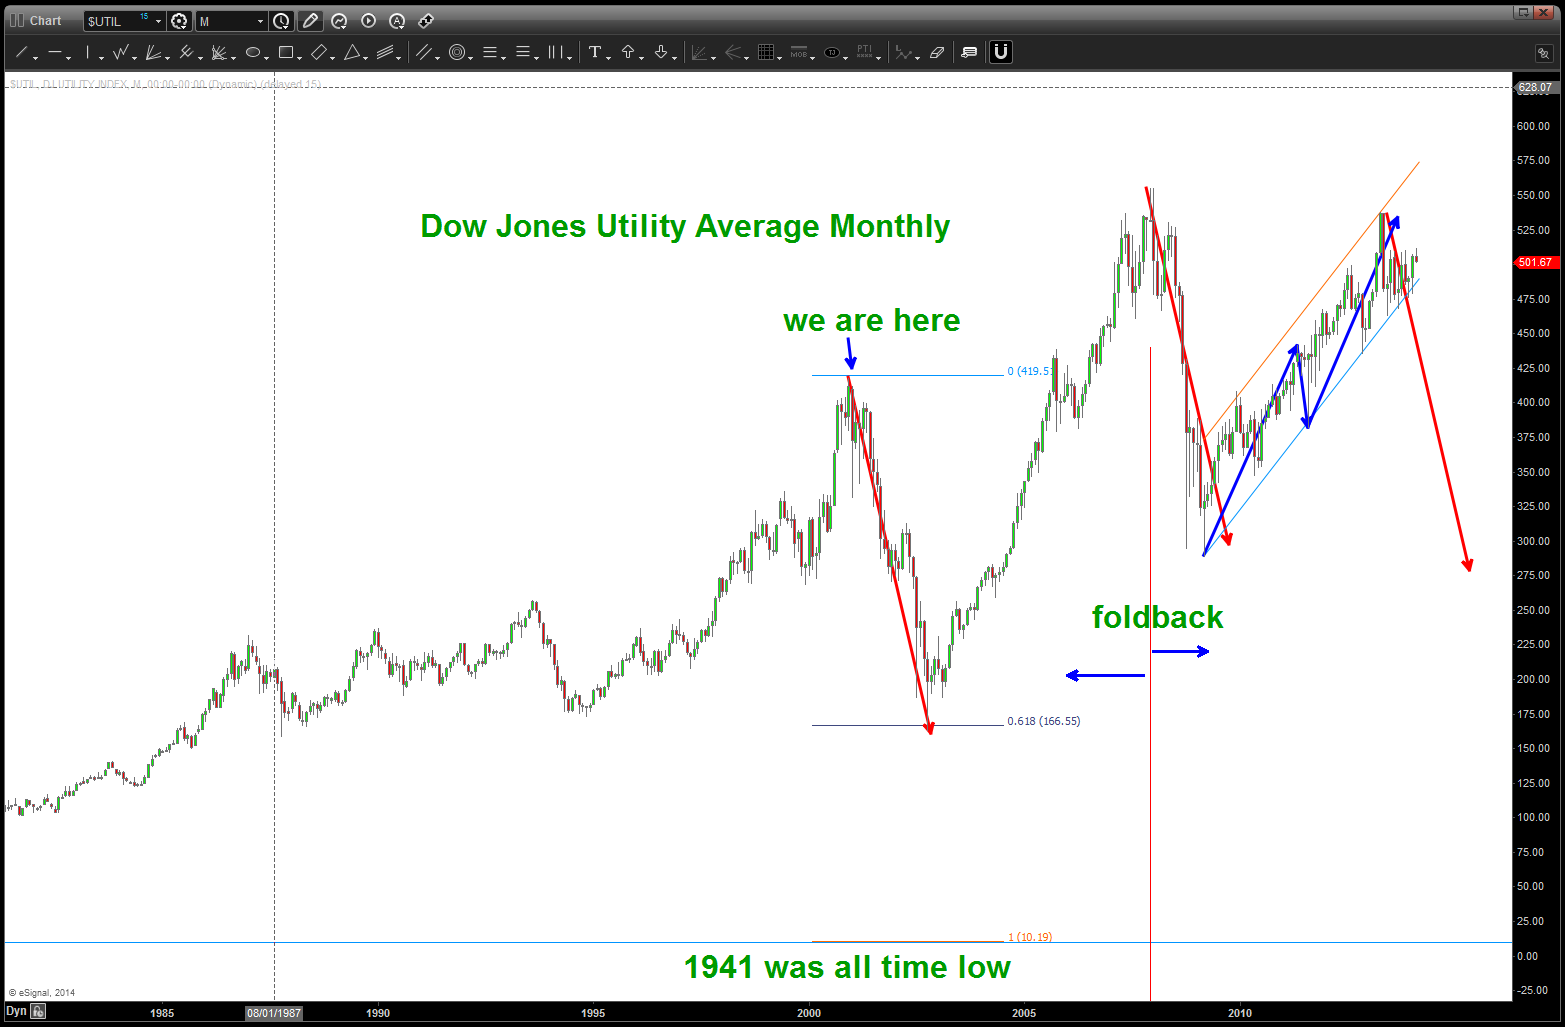
long term look at a potential foldback in the DJUA
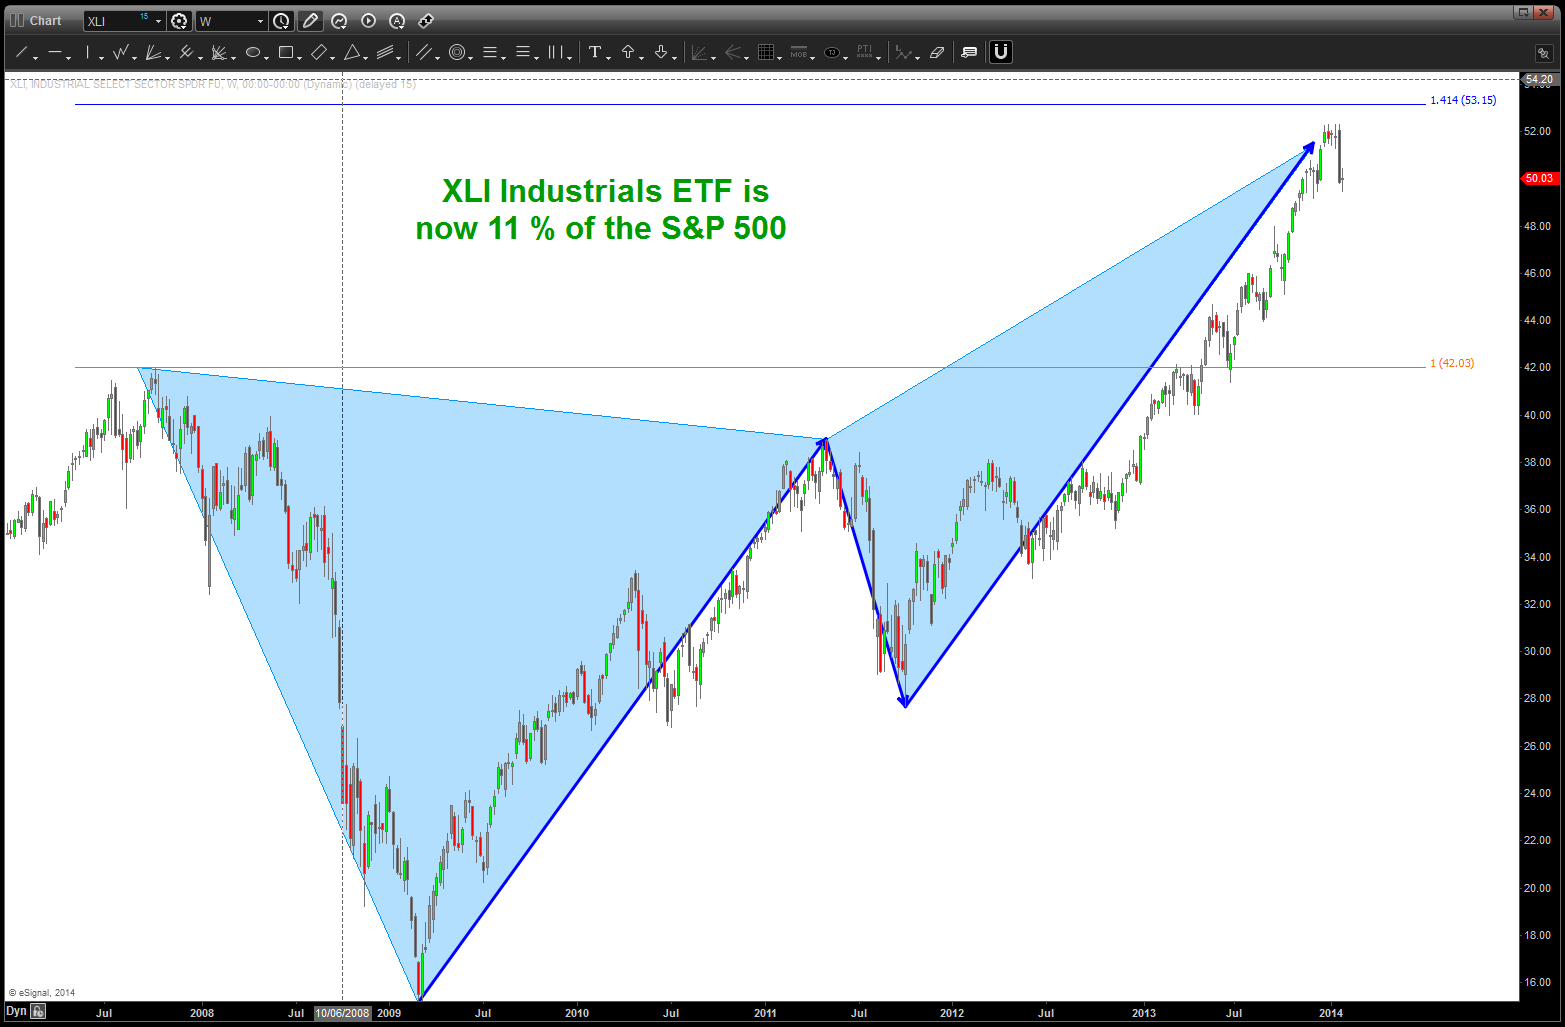
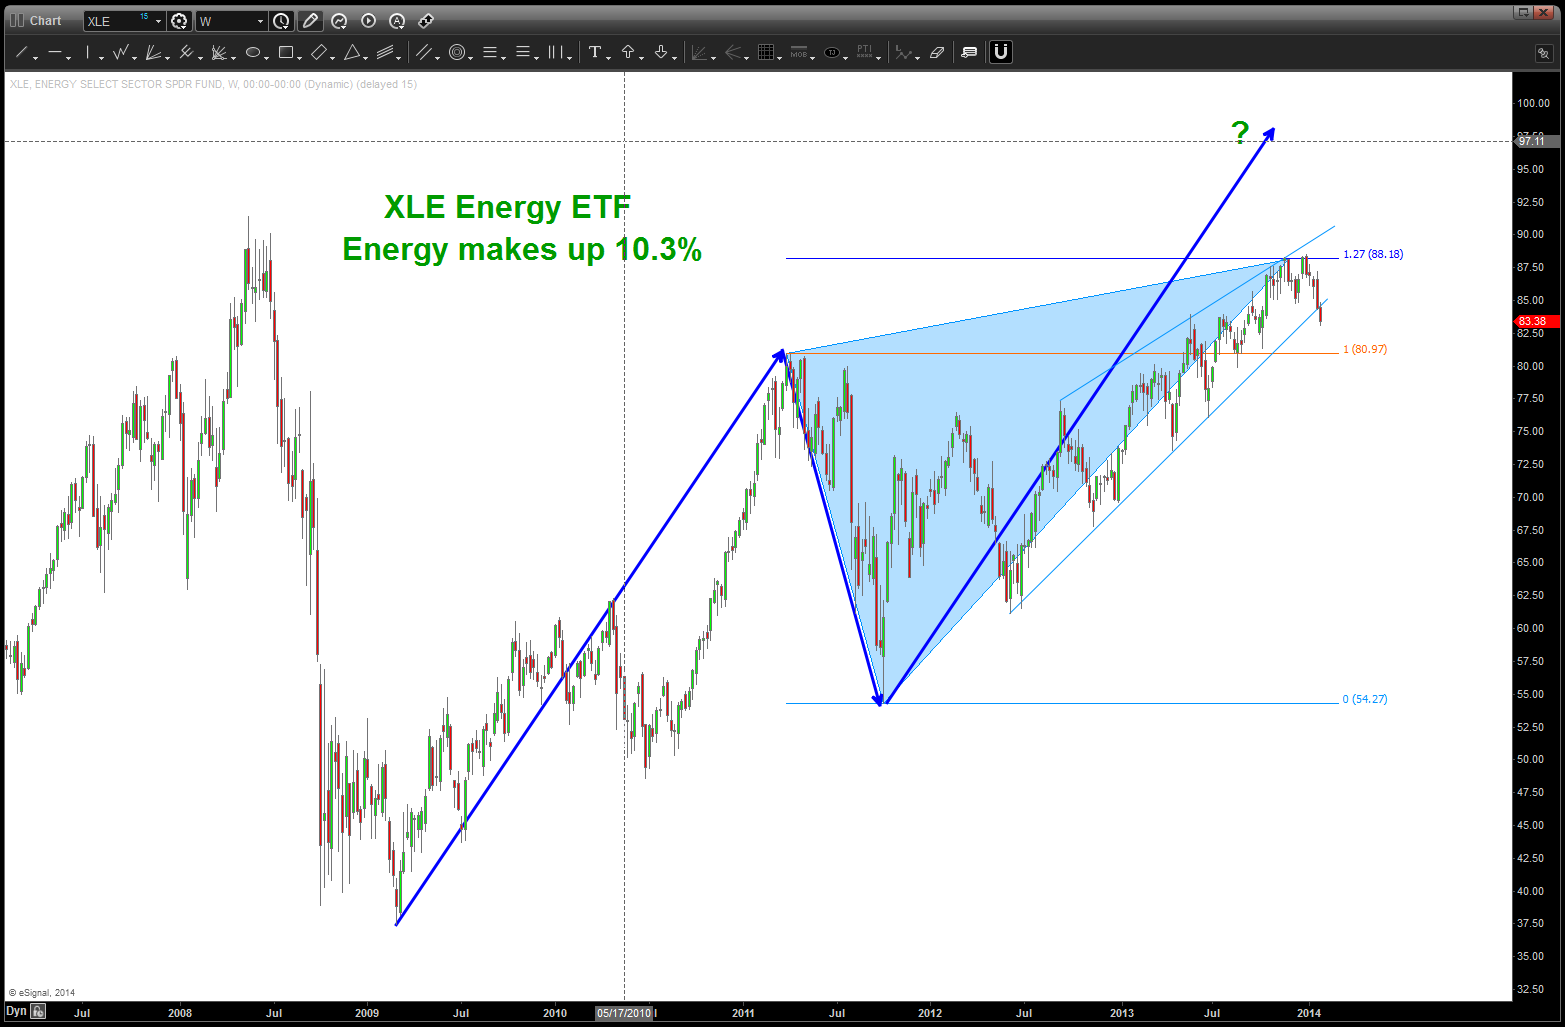
going thru the heavy weights that make up the S&P …
Posted on February 2, 2014 Leave a Comment
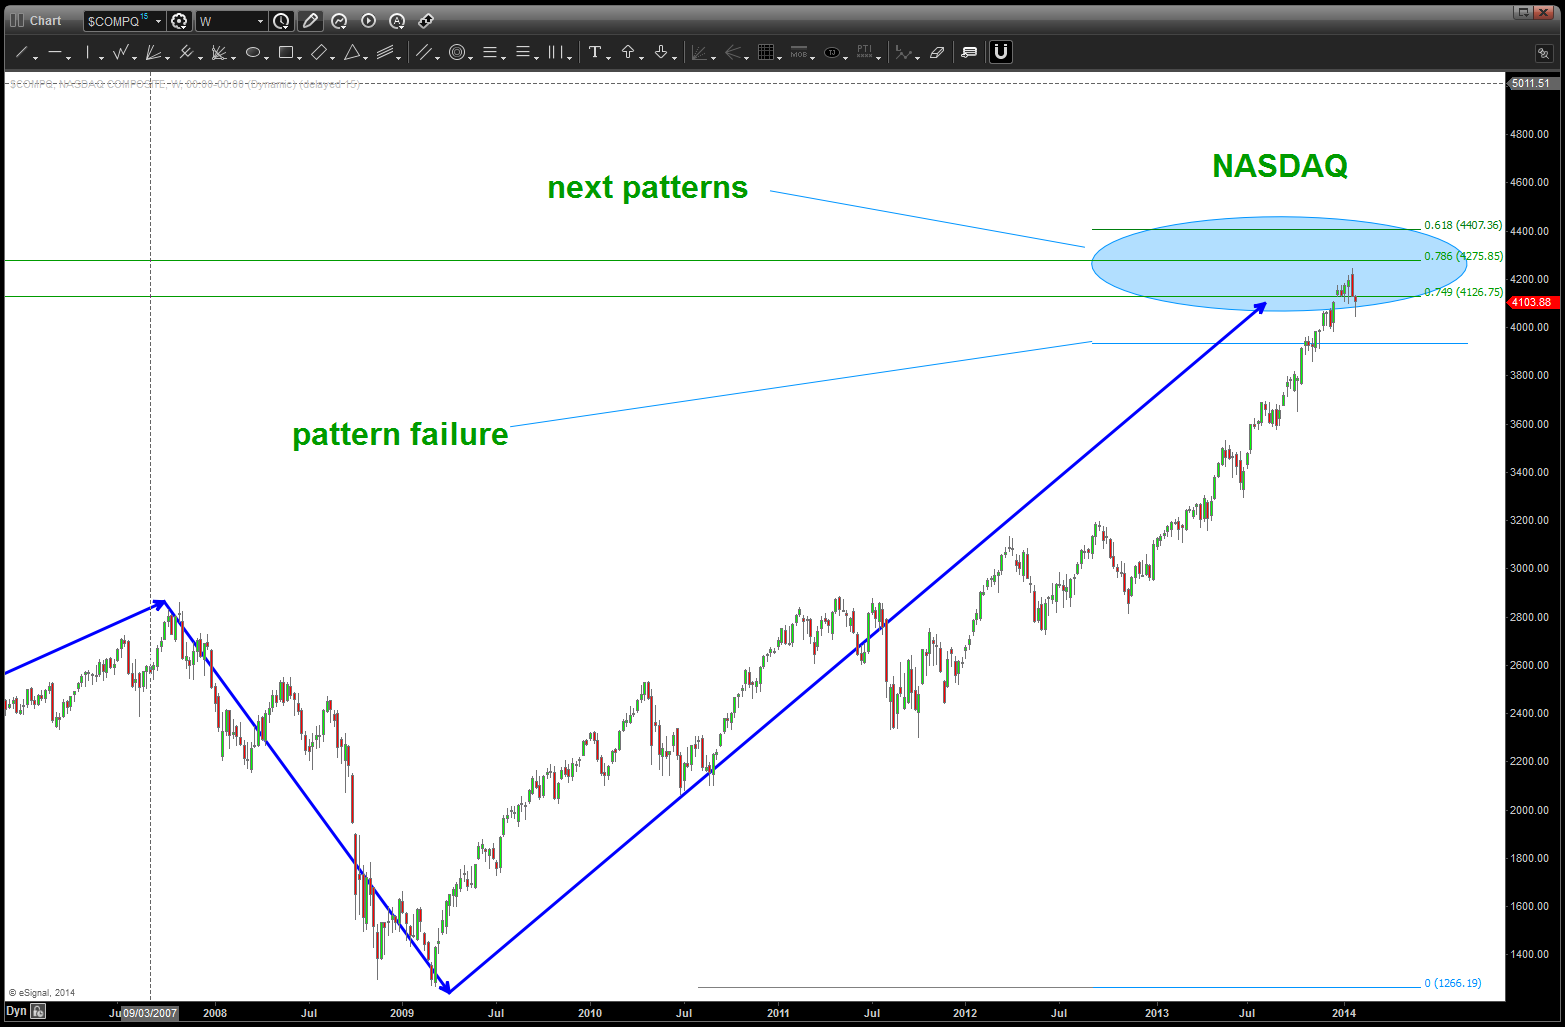
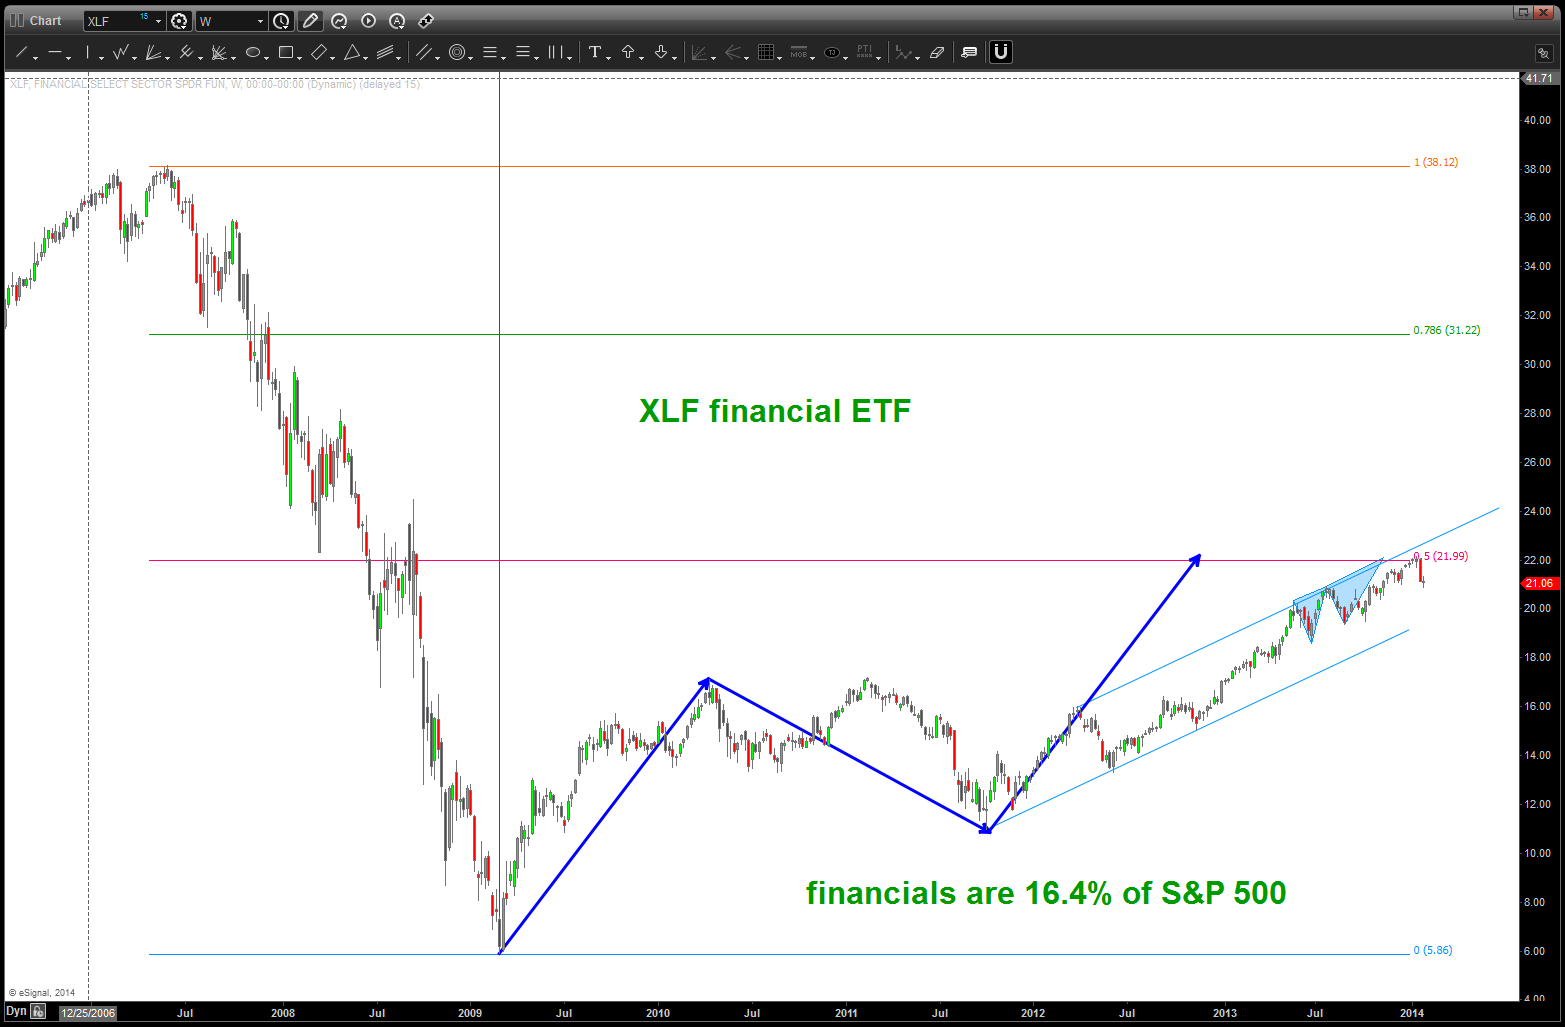
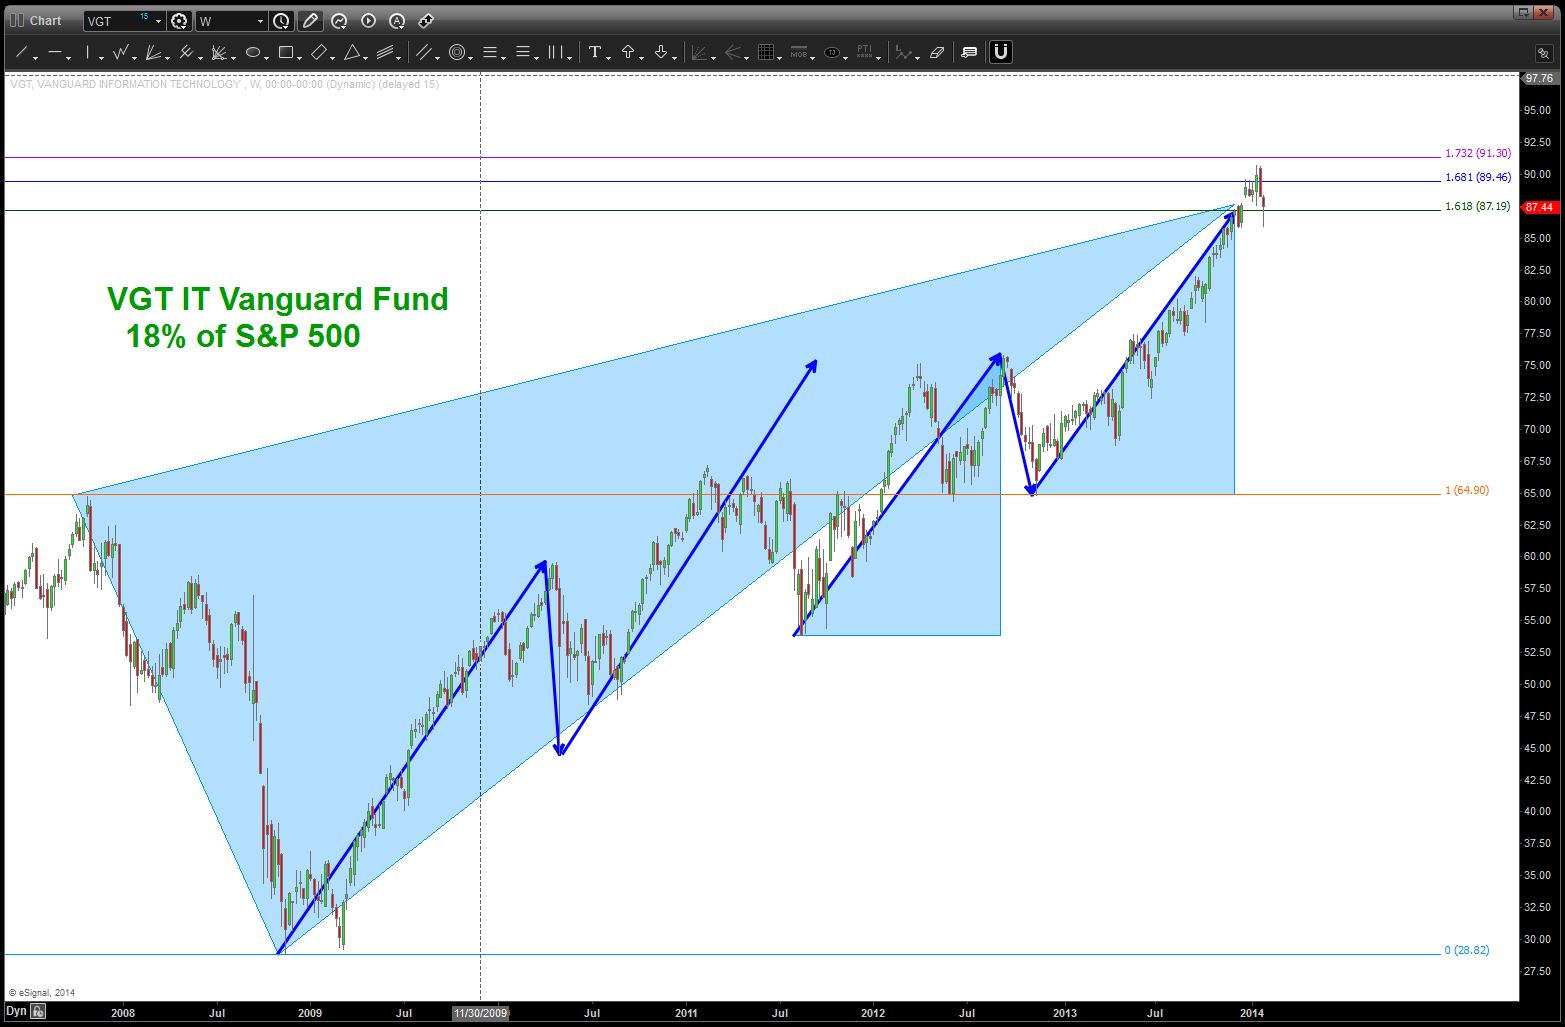
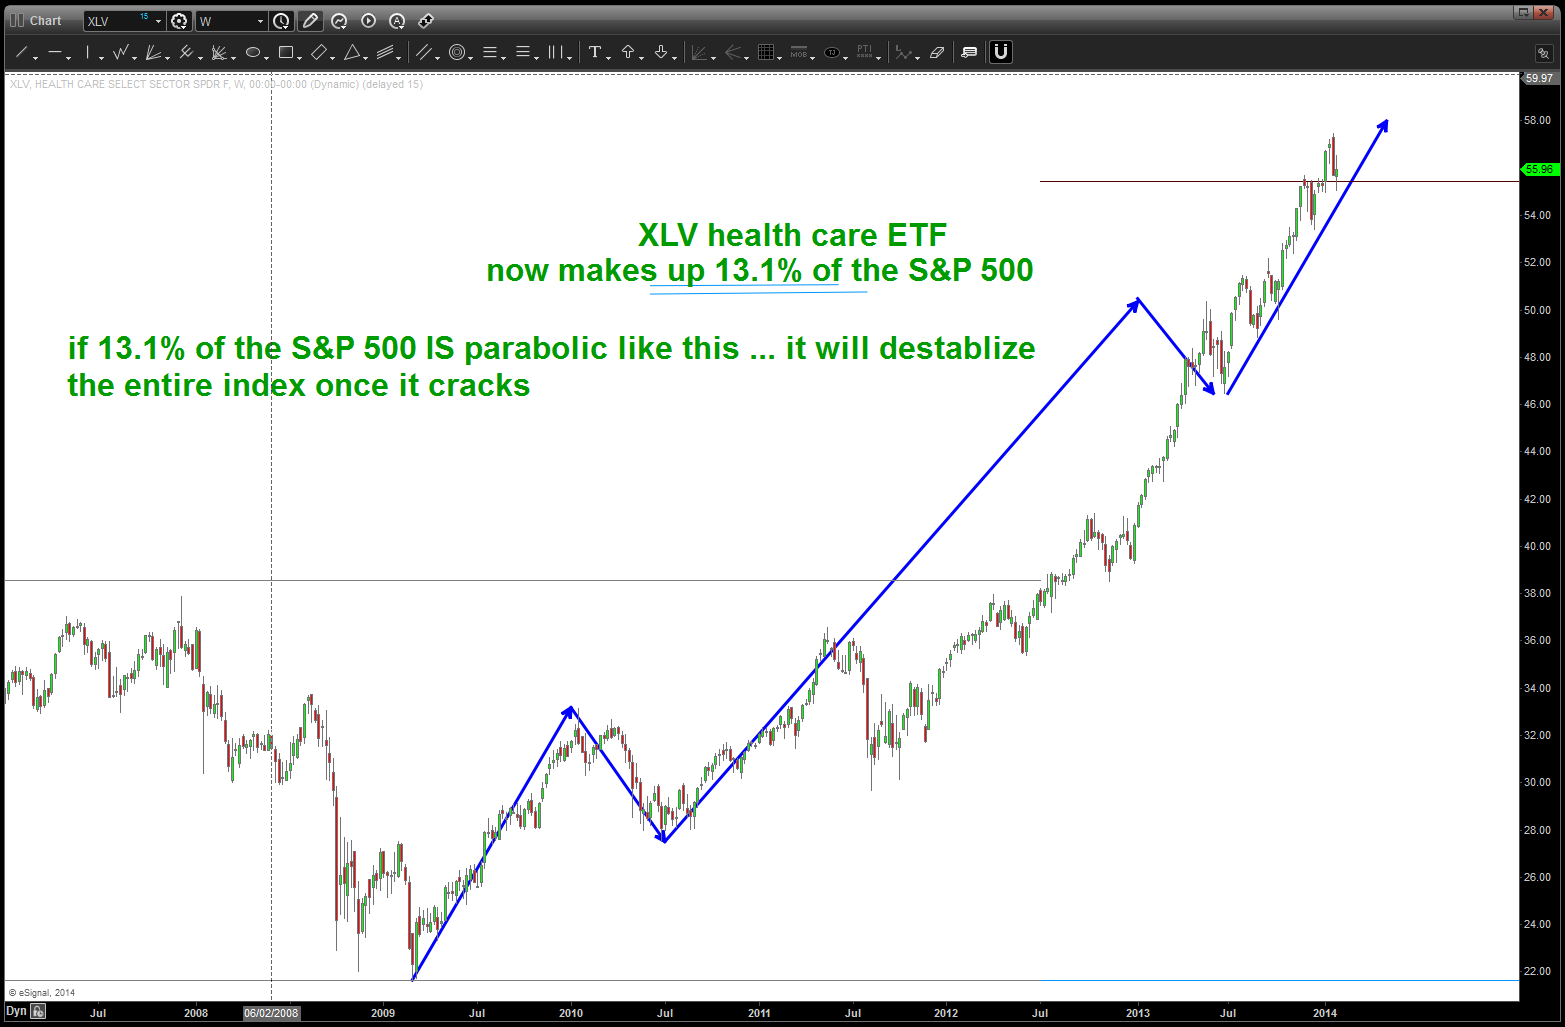
in Mid-December 2013 we went thru the top weighted (by percentage) sectors in the S&P after the most re-weighting … at the time, most of them were either finishing or approaching or hitting sell patterns. As of this writing, the patterns have held w/ no significant failures or break-outs. this is bearish … only time will tell if we have entered a CONTINUATION of the bear market that began in 2000. here is the link to the post mentioned at the beginning of this diatribe:
updated charts showing where we are w/ regard to the patterns: