important ratios – revisited
For those who have been following me since I started this summer, you’ll find I spend considerable amount of time analyzing the RELATIVE STRENGTH of the STAPLES vs the S&P. Why? The theory is that, in times of volatility and/or bearishness the “big guys” (read: institutions) will rotate into a defensive posture such as staples. We need “staples” to live … water bottles, food stuffs, toilet paper, toothpaste, etc. This does not mean that they won’t go down it simply means they are stronger from a relative strength basis. If the ratios is GOING UP then volatility and bearishness is taking place … if the ratio is going DOWN then “good times” are here and, generally speaking, it’s BULLISH. Where I take it to another level is in the pattern recognition … by using advanced pattern recognition techniques across the entire circle of life I try to develop a thesis and then deploy capital in the most risk adjusted manner …
here’s a list of some of the staples work:
https://bartscharts.com//?s=staples
- the week of October 07, 2013 we have an AMAZING BUY of the ratio that was precise in both PRICE and TIME. It hit, the market sold off but it was subsequently taken out and the PATTERN FAILED. End result: BULLISH for the stock market.
- it was also noted, that the .02 level was a potential target. at the beginning of the new year this target was hit and, while it held intraday it has been subsequently been defeated. In my mind, I try to stay away from intraday spike highs or spike lows …however, if we get a weekly close below a pattern level THEN, probability says it’s a failed pattern. Take a look at the below chart … we have a weekly close below. End result: BULLISH for the stock market.
- so … while we aren’t too far below the level depicted (1.27 and .786 overlap – usually strong support) I can tell you we need to get back up above and close above on a daily basis that level OR this S&P move could continue.
- also, I put my trust weekly 14 period RSI in to check out the “zones” for it’s support or resistance … I went back as far as my data would allow and I can tell you that 1) we have bullish divergence on the DAILY chart and on the weekly this is the lowest the RSI has ever been.
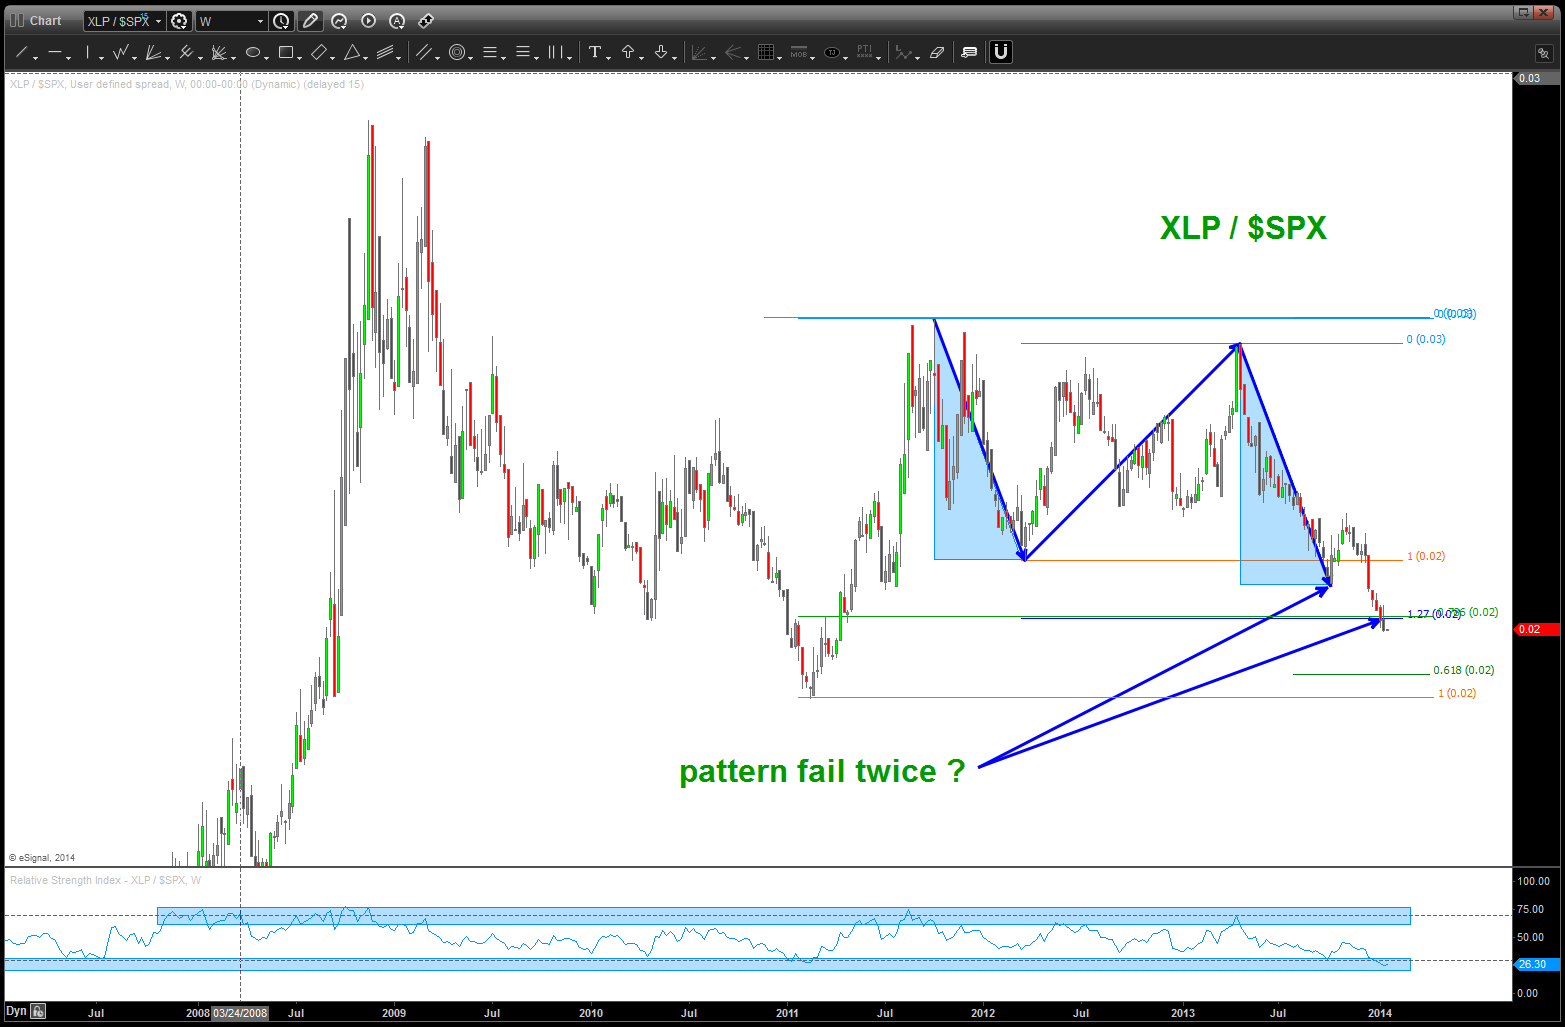
note, do we have two patterns failing on the important XLP/SPX ratio?
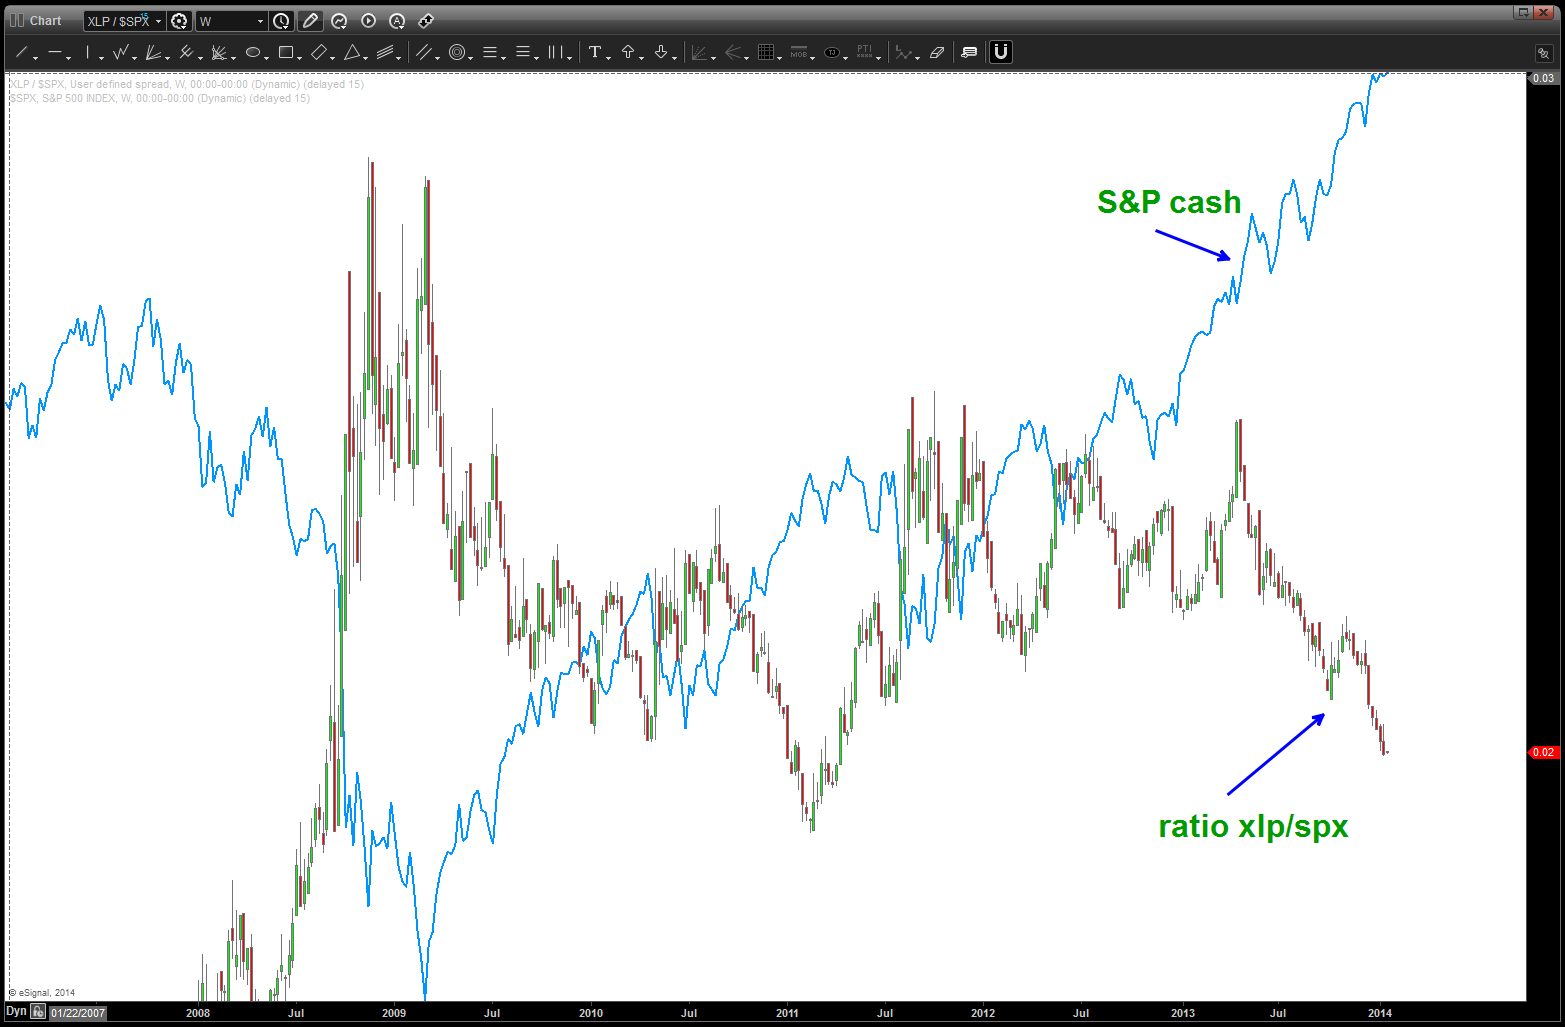
note at major turns, the ratio gives a good idea of inflections … it needs to turn up (xlp/spx) for the bearish case
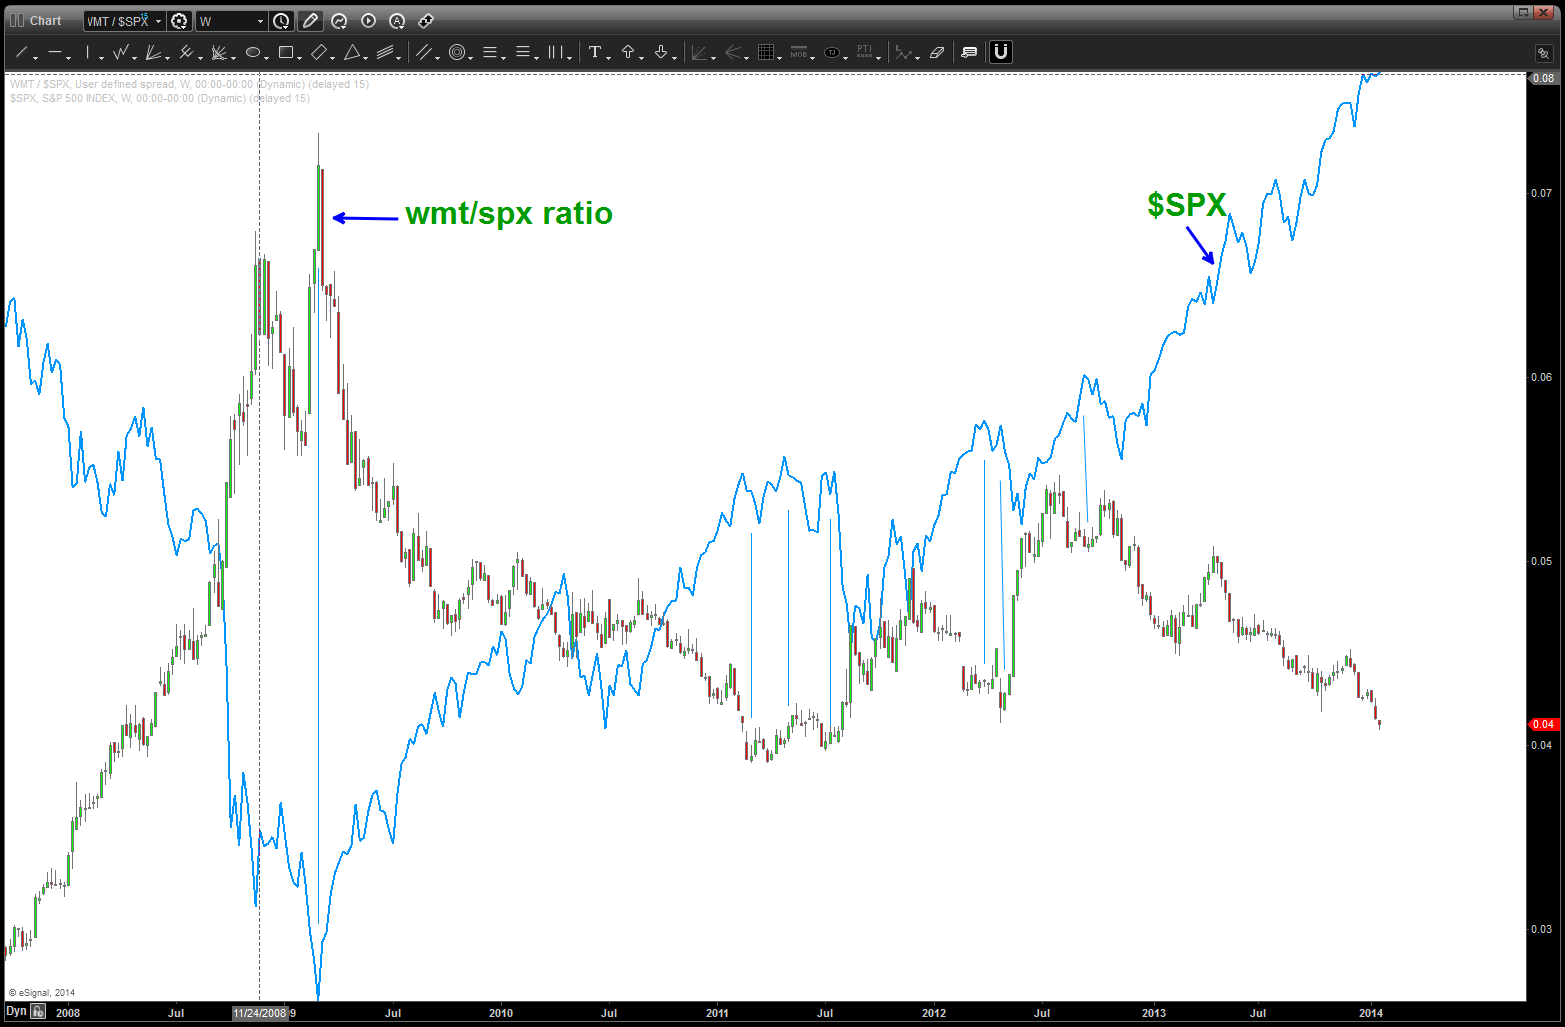
the other ratio we have looked at is the Walmart Greeter ratio … same thought process, except this is a single stock. The “whole world” loves WMT so if the volatility comes back, THEN, the “big boys” will rotate to that defensive hallmark of Walmartians. Guess what, it completed it’s pattern TODAY and, should go any lower …if the bear case is to be credible w/ our ratio’s. Here’s the last post on the Walmartians:
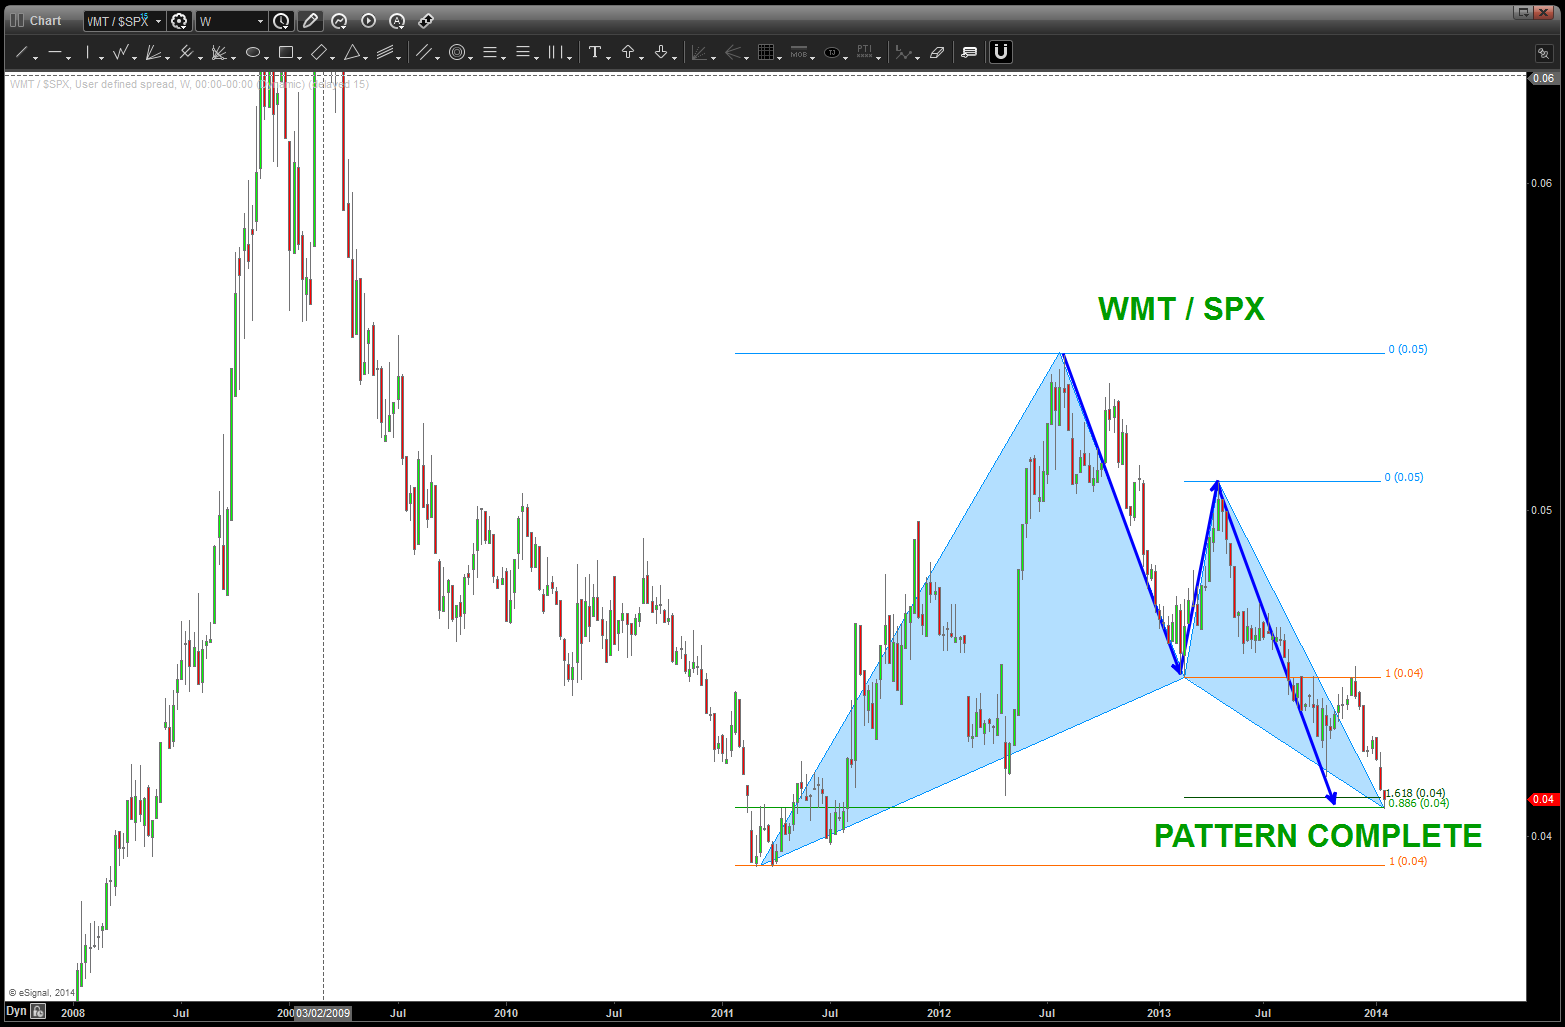
Walmartians relative strength vs the SPX
pattern complete
PUNCH LINE: these patterns are complete. for the bears to have a chance, they SHOULD NOT fail …..
