the WMT greeter and inflection points
ratio analysis compares the relative strength of one security versus another. if the numerator is stronger then the ratio will go up and vice versa. what I try to look for are meaningful ratio’s that plot fear and greed and can warn us of potential inflection points in the market.
I am going to make an assumption that “everyone” loves Walmart ($WMT) and it’s place as a fabled American institution is a fact. Our thesis today is during BULL markets it will “not be as strong” as the overall market (the ratio of WMT/SPX will go DOWN) and during times of fear or volatility it will “be stronger” than the overall market (the ratio of WMT/SPX will go UP).
the chart below does a pretty good job of showing this assumption is valid.
the blue line is the SPX. the candles are the ratio of WMT/SPX. the dashed purple vertical lines are placed on the chart to show the inflection points at tops and bottoms.
note, in 2000 (high), 2003 (low), 2007 (high), 2009 (low) the ratio has 1) moved w/ almost the same velocity and 2) inflected almost exactly inverse as the S&P. HOWEVER from 04/2011-08/2012 the ratio actually trended with the overall market. (this is denoted by the blue arrow going up during this time frame) then, the ratio “went back to normal” and started going back down and the market continued up. an interesting divergence,,,,
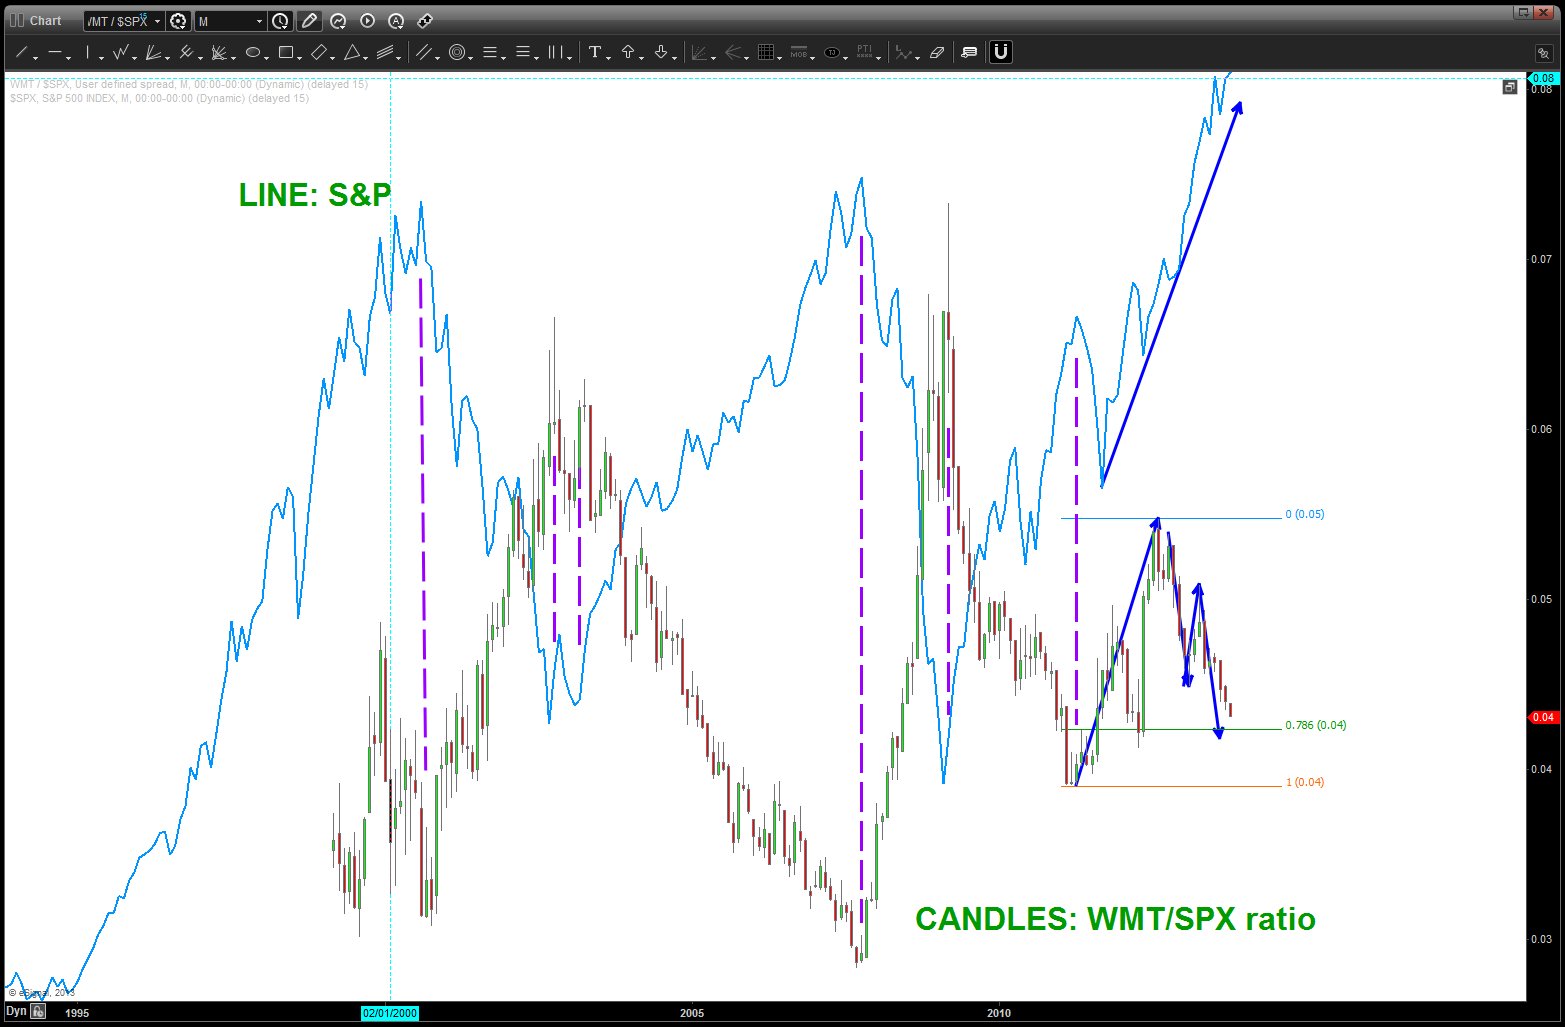
ratio of WMT/SPX compared to the SPX
the power of pattern recognition is it works on everything. so, we can look for patterns w/in this ratio to show potential inflections and then wrap it into an overall look at different sectors w/in the SPX to make a reasonable guess at moves to come. also, the longer the time frame of the chart, the more powerful the potential pattern becomes.
the chart below shows a clear 5 wave move ending and a pattern to be completing just a little lower. this signals that IF (the big IF) the pattern holds and the ratio finds support and begins to move UP then we “should” see a corresponding move down in the overall market.
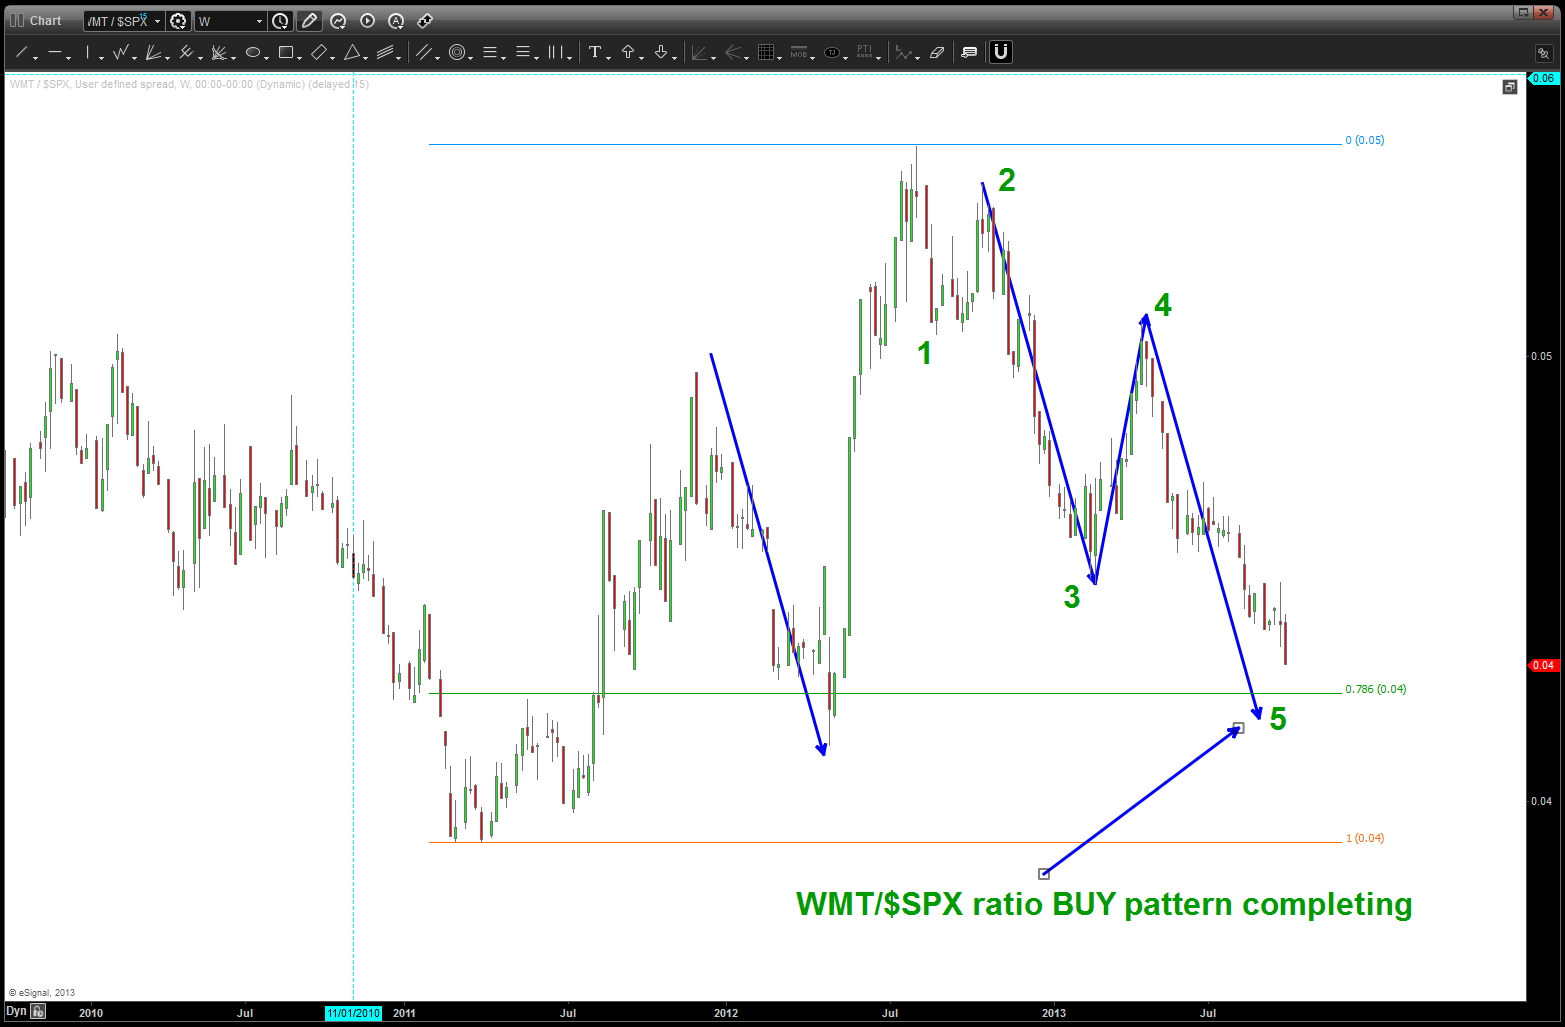
buy pattern coming into play a little lower
stay tuned and say hi to the next greeter you see and also tell them thanks for the market information!
Bart

Pingback: important ratios – revisited | Bart's Charts