look for a close in/around 4106 on NASDAQ tomorrow …equality of TIME and PRICE
Posted on January 5, 2014 1 Comment
IF, we can get a close tomorrow in/around 4106 on the NASDAQ THEN we have an equality “square out” of price and time … 4106 PRICE and 4106 calendar days is the “reason” we are banging around this area of the NAZZIE. the LOW TIME squares out the HIGH PRICE. Just keep an eye on it …also, some MAJOR resistance that is coming from the all time low in 1974.
REMEMBER – this doesn’t have to happen. It’s just another tool and something to be aware of … combined w/ multiple confirmations PRICE and TIME square outs can be pretty powerful. Let’s watch price action this week …

4106 PRICE and TIME
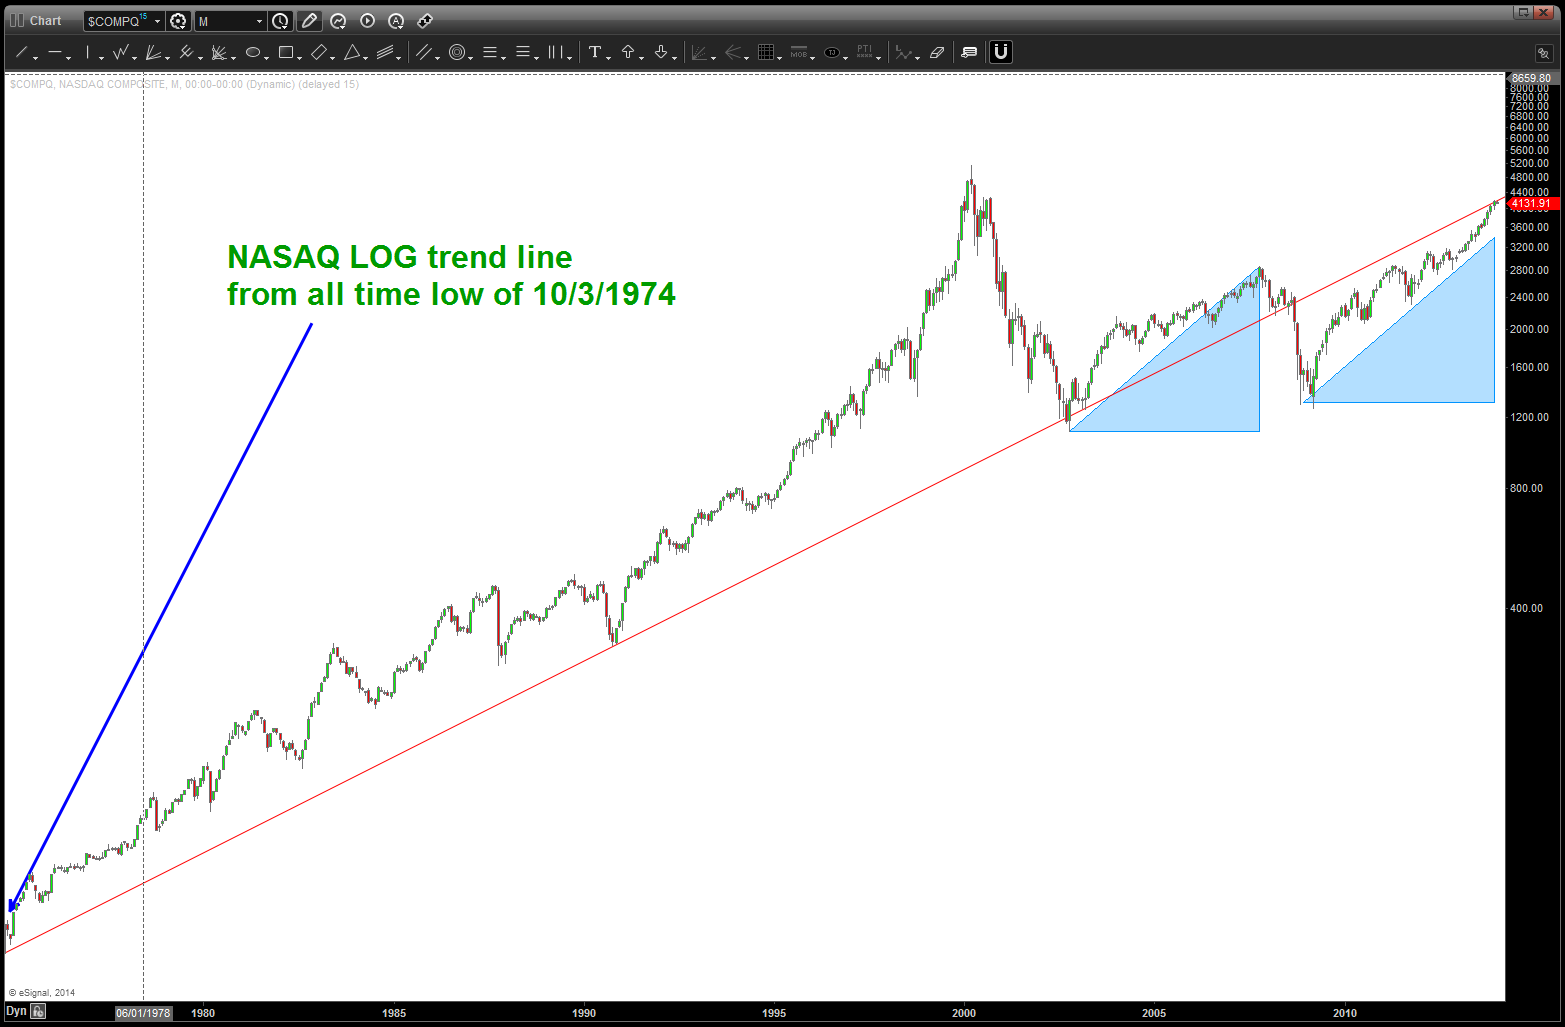
long tern LOG trendline
A revisit to GOOG …
Posted on January 5, 2014 Leave a Comment
if you go back some posts you will find a SHORT on GOOG was triend in/around the 922 area based on the classic AB=CD or thunderbolt pattern. It held from May to October and then EXPLODED higher … ouch on that one.
also, if you go back some posts you’ll find the 1080 ish level was next target zone … we went higher than that but now are at another key 1.732 extension (which is a big extension – square root of 3) and it appears to be holding. NOT SURE WHAT IS GOING TO HAPPEN but here are some thoughts:
- MONTHLY historical volume has FALLEN since the IPO. The volume at the bottom of the monthly doesn’t lie … it has steadily gone down.
- the count shown is actually a bullish count. the largest correction w/in GOOG could take it down to 625. it shouldn’t go any lower becasue (4) can’t go below (1)
- the GAP should be targeted initially and, being 75 points wide, should offer MAJOR SUPPORT but, if the old adage rings true, it should get filled, completely. we’ll see about that.
- my contention is if that gap gets closed and broken (they are called windows in the candlestick terminology) then a vacuum into the 600 level doesn’t seem that unlikely?
- a nice, clear wave structure looks like 5 up on the daily are complete.
- note the daily RSI … we do have bearish divergence but we also have the classic M formation and when that neckline of the M gives away, it usually spells a movement upcoming. conversely when we have a W bottom, it’s the breakaway to the top that takes out the neckline and it moves (explodes?) higher.
stay tuned…forecasting a move lower on GOOG (which could be rather sizeable) but ULTIMATELY one which should be bought to make a move UP and THREW these all time highs … could take a while.
questions to me.
B

GOOG MONTHLY w/ volume
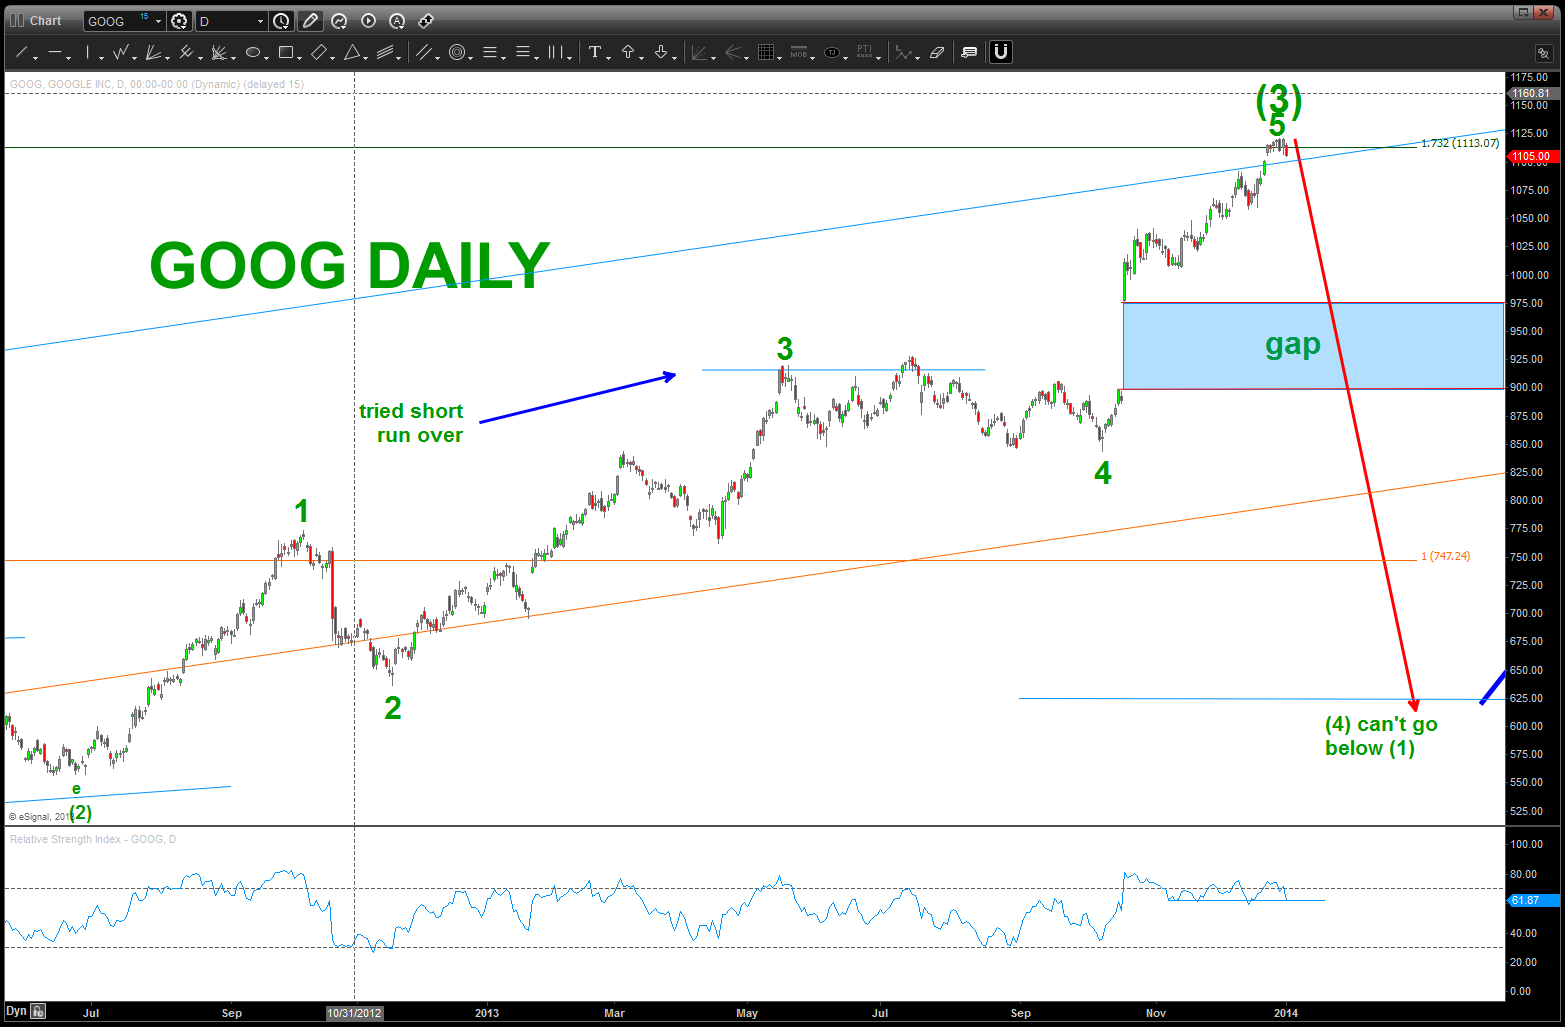
GOOG Daily w/ RSI
FXI … wonderful set-up coming. be patient ..
Posted on January 5, 2014 Leave a Comment
we have taken a look at the FXI and it’s set of “lower highs” since 2011. we have also taken a look at it’s relationship to Copper and how they have ebbed and flowed w/ synergy. what we haven’t done is step back and analyze the BULLISH case for the FXI. YES, I am posting something that could be a major BUY set up. However, it still needs to fall a good 50% in nominal terms. from 37 to 22.
why the bullish case? go back to the low in 2009? From 19 to 48 we can count 5 wave UP. In the context of wave counting that is either a wave 1 or an A wave that will form a 5-3-5 correction. labeled a-b-c. either way, we have a nice BUY in/around the 22-25 area that, if the count is correct, take out 48 and perhaps even higher.
so, stay tuned. w/ MAJOR long term patterns occurring w/ in the US and Global Equity market certainly appears a good thump could be coming but what an amazing set up to BUY…

FXI BULLISH opportunity
Social Media …
Posted on January 4, 2014 4 Comments
so, Social Media has changed the landscape of interaction on a personal, business, family, relationship and “you name it” level….frankly, I love it. that being said, it’s finishing a PATTERN and it’s time to step aside. Now, just because $SOCM has finished an 8/8 octave move and a 5 wave count doesn’t mean that it’s done for good. I just think it’s done for now …the 5 wave sequence might very well be 1 of 5 more to come. Just believe it’s RISKY to be getting in here/now. either way, here’s the patterns. Also,, note the volume increase at the end of the octave move and a “Ray Charles” count …
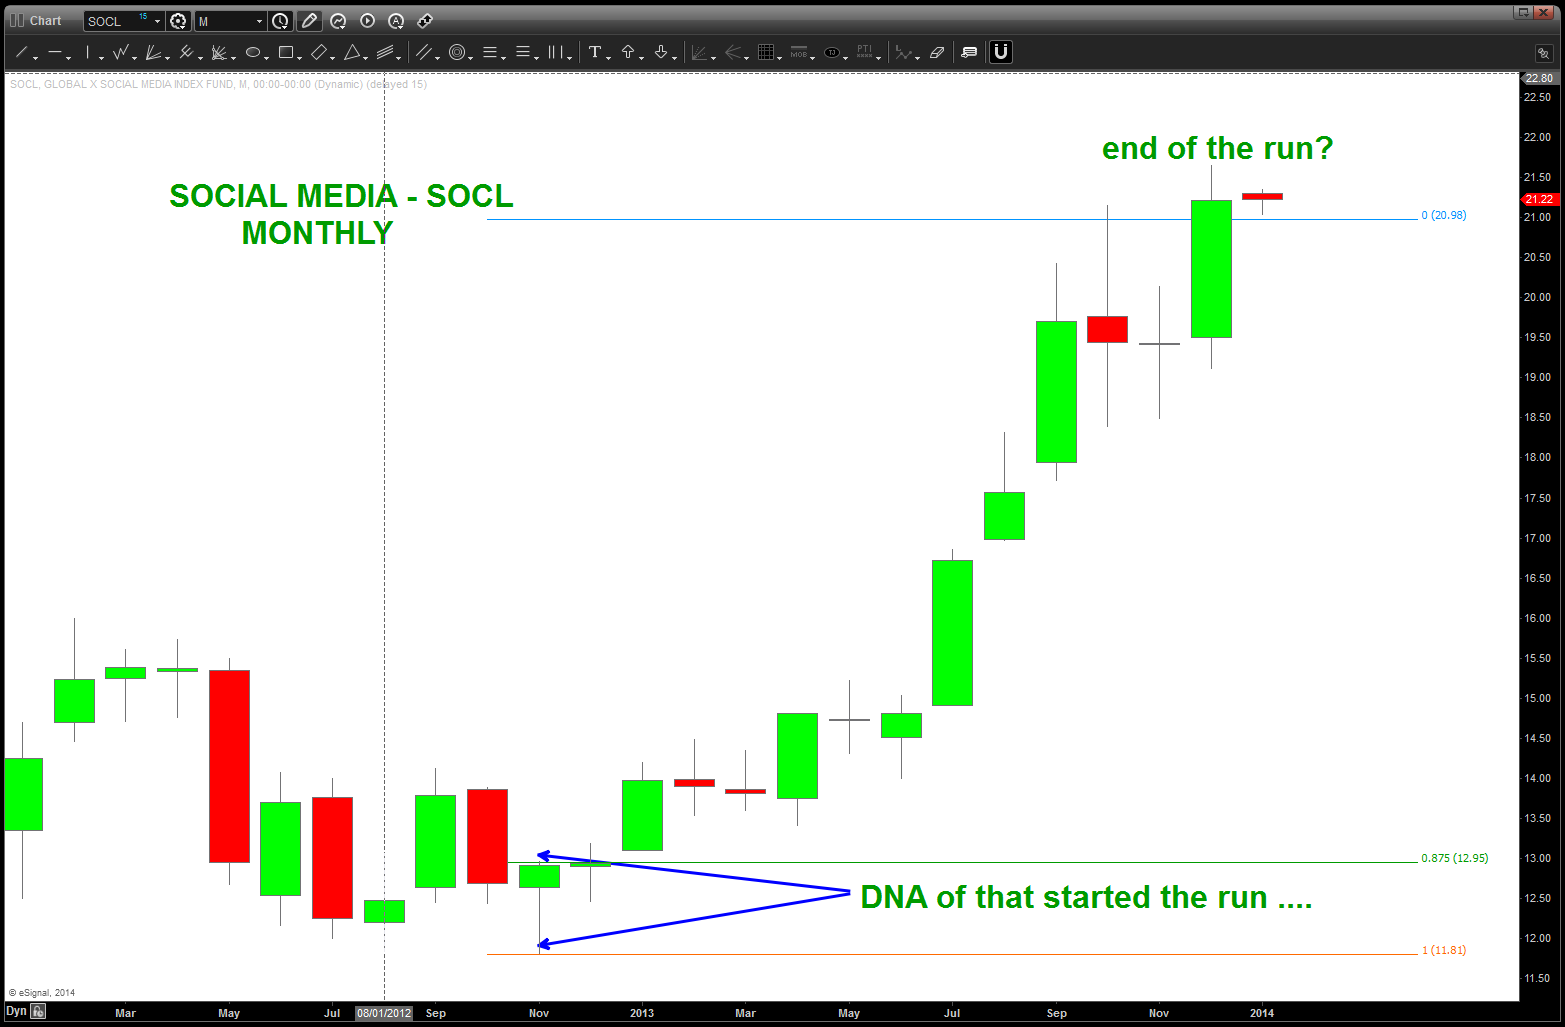
SOCL MONTHLY
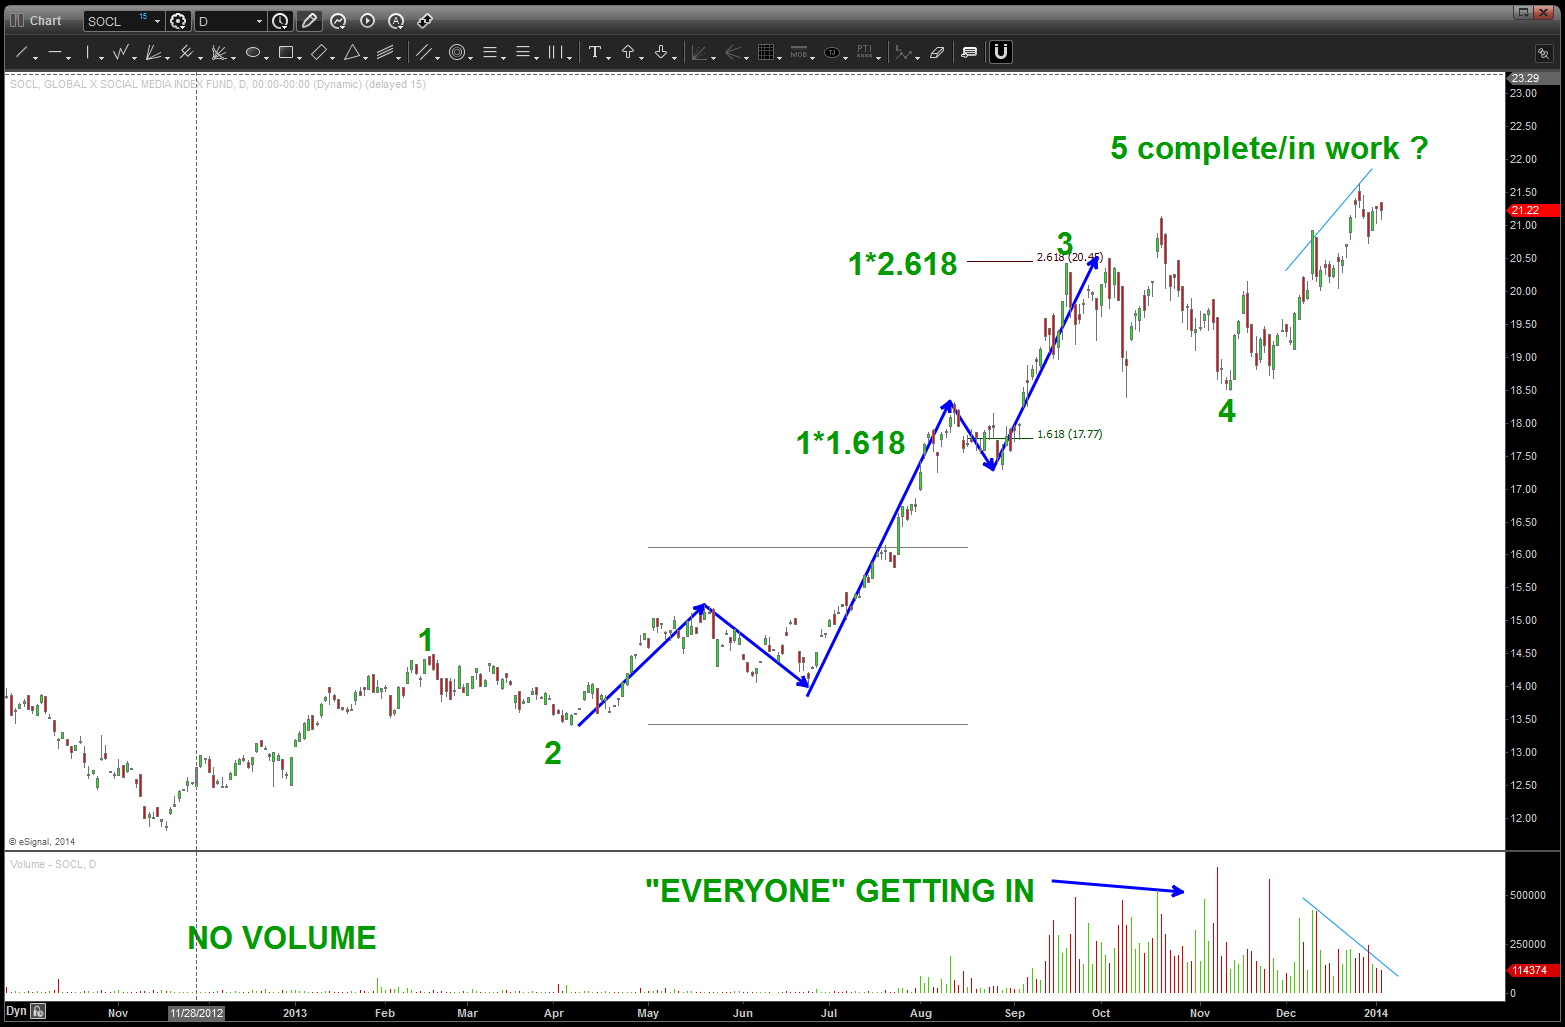
SOCL 5 wave count complete. NOTE volume
Thelma and Louis and Fixed Income
Posted on January 4, 2014 Leave a Comment
Interest Rates are approaching the CLIFF

Thelma and Louis made this choice …
here’s a post that can allow you to catch up the saga w/in the fixed income market … whats funny is we have been SPOT ON w/ the dollar, commodities and fixed income. the equities have just kept going UP UP UP. Note, the BULLISH optimism in the equity market is HIGHER than 1987. The thump is coming to the equity ecosystem. The PATTERNS are showing it …back to fixed income –
going back 1.5 years here was one of the charts from fixed income market AT THE TOP:
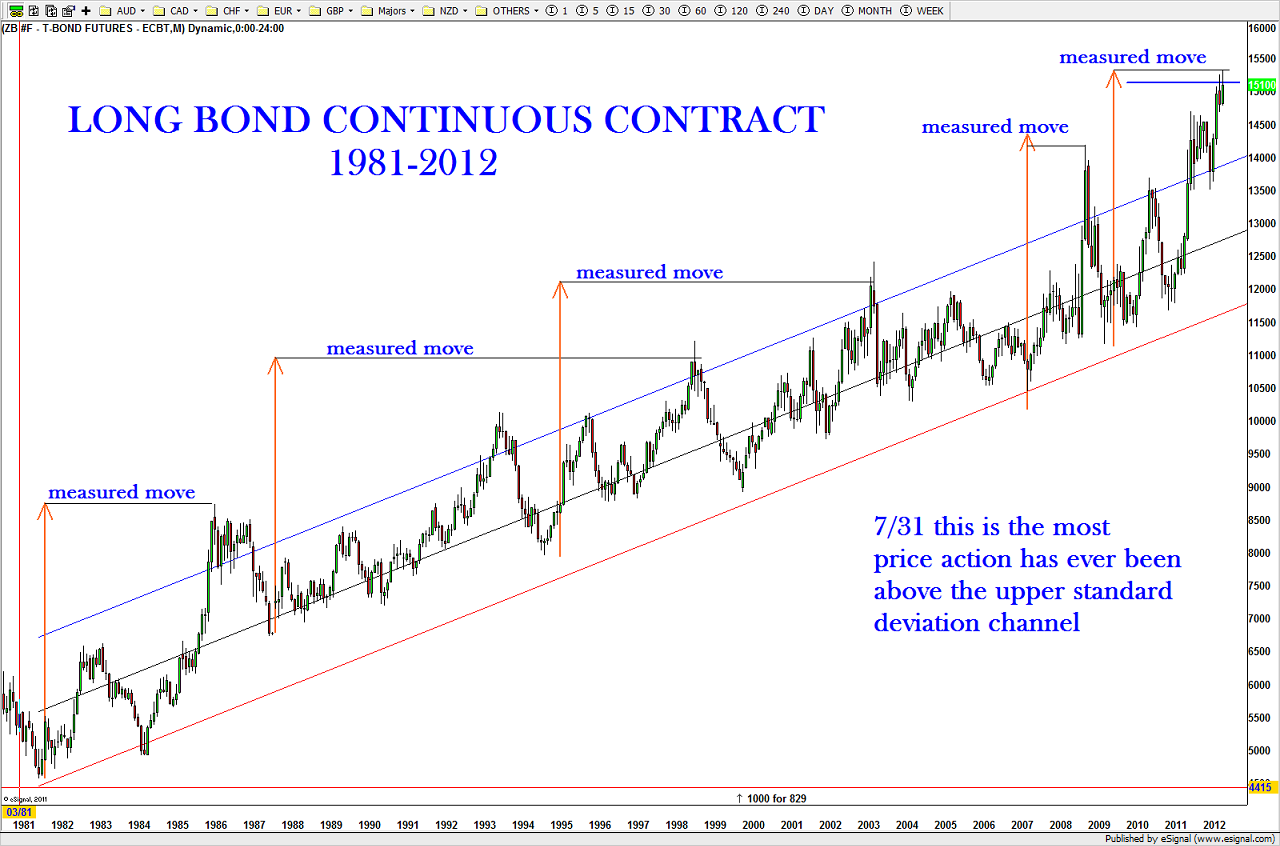
long bond at the top
here is the updated chart and, note, the cliff that the LONG BOND is sitting on …
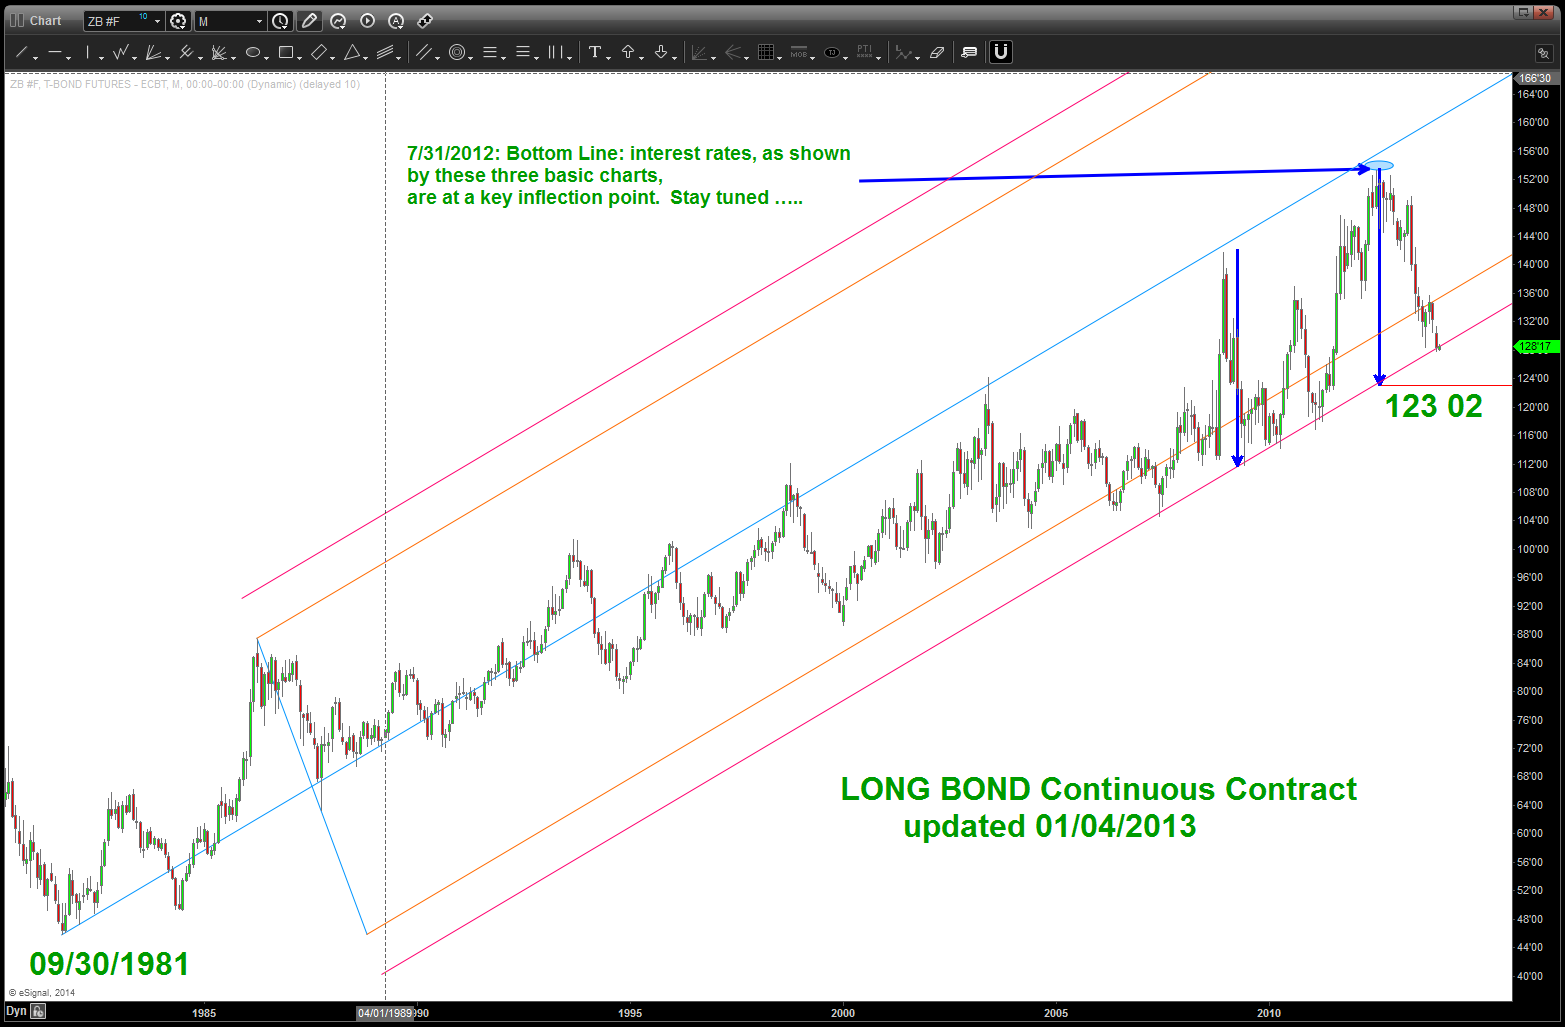
Long Bond updated 1/4/2014
we are sitting right on the cliff that has held rates at bay … I’ve used the “Pitchfork” method to help define the trend line using the “major” impulse low that started this run in 1981. the red line is a simple 1.27 expansion of the construction of the Pitchfork. It CREATED the trend line … remember 1.27 is the square root of 1.618. Also, note the blue arrow is the LARGEST measured move correction since the 1981 origin. IF/WHEN we lose this CLIFF prices should fall to the level shown …
below is a DAILY chart showing a POSSIBLE count. Note, looks like we are finishing up a 3rd w/ perhaps that break into the target shown. Here’s what we need to really pay attention to … in the past, when this trend line was hit PRICE exploded. We are, at a minimum, respecting this support but price action doesn’t appear to be very bullish in/around here. Just take note … again, a break here will target the 123 level.
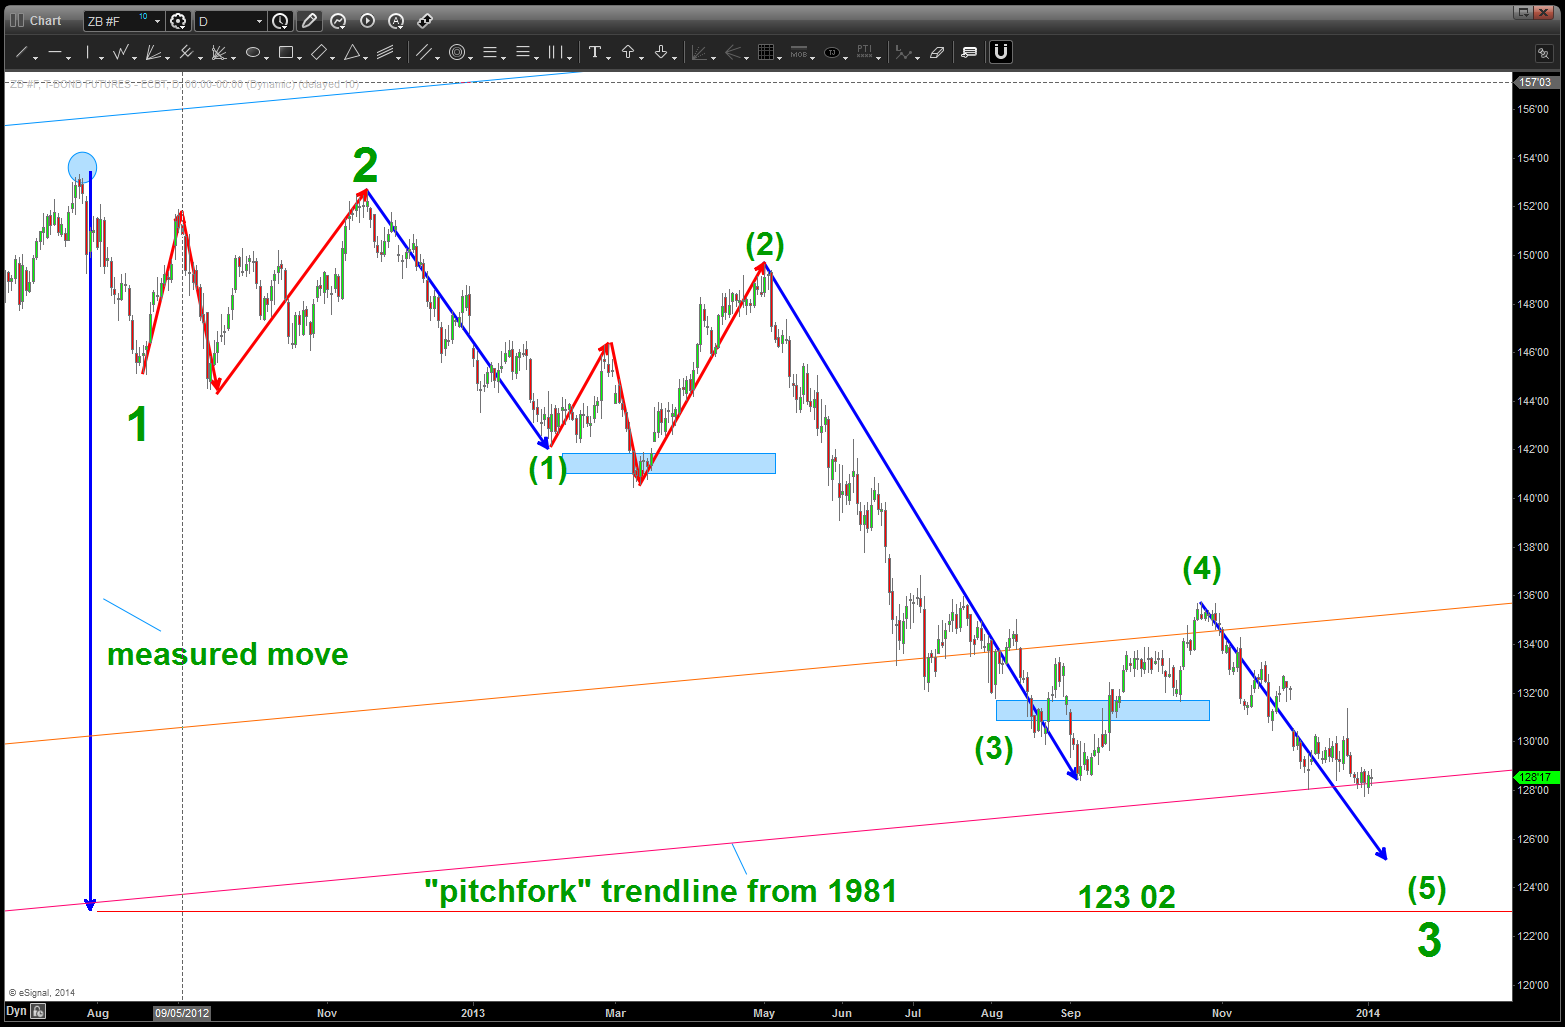
long bond daily count
2014 is going to be one heck of a fun journey …
rock on, ok?
BART
remove bias, trade what you SEE – JP Morgan
Posted on December 31, 2013 Leave a Comment
does ANYONE remember the EMOTIONS of March 2009? do you think ANYONE in their right mind would recommend a BUY on the XLF in MAR 2009? well, just as a reminder here it is …
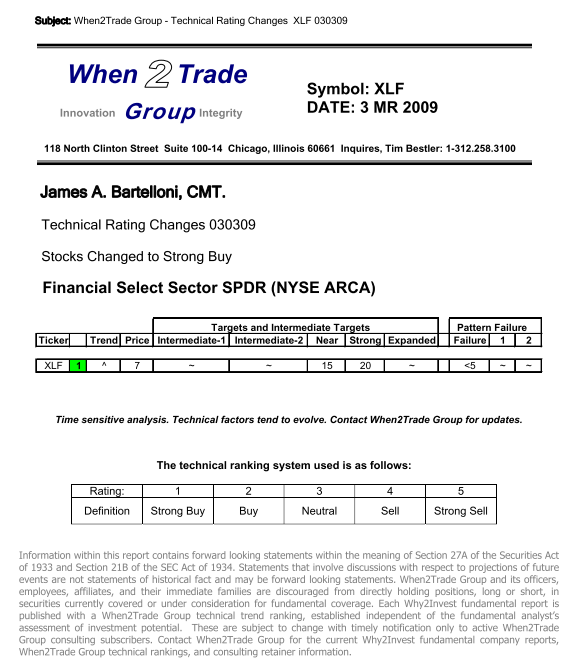
XLF at the LOW
why am I pulling this thread right now? well, the past couple days I have received some very convincing emails around how WRONG I am w/ regard to the PATTERNS that are appearing in the US Equity Market. Here’s the dirty little secret .. I am NOT wrong because I just look for PATTERNS. the PATTERN will work or it won’t. Over time, this EDGE will show profitability IF I manage the RISK.
a couple years ago I had the amazing opportunity to present to the entire MTA (www.mta.org) on PATTERN recognition as an “emerging CMT.” I presented a bunch of charts showing some GREAT set-ups based on PATTERNS. No moving averages, bollinger bands, MACD, stochastics or any of that “stuff.” Frankly, I believe they work but, honestly, I don’t understand them that well. I like numbers, music and geometry.
here’s the chart that I presented on the BUY of JPM. If you want me to go over the details of the chart, let me know by email and I will explain. The PATTERN that was present was a BUY at 15 dollars. BUY JPM at 15 …
I am presenting this, again, because at the HEIGHT of BEARISHNESS I was a BULL!
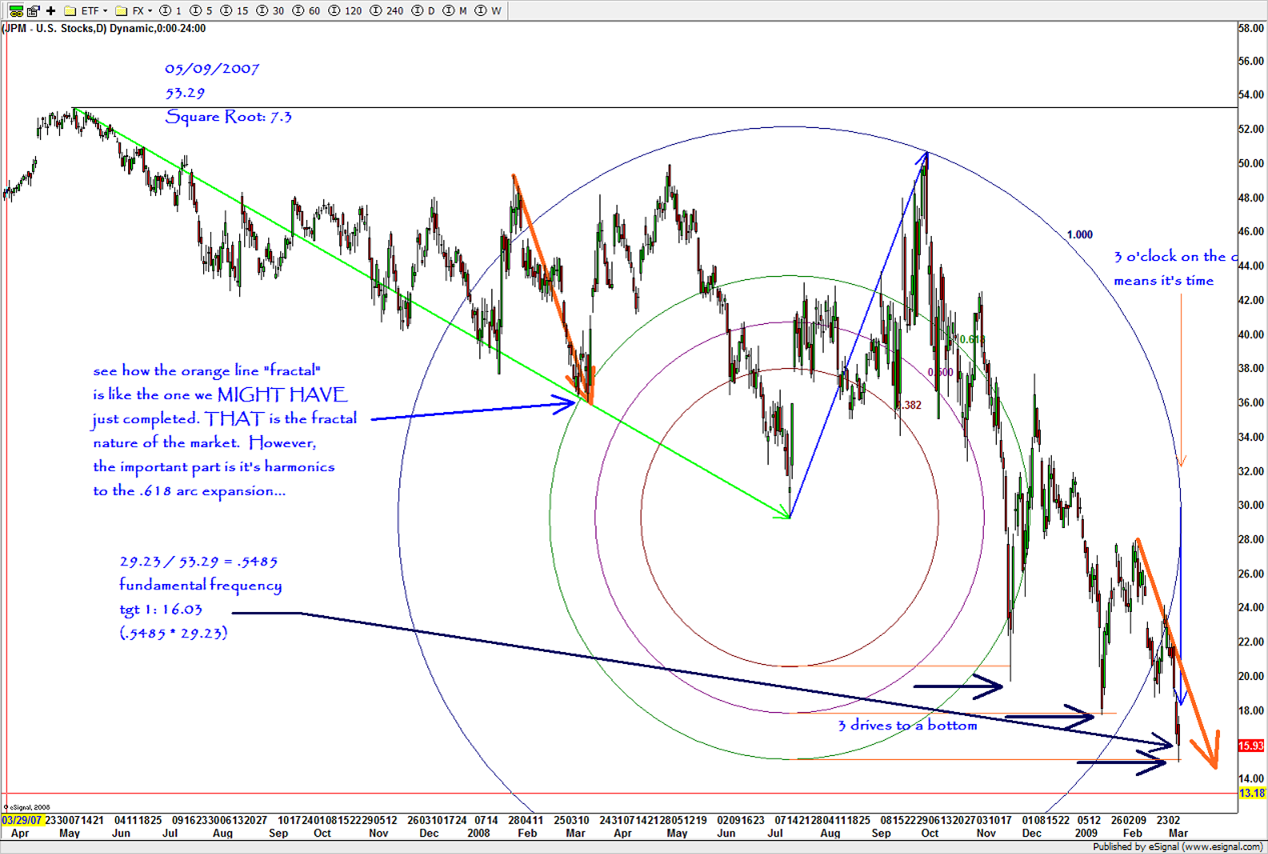
JPM 2009 LOW
here’s the AMAZING SELL PATTERN appearing on JPM:
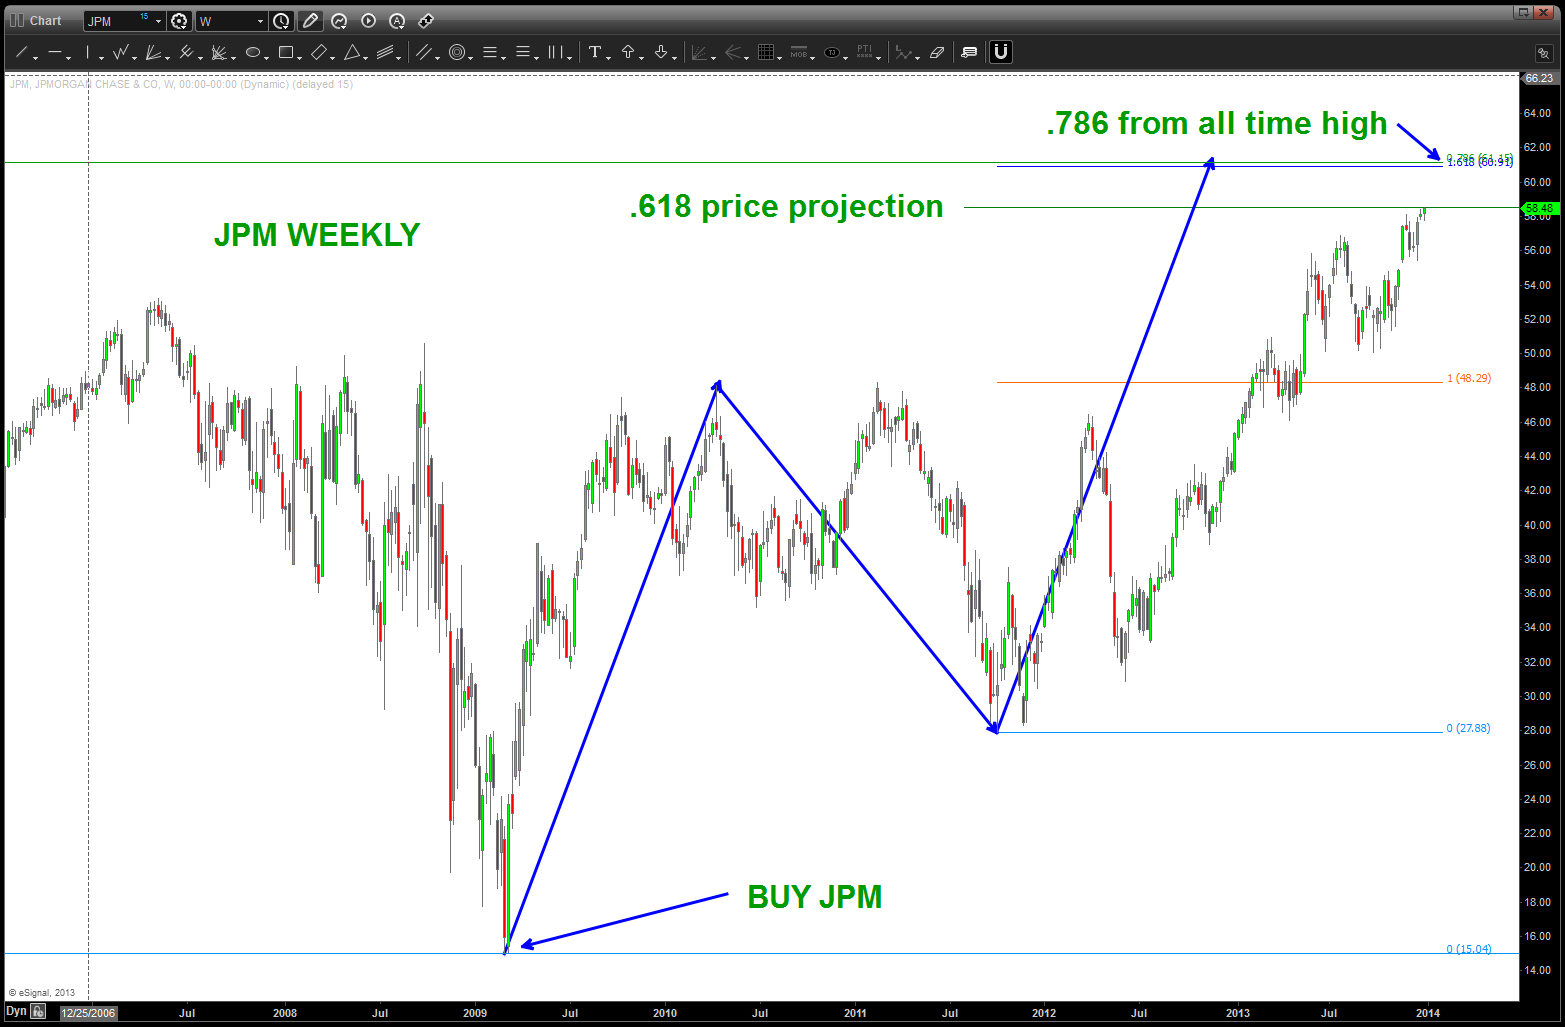
JPM SELL Pattern …
So … the SHORT PATTERN that has appeared on JPM is AWESOME! Why AWESOME? Because … the tightness of the 60-61 level has all the RATIO’s to create a pattern coming together. It’s that SIMPLE. When the “ratio’s” come together so tightly we can MANAGE RISK BETTER ….
one last, the .618 price projection (from the all time low-all time high-2009 low) was hit, exactly, today. So, 58.48 could do it.
if we get above, say, 64 this puppy could “cook off” higher and the band will play on and I’ll continue to eat my “bearish pumpkin soup.”
make it a GREAT 2014!
BART
A look at the high flyers in 2014 – all lower significantly!
Posted on December 30, 2013 2 Comments
I am neither bearish nor bullish. I am a pattern recognition trader that puts everything into the context of human behavior. the rally from 2009 is so over stretched that 2014 will bring, potentially, a down side move of enormous proportions. There I have said it …simply based on the MONTHLY (read long term) SELL PATTERNS present this is going to be a THUMP. If the PATTERNS FAIL (which they do, obviously) then the band will play on … I just don’t see it happening and, quite frankly, i am alone in my thinking.
The bullishness present RIGHT NOW is the most extreme it’s been in the history of the stock market …do you want me to type it again? Here’s a look at the high flyers and, again, I think they will all be lower, significantly. Hope I’m wrong…
GOOG: note the same pattern and measured move that is present. Tried at/around 925 and got my clock cleaned. in prove it mode now … but sure looks done.
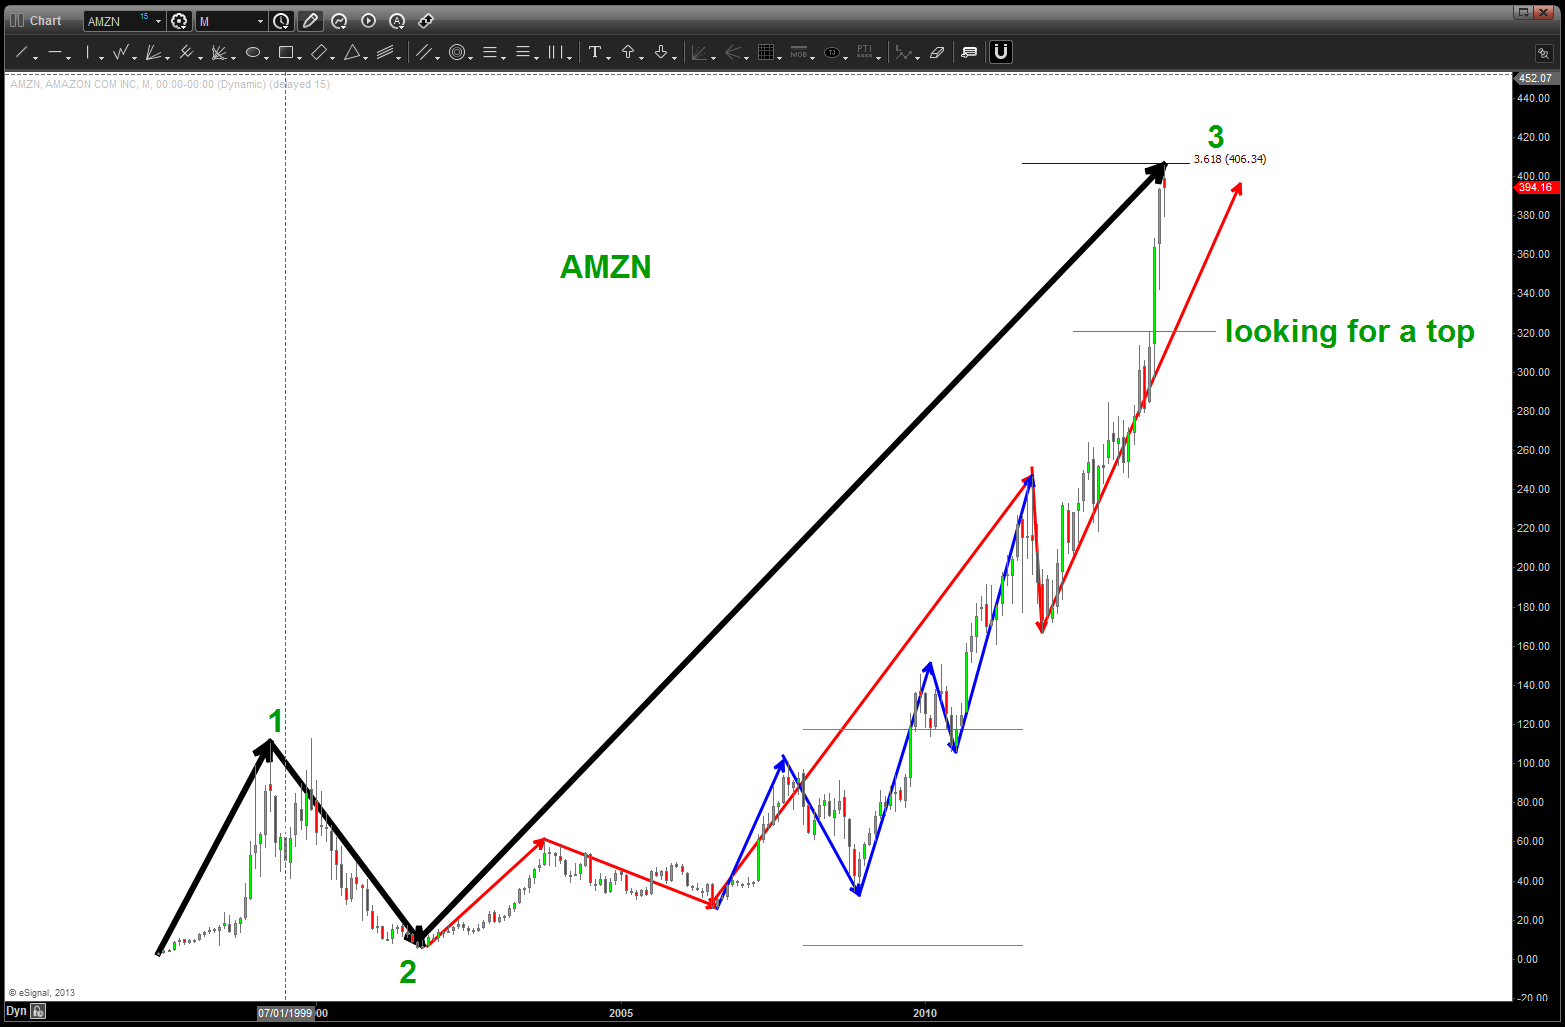
AMZN: a 5 wave count is present and I was looking for a top lower, but got run over by the euphoria present in the market. this doesn’t change the count, it’s just going to hurt that much more …
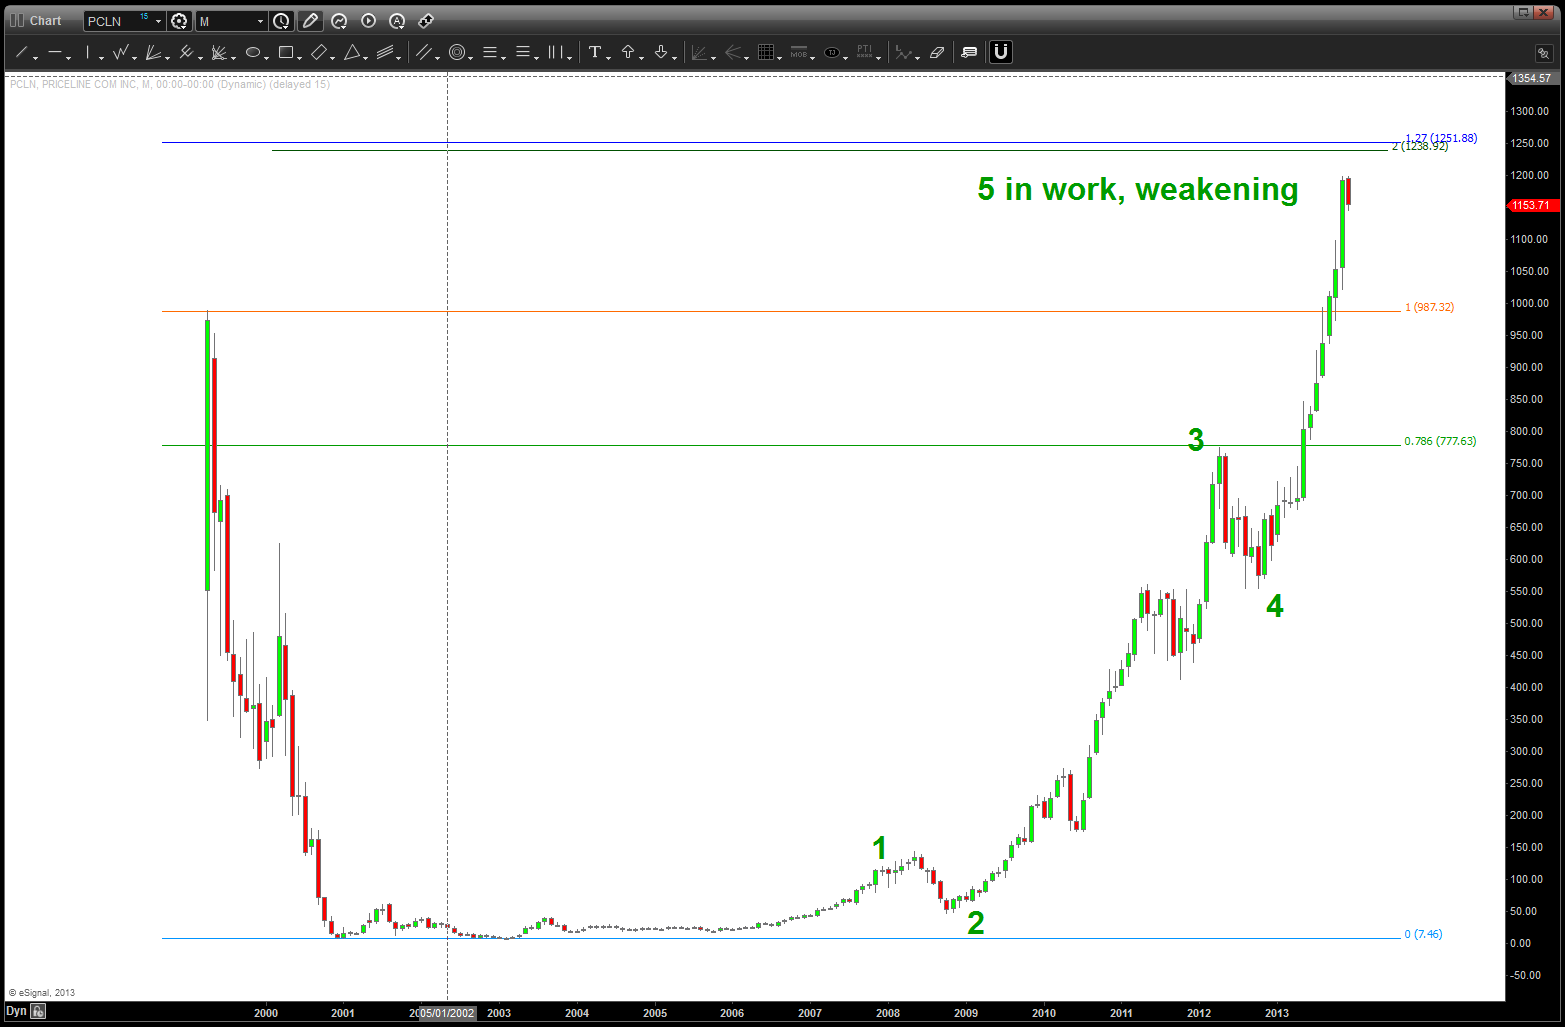
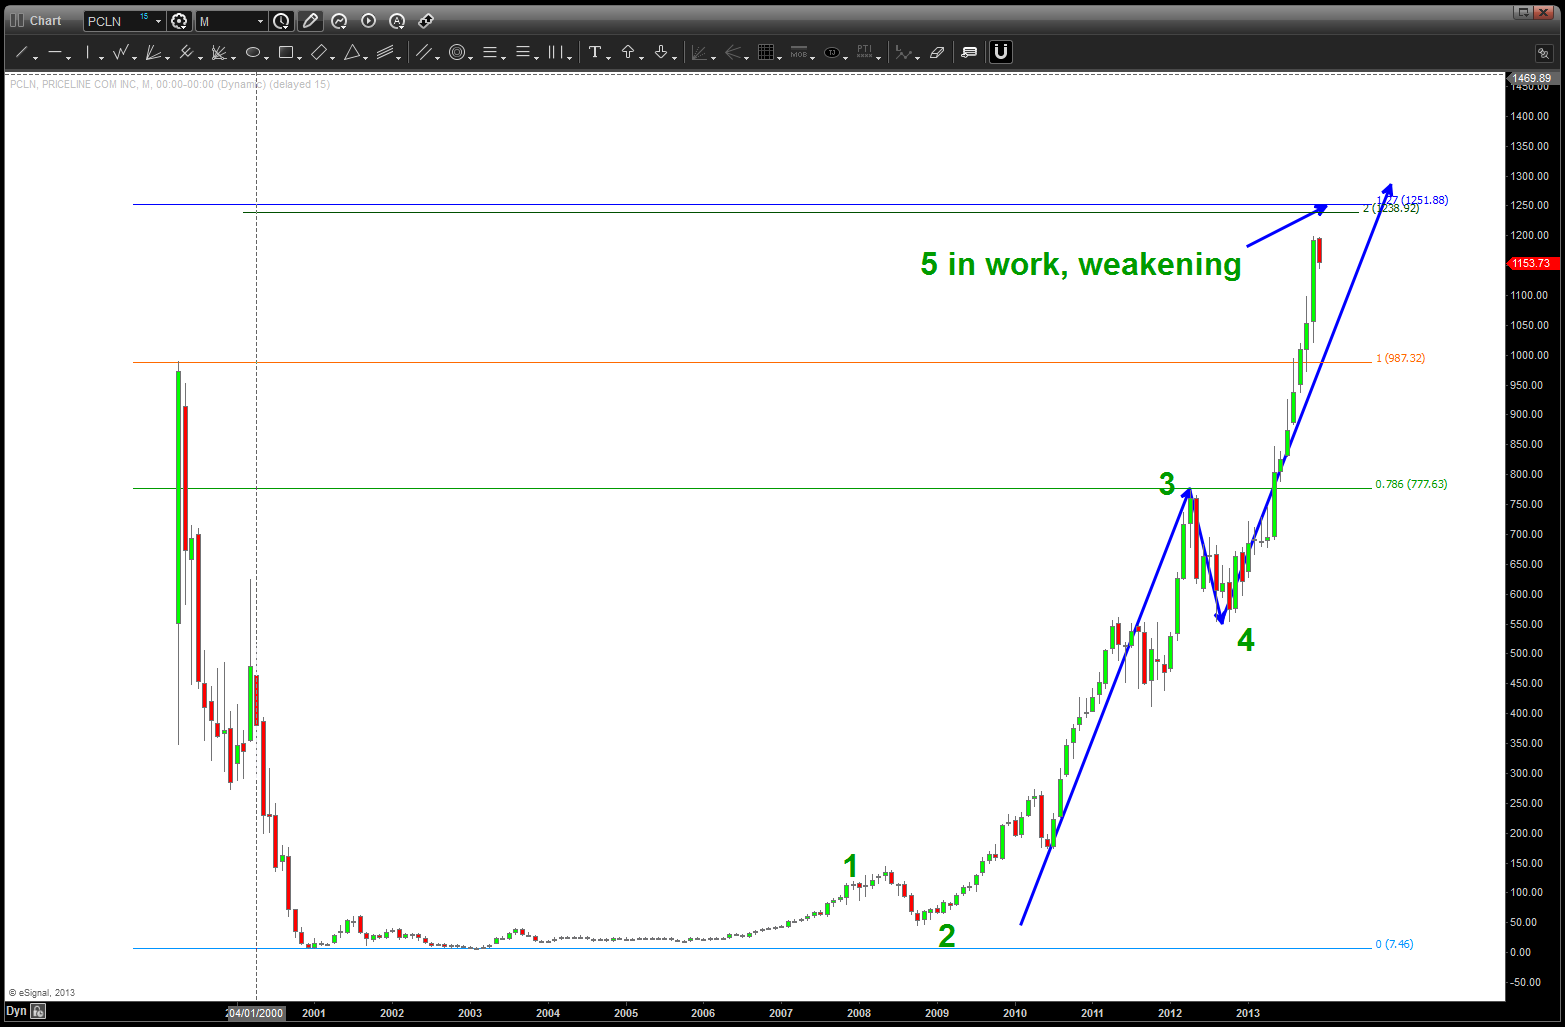
PCLN: again, a clear 5 wave count present and a high flyer of AMAZING proportions .. perhaps a little higher to targets shown? but 5th wave is weakening.
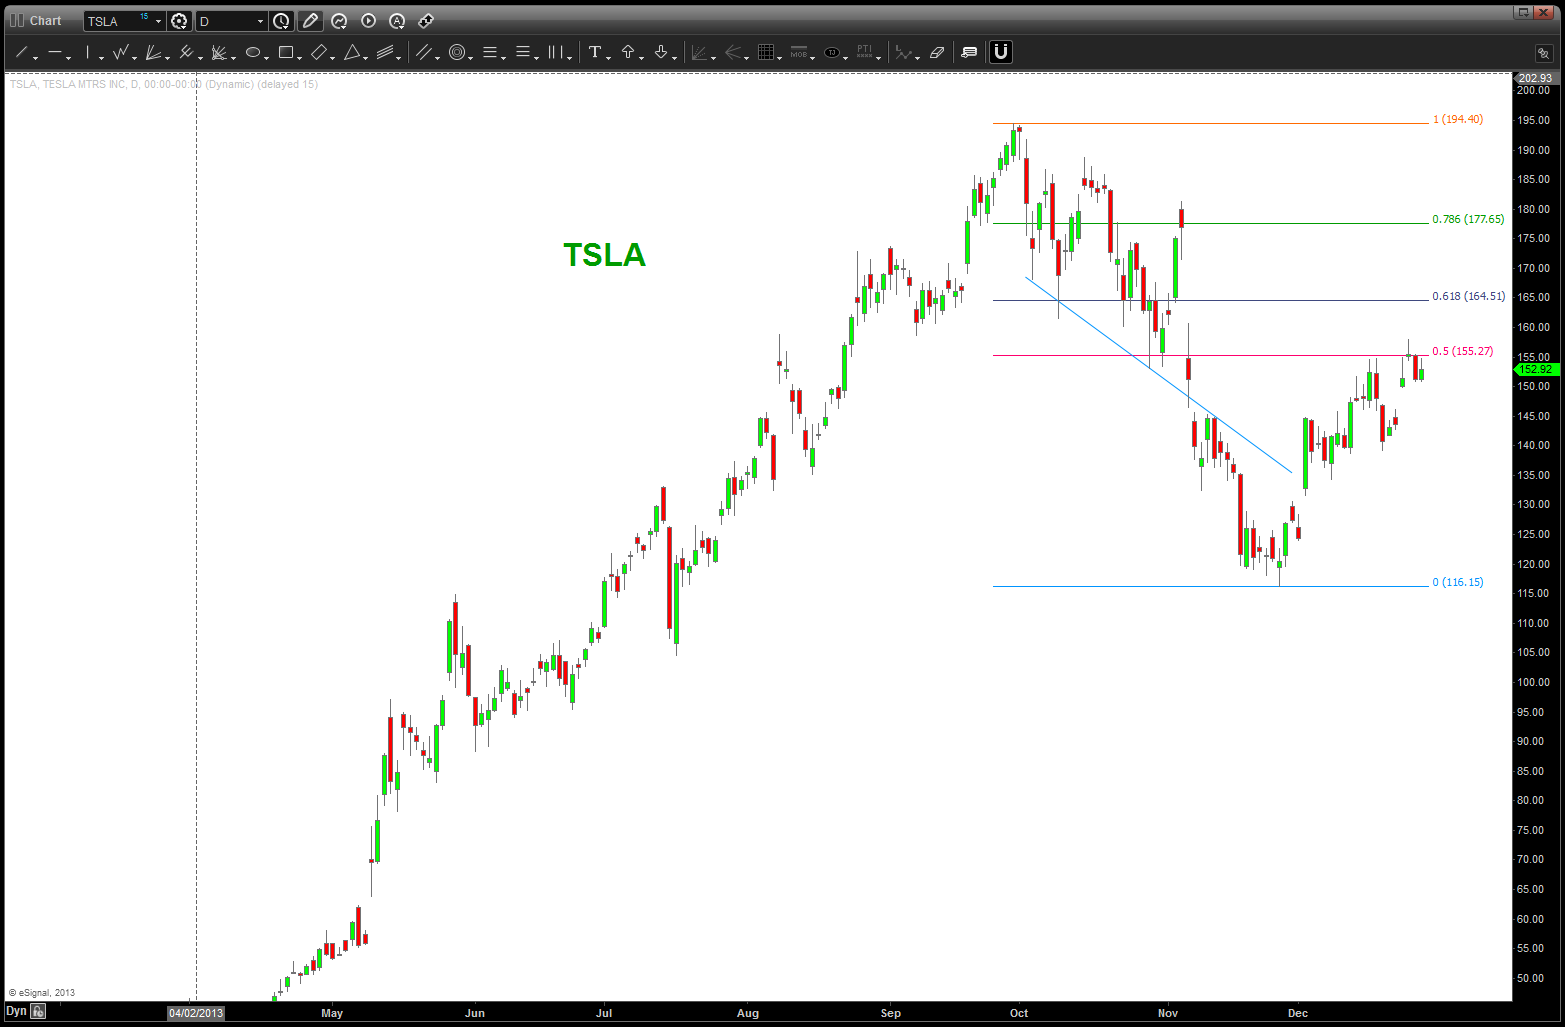
TSLA: bounce occurred as expected .. believe it will start, in earnest once the new year rolls around.
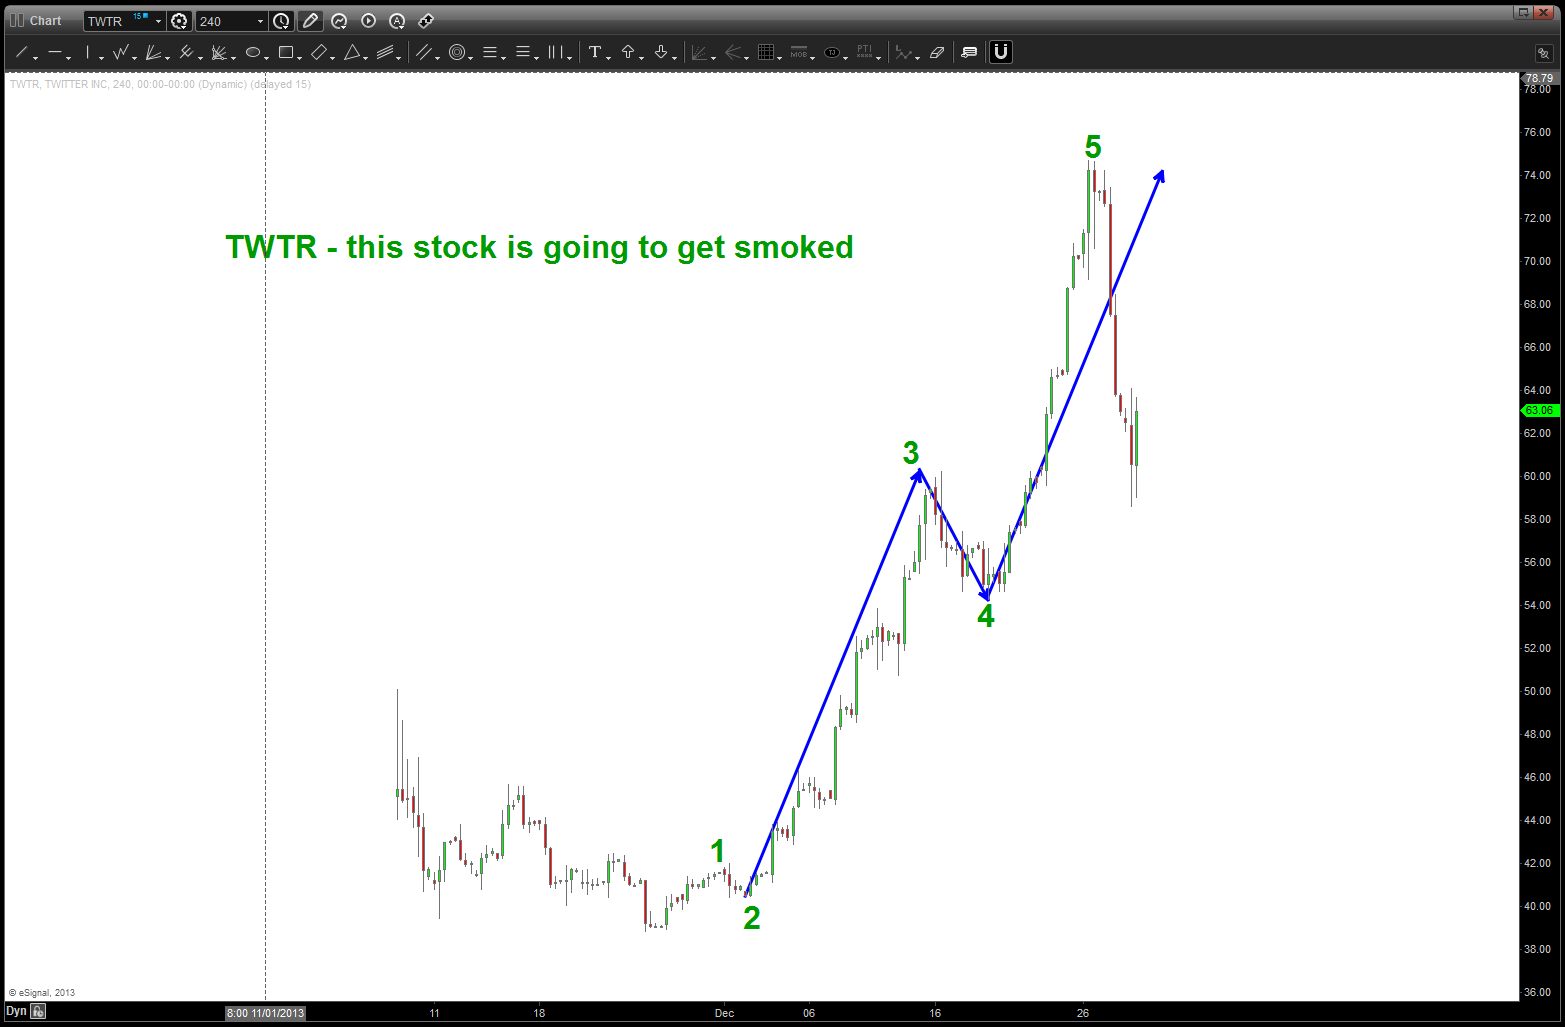
TWTR: bouncing today, but possible count complete. believe this stock is going to get smoked
FB: unorthodox count but one that makes sense .. basically, this entire move has been a corrective expanded flat and FB will go to single digits.


the YEN in 2014
Posted on December 29, 2013 Leave a Comment
the monster move made by the YEN and, correspondingly, the Nikkei 225 has been extremely impressive. the BOJ drew a line in the sand 10/2011 at 76 USD/JPY. That monthly/weekly candle reminds me of the end of the bear market in gold at 252. Kaboom and off she went …
more importantly, take a look at these two long term charts – I believe there is a long way to go.
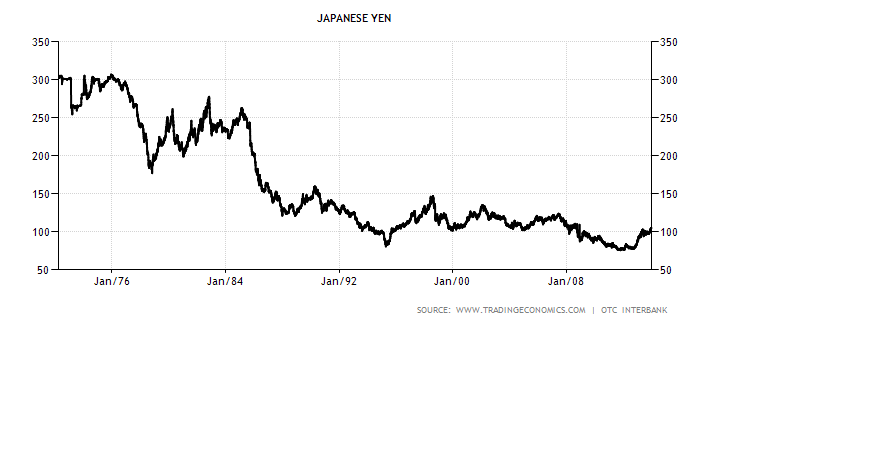
long term JPY vs USD since inception 1972
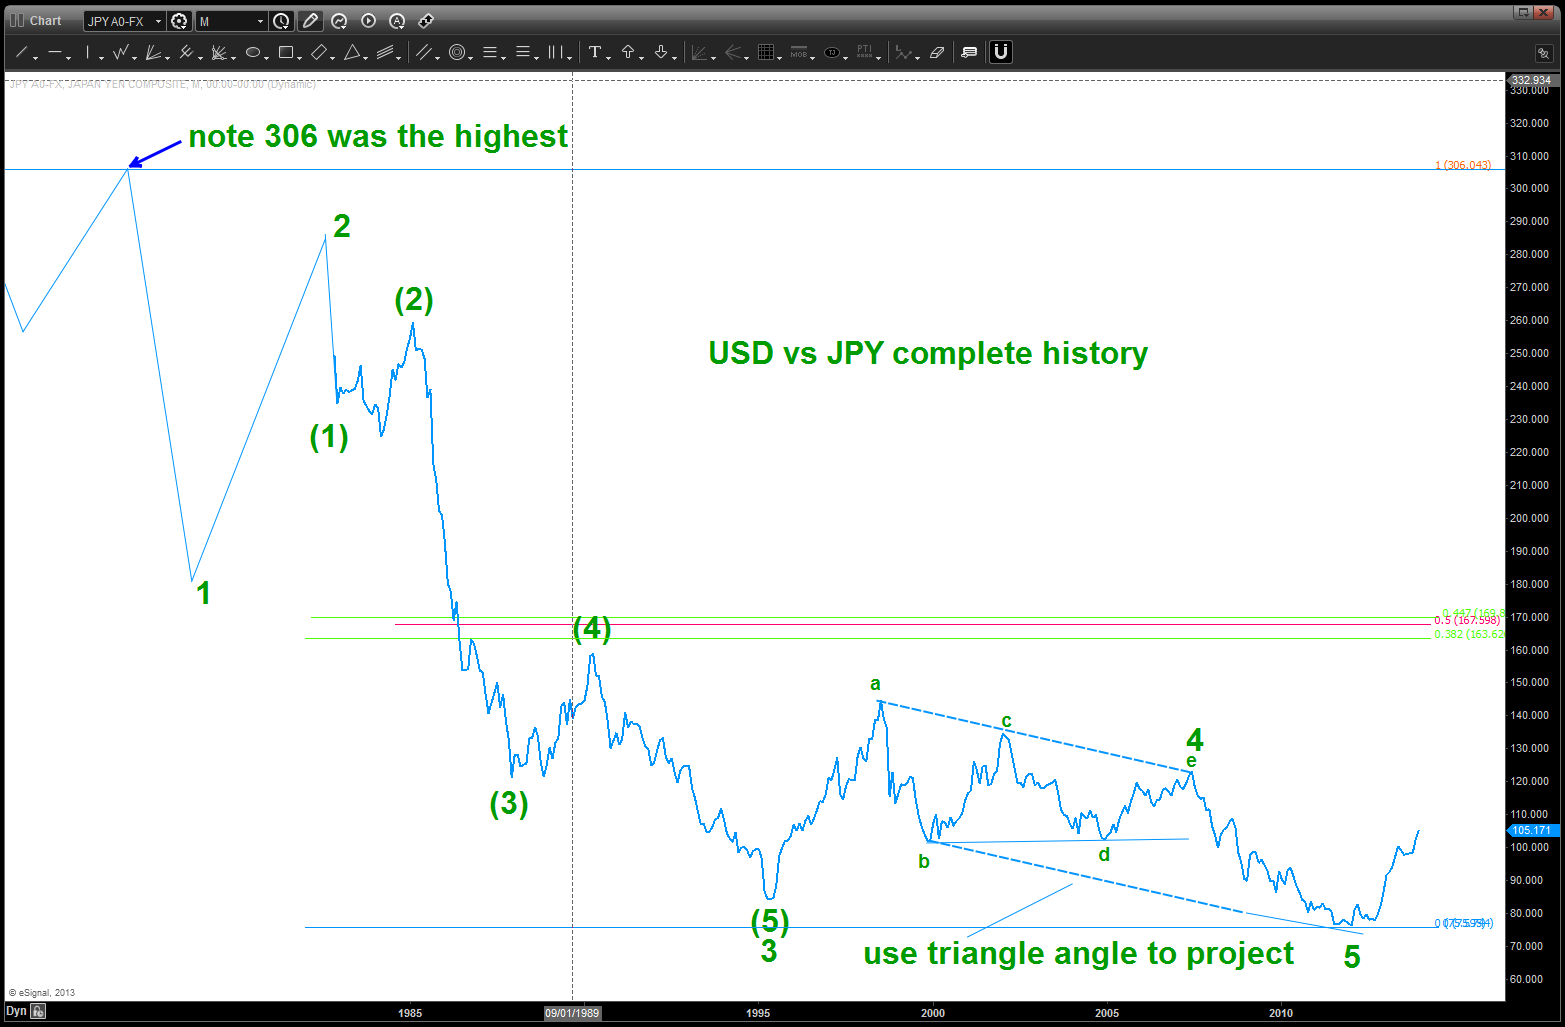
a possible count
using the date from the first chart I have superimposed a line that shows the “basic” movement from the all time high at 306. it’s “close enough” to get the look/feel of the count and I believe we have traced out a major 5 waves down. I like the 5th wave bottom because it corresponds to the “line in the sand” that the BOJ set …taking the long term perspective, an initial target of 160-170 is, quite frankly, a reality. so where are we now …?
right now, I believe risk favors sitting on your hands as a pretty nice 5 wave movement certainly appears to be completing and we are banging right into the .618 retracement of the “e” wave of the major 4th wave triangle. my focus will be on a a-b-c type of correction that could go rather deep but, ultimately, will provide a another opportunity to get long USD, AUD, POUND, CAD, CHF versus the JPY. If history is our guide, then this correction could last a while … waves 2 and 4 were multi-month corrections. so … sit on your hands and wait for a pattern to appear. again, patience will be our guide to look for a still monstrous opportunity.
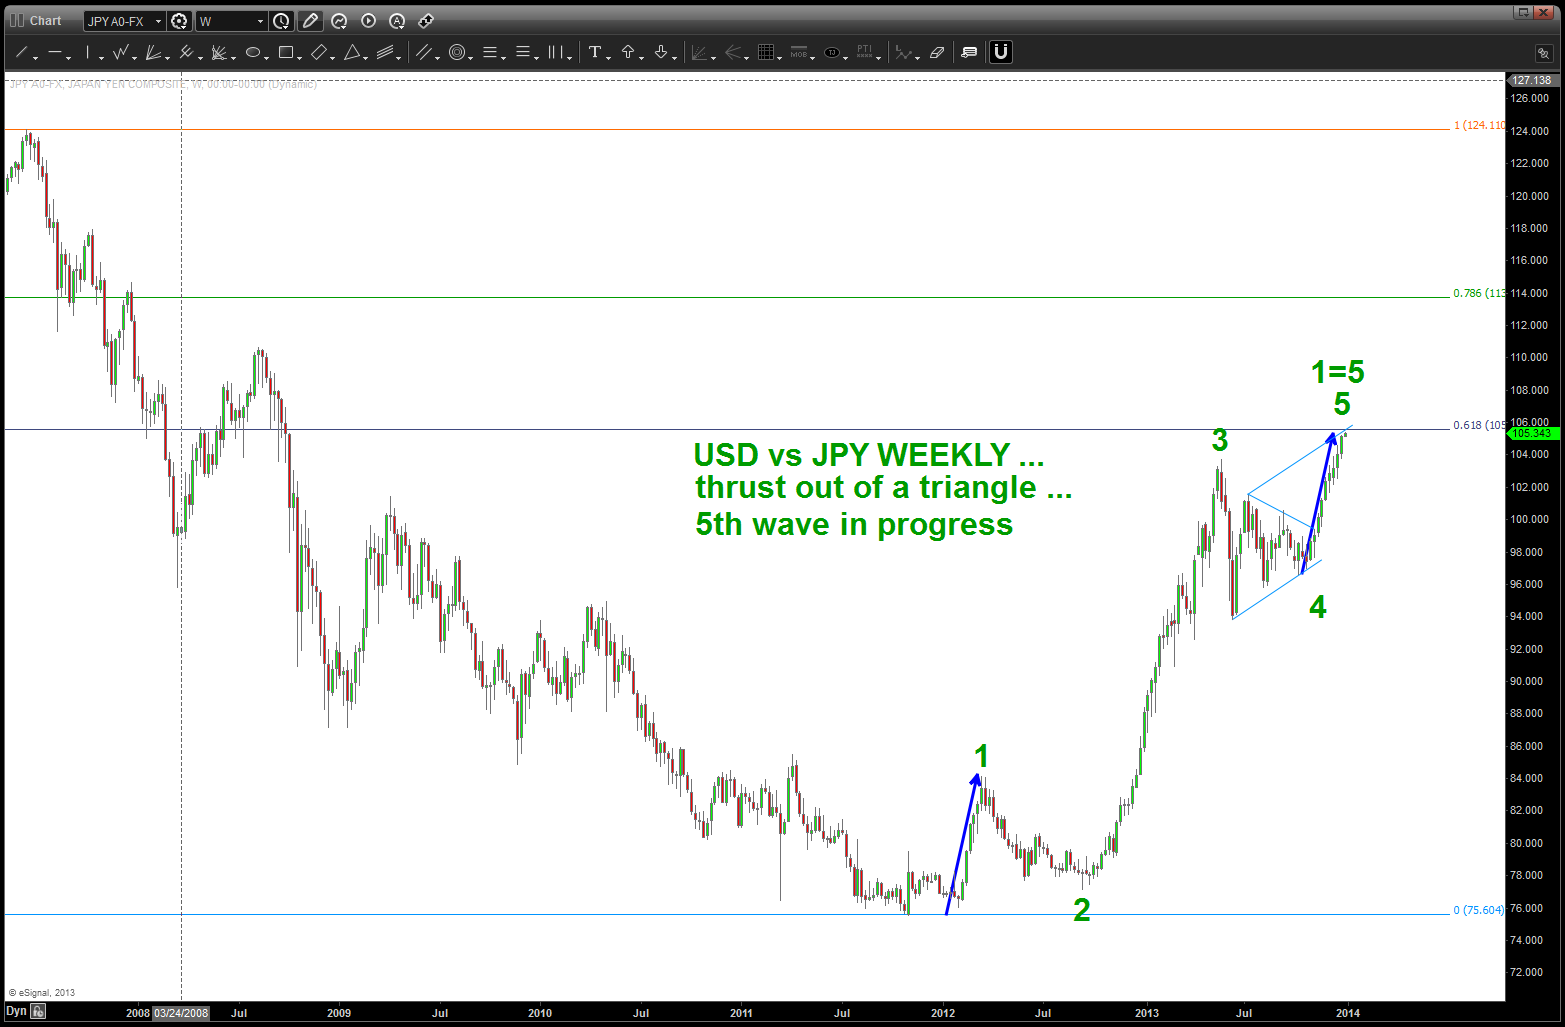
USD vs JPY weekly
Crude, the Loonie and Oil Services Index for 2014
Posted on December 29, 2013 Leave a Comment
the chart below shows the Oil Services Index $OSX (candles) w/ USDCAD (inverted/line) overlaid on top …
some observations:
- when the blue line (Loonie) is going down it is weak. when the blue line (Loonie) is going up it’s strong …
- at most inflection points, the $OSX and Loonie are synchronized nicely. however, for most of 2013 this relationship has diverged. in that, while one was going UP (Oil Services Index) one was going down (Loonie weak)
- the Loonie topped a good 6 months prior to the $OSX in 2007-2008. However, once they synced they got smashed …
- the 2009 bottom was well synchronized and since then they have move very nicely together.
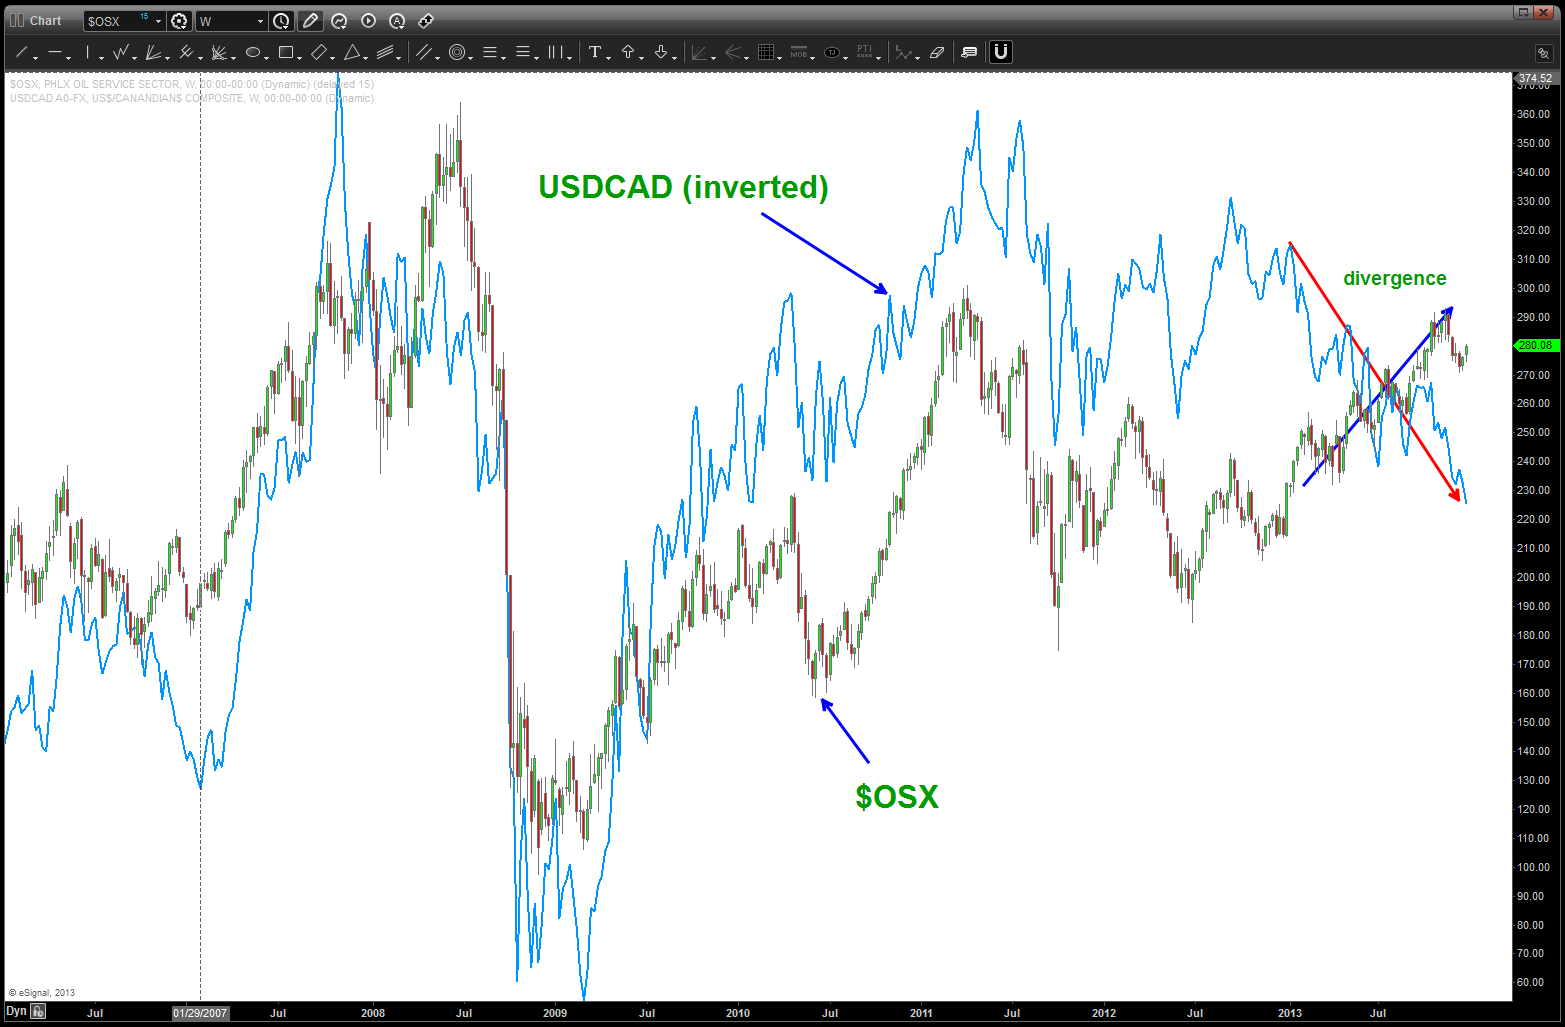
$OSX and USDCAD
below, we have added (black line) Crude Oil to the chart and, as expected, it is very synchronized w/ $OSX EXCEPT since September 2013. Note, the $OSX has held up, nicely. What is this $OSX?
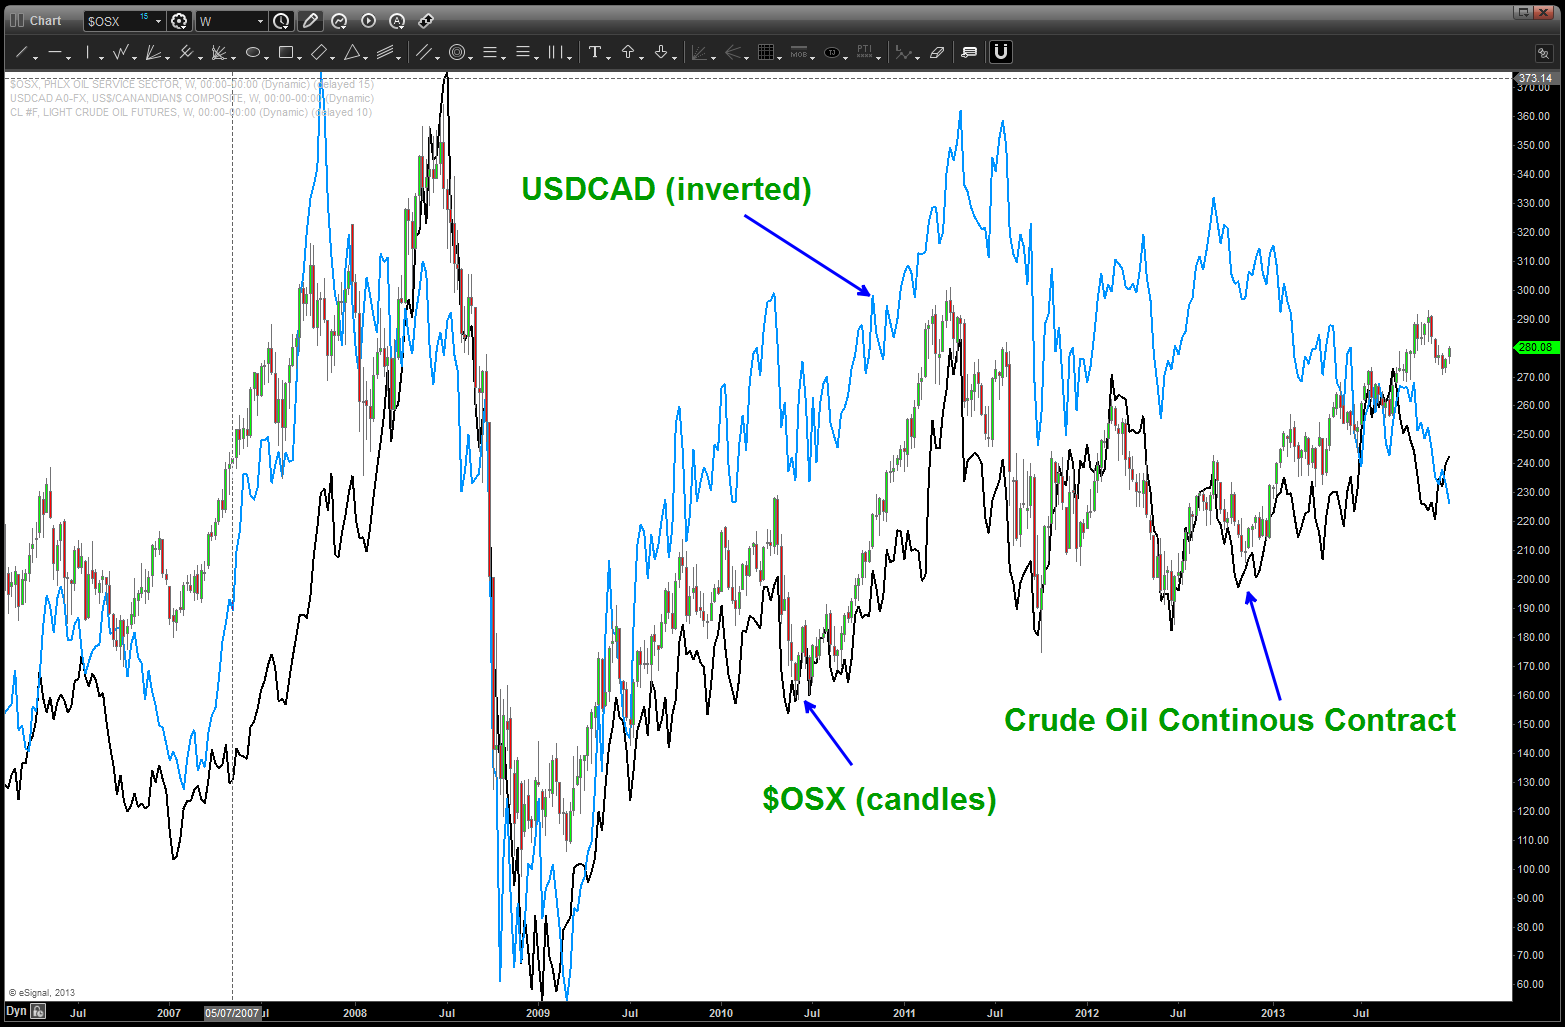
Oil Services, Loonie and Crude
The OSX tracks 15 large companies w/in the context of the Oil Services world …Changes in the Philadelphia Oil Service Sector Index tend to be associated with changes in the oil and gas markets, since greater exploration and construction of wells occurs when oil prices are high and less such activity is carried on when prices are lower. They were all affected by the Gulf of Mexico Oil spill …
so first let’s go thru the 15 components and look for big picture patterns – BUY or SELL.
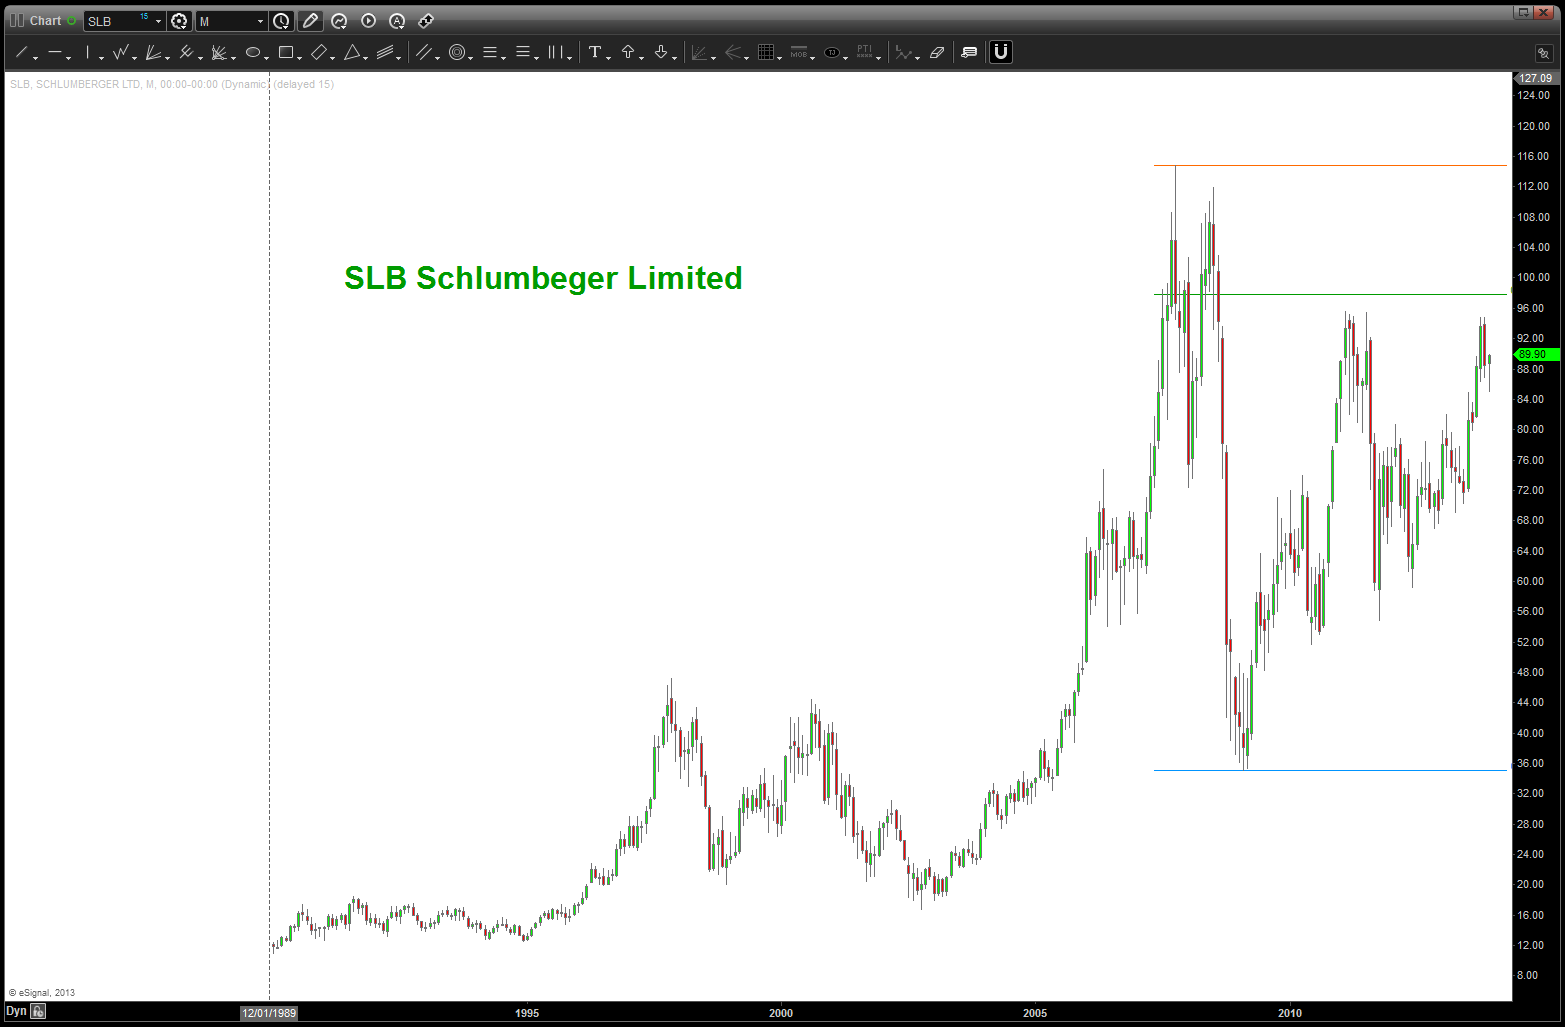
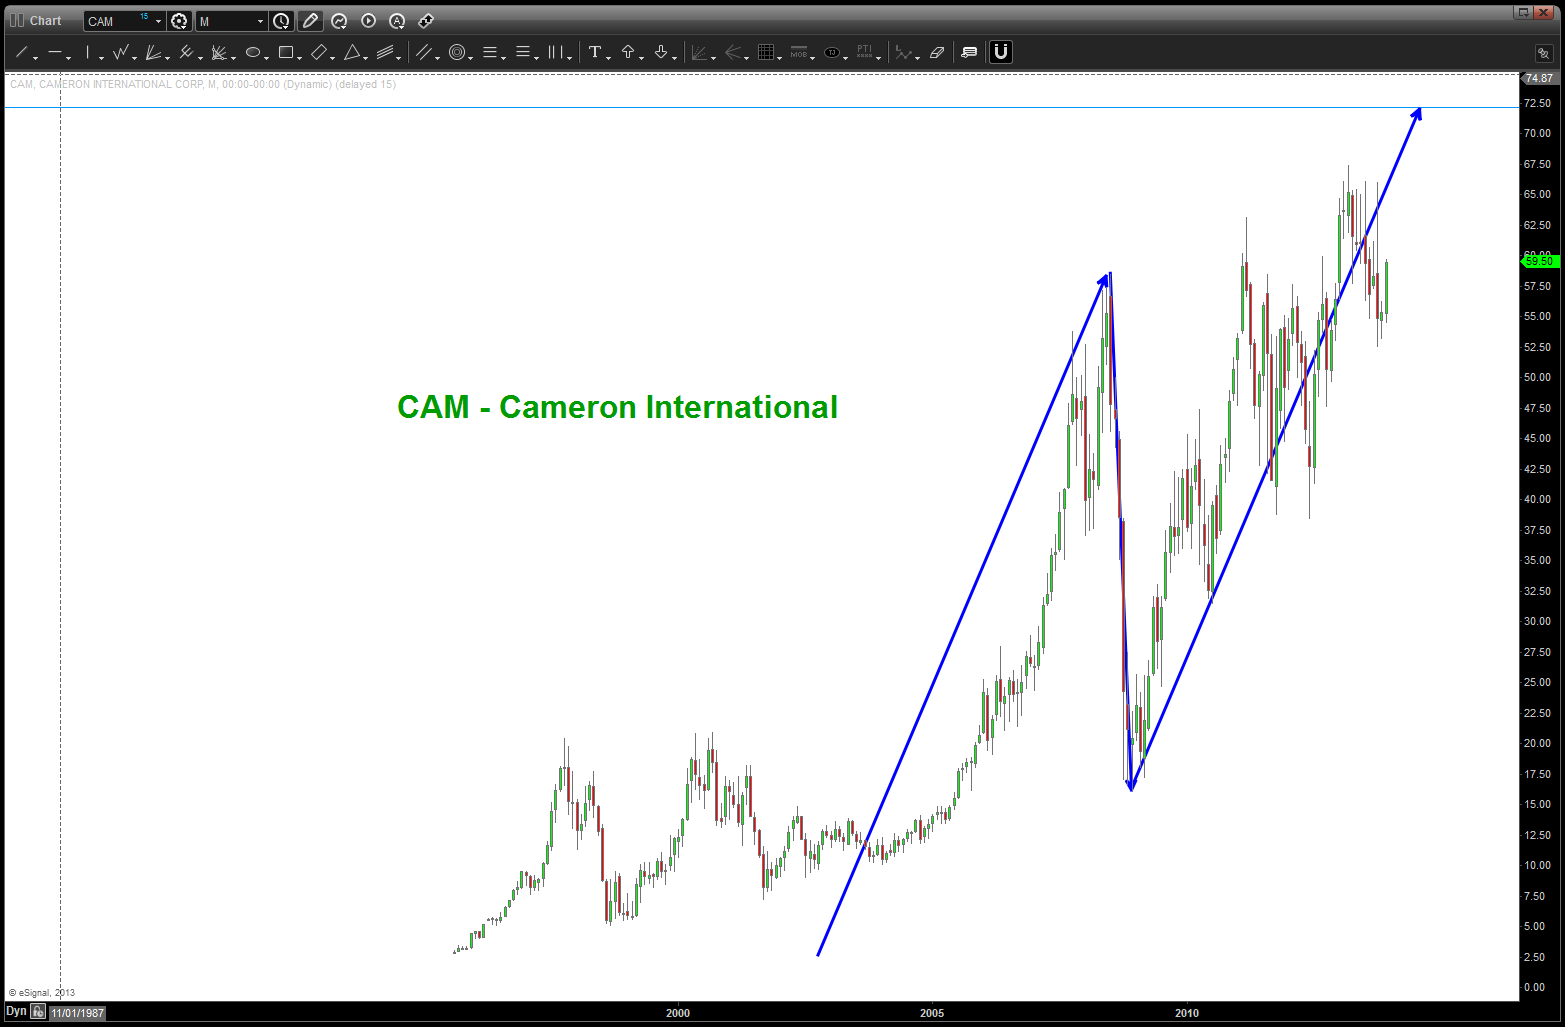
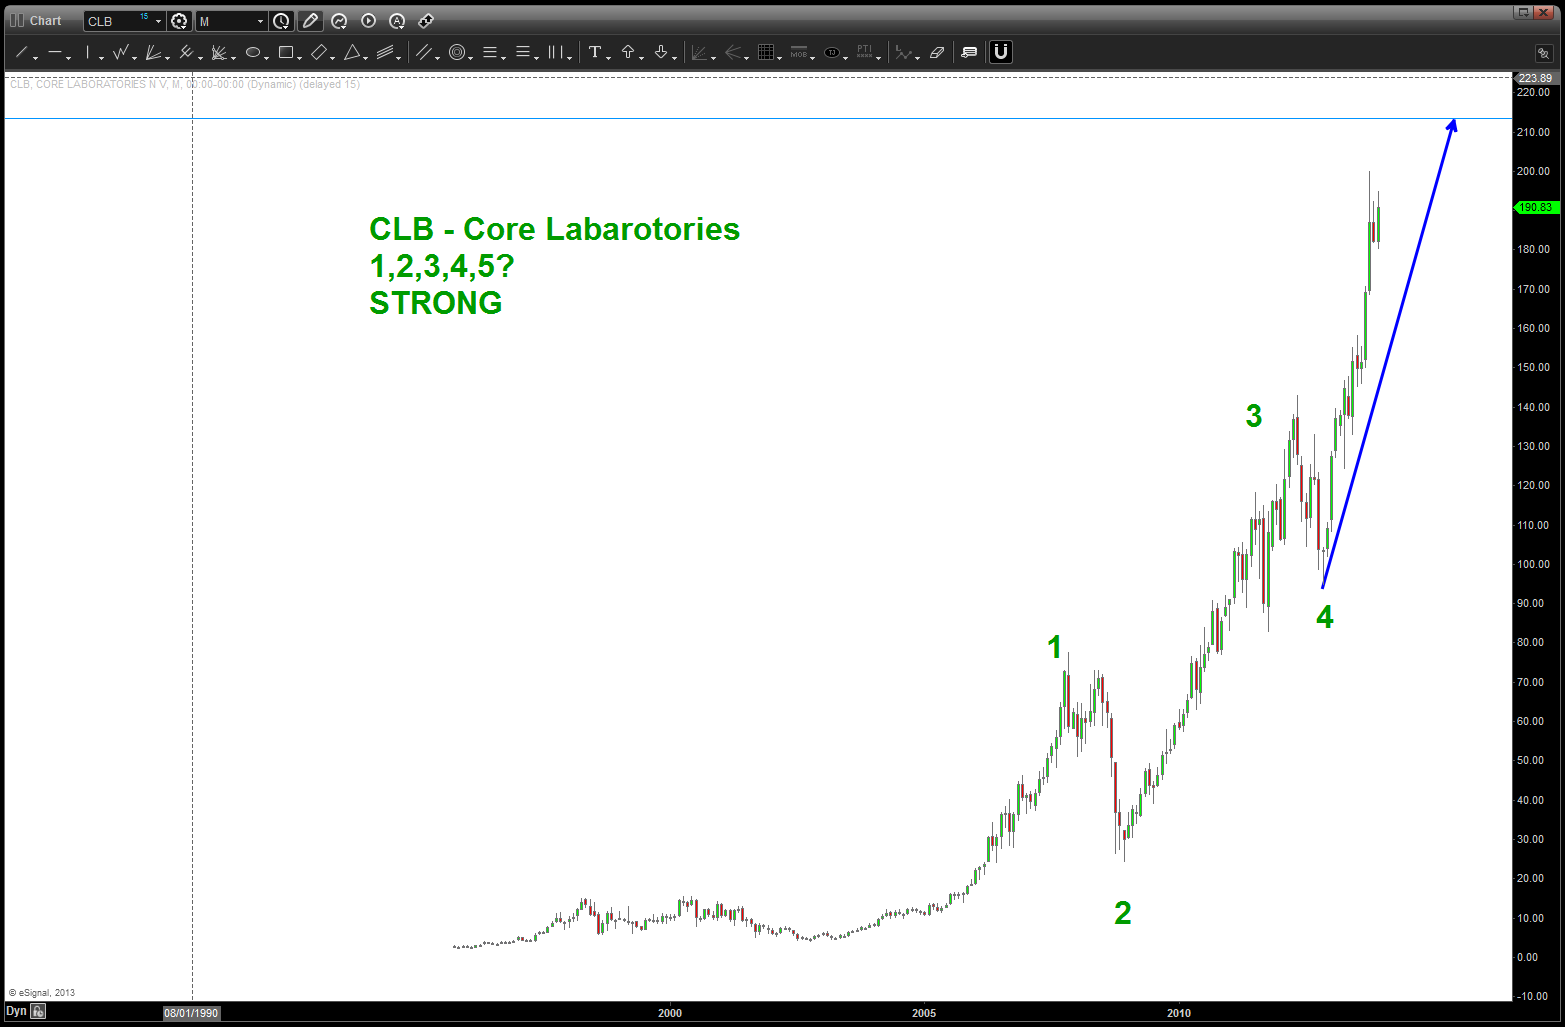
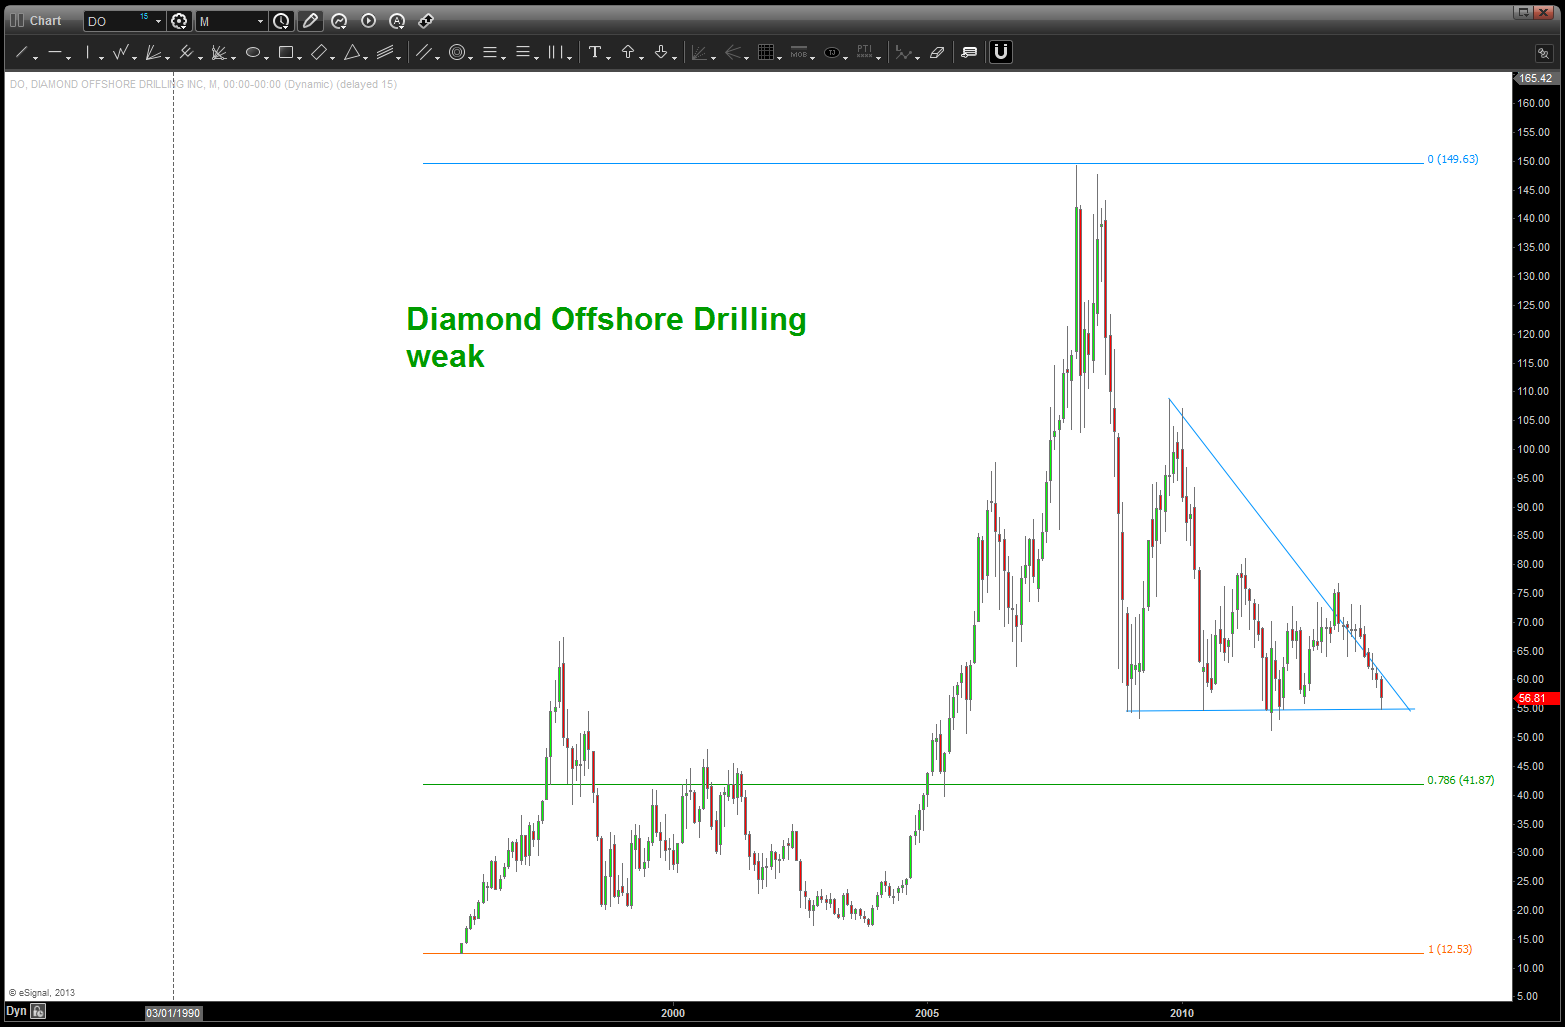
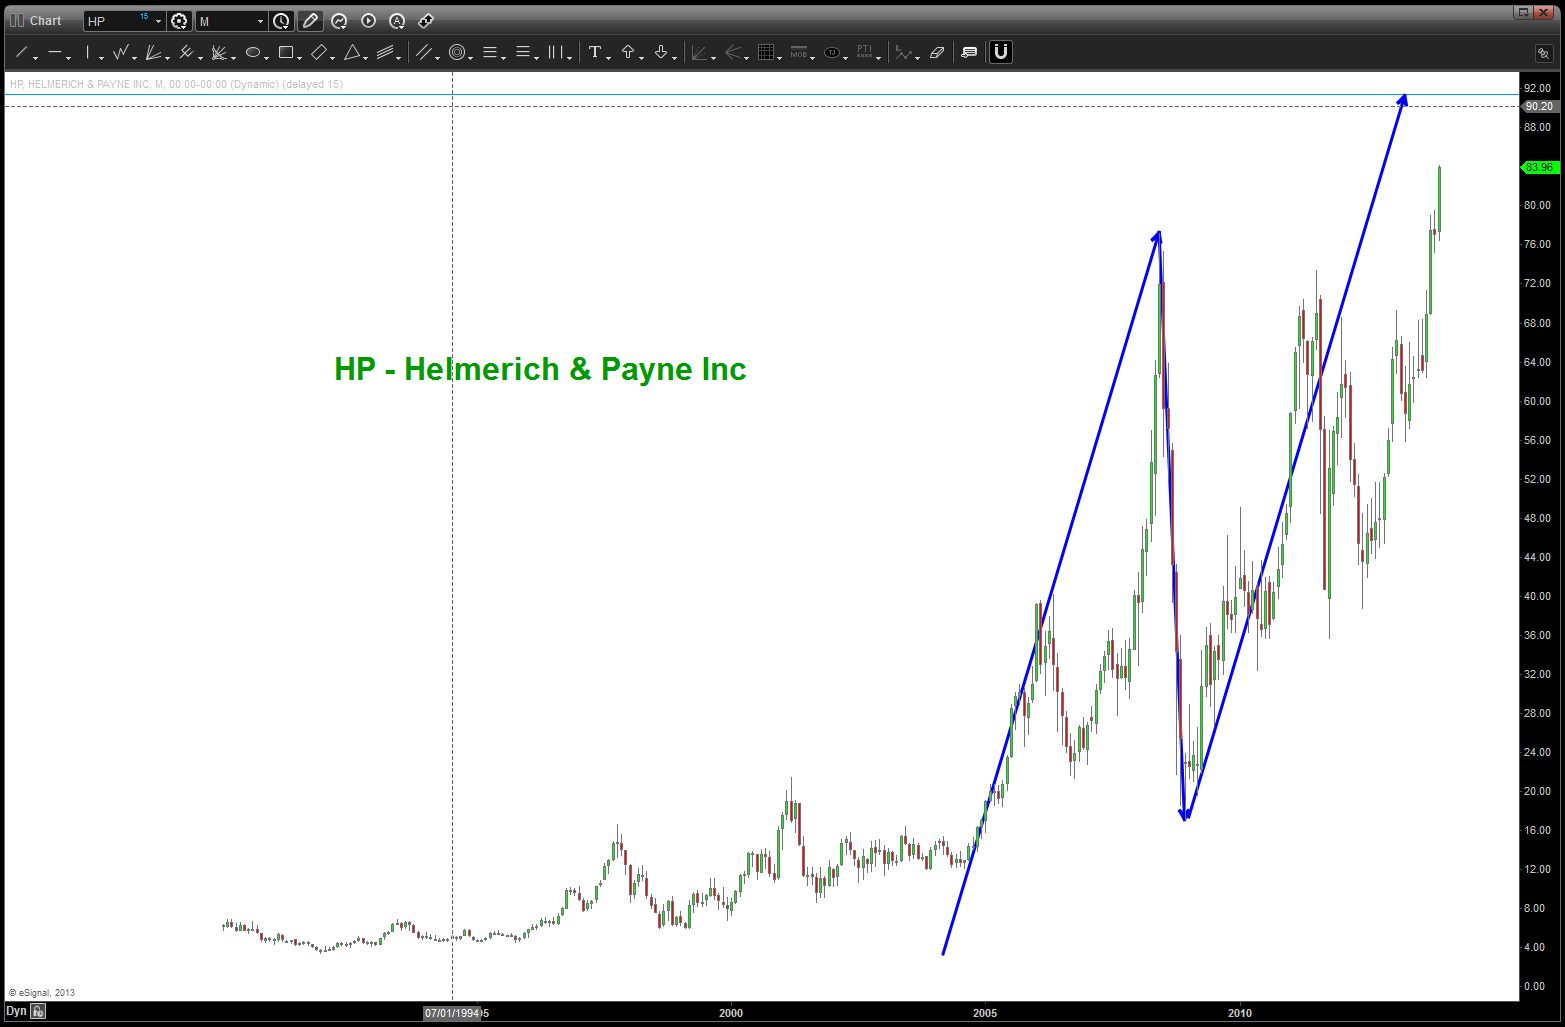
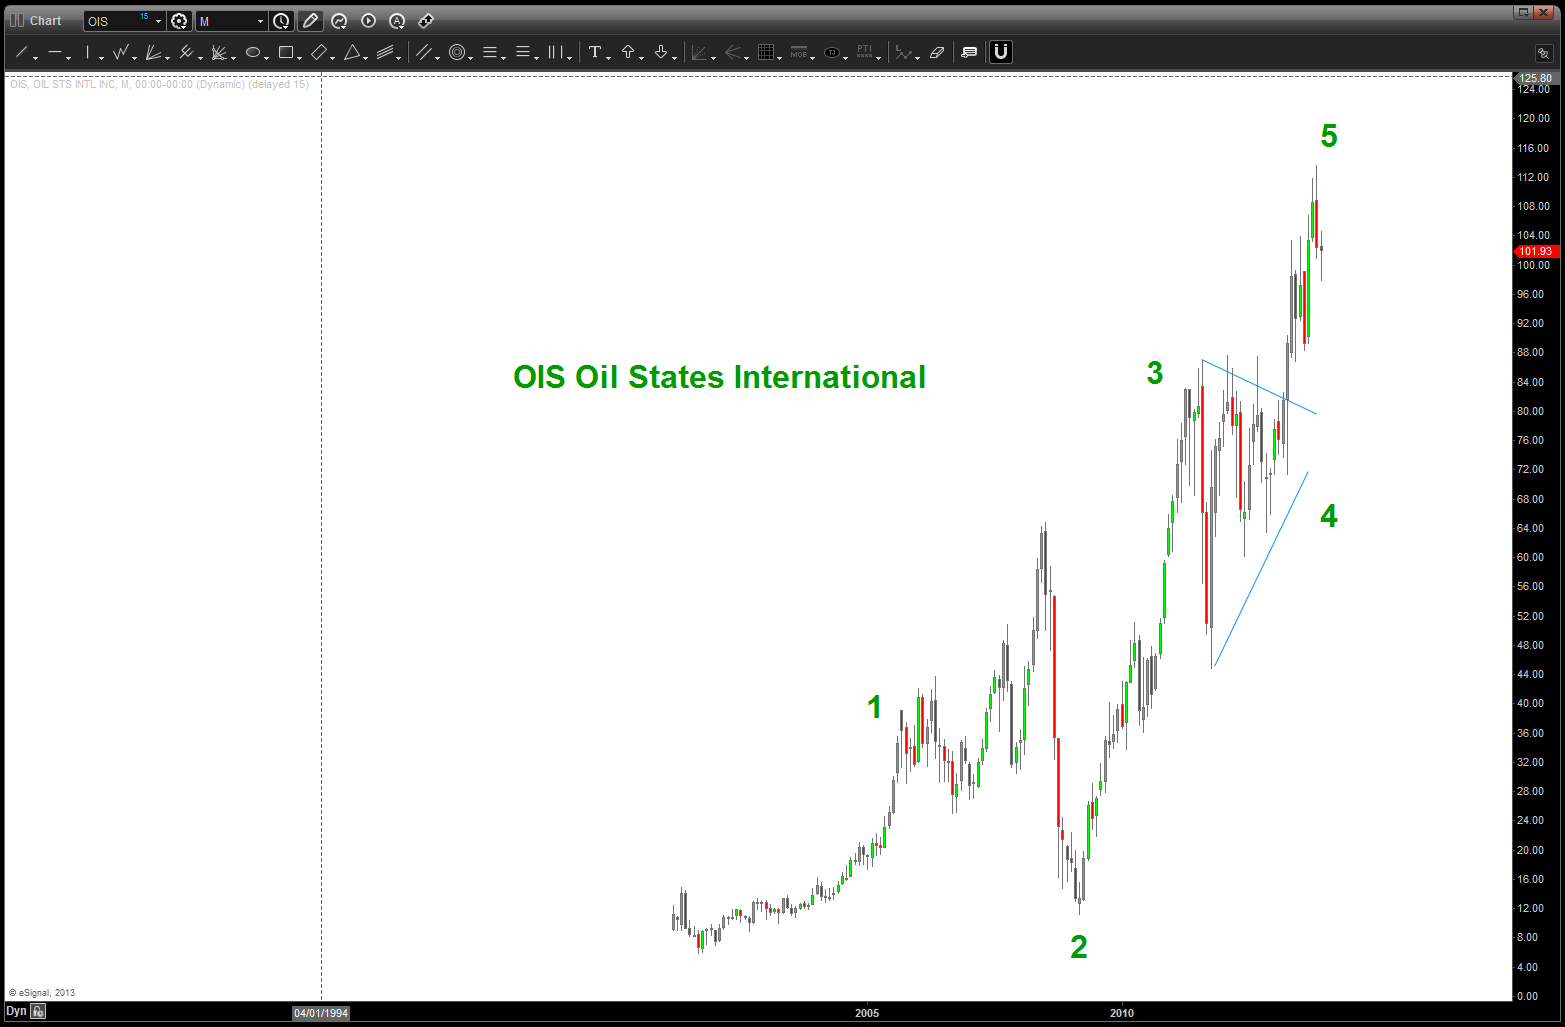
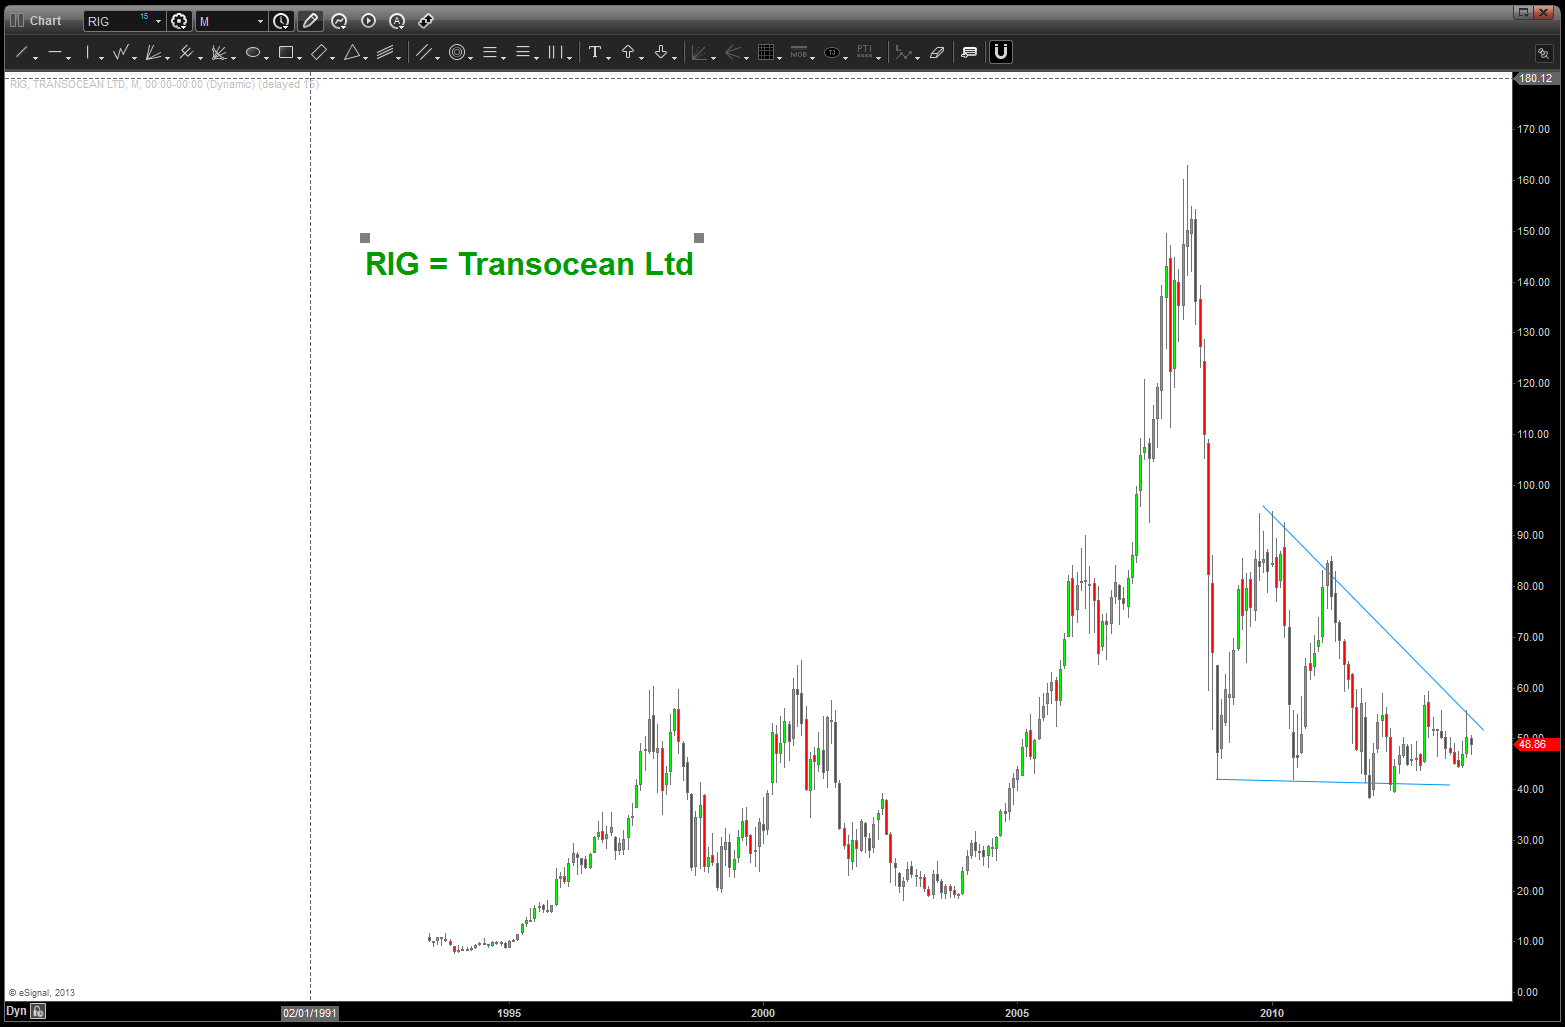
so, as we can see, there are some nice SELL patterns coming in, there are a couple weak ones and where I didn’t post any charts there wasn’t a glaring pattern to be seen. Bottom line – I’m not seeing significant strength in the index but to elevate some of the stocks to hit their targets perhaps we’ll see some more strength. so, now we need to break down each individual component …
Crude Oil: https://bartscharts.com/2013/10/31/crude-oil-a-potential-roadmap/ this was my last post. I am still in the “look and feel” phase that the top at 147 was a 3 and the low in/around 35 was a 4. while the pattern completing at 110 was good, the thrust off this bottom trend line last week led me to see a triangle where we can see a,b,c,d,e – triangle complete and off to a new high ? CRUDE BULLISH
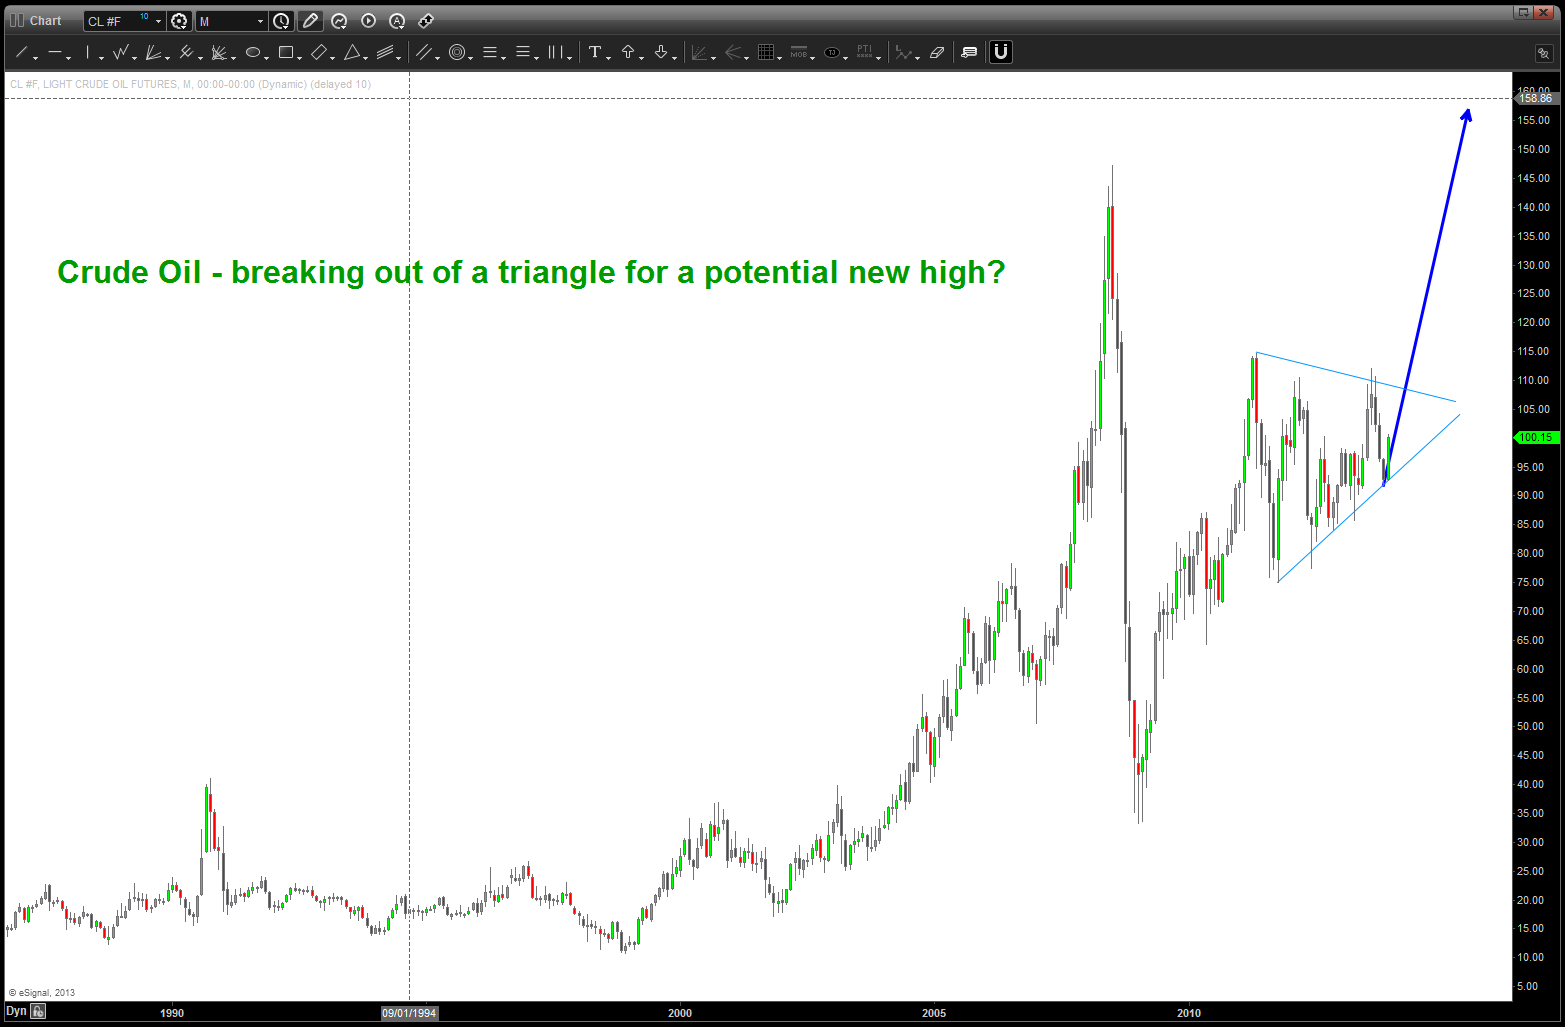
Crude Oil
USD vs CAD: just a little bit higher (200 pips) we have some pretty major targets. while I am a DOLLAR BULL, also recognize that the Loonie is a small percentage of the overall index. LOONIE BULLISH (after a little more weakness)
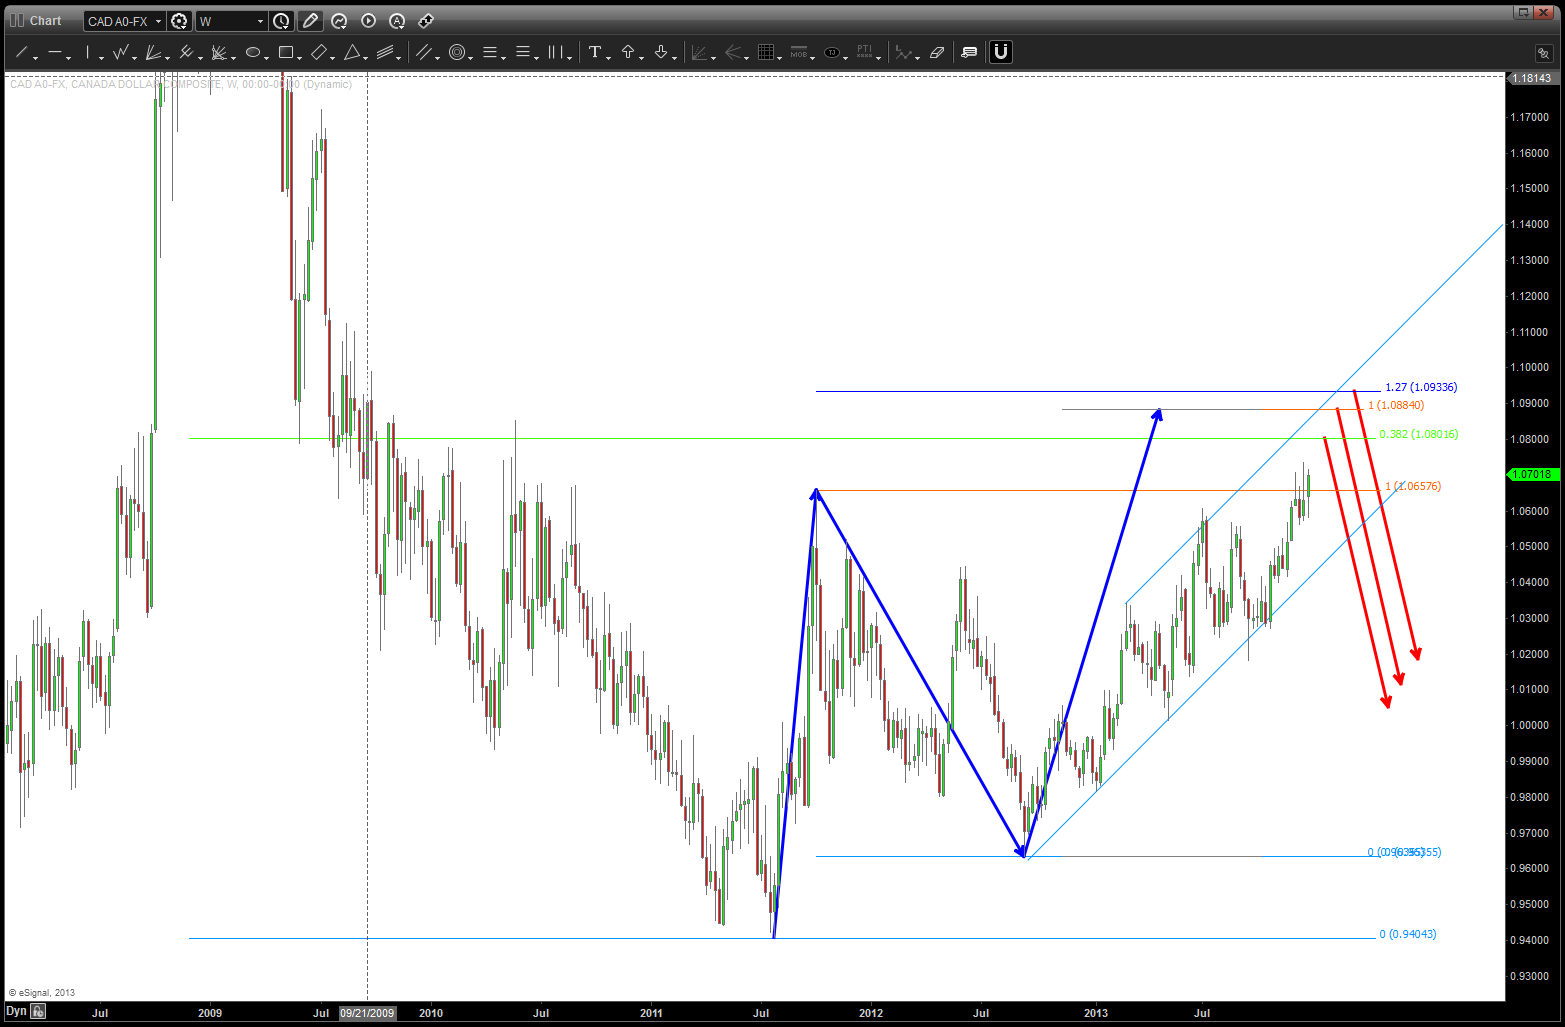
CAD vs USD
Oil Services Index: the only thing “wrong” w/ this chart is that, a RULE of counting is 4 cannot go below 1. In this case it does, However, the Crude chart spikes thru but never closes below. so, I am keeping this count. Note, we smacked right into the .618 price projection area at/around 294 and are testing it again. the 306-307 level will be key.
So, our roadmap to follow is:
- Crude – breakout of triangle.
- Loonie – BUY a couple hundred pips lower
- Oil Services – break thru – with strength and conviction (read volume) levels show
one last, this is something to be patient w/ …. I would not recommend jumping all over this tomorrow but wait and see these levels get attacked … the GREAT thing about PATTERNS is we now have clear lines in the sand for where we are correct or wrong. Go back to the beginning of the post – w/ that divergence between the OSX and CAD-Crude the patterns will tell us which way this entire family (Crude, OSX, CAD) will resolve. It very well could go completely opposite but not until the pattern levels are targeted. they will either work or fail and then we’ll pounce
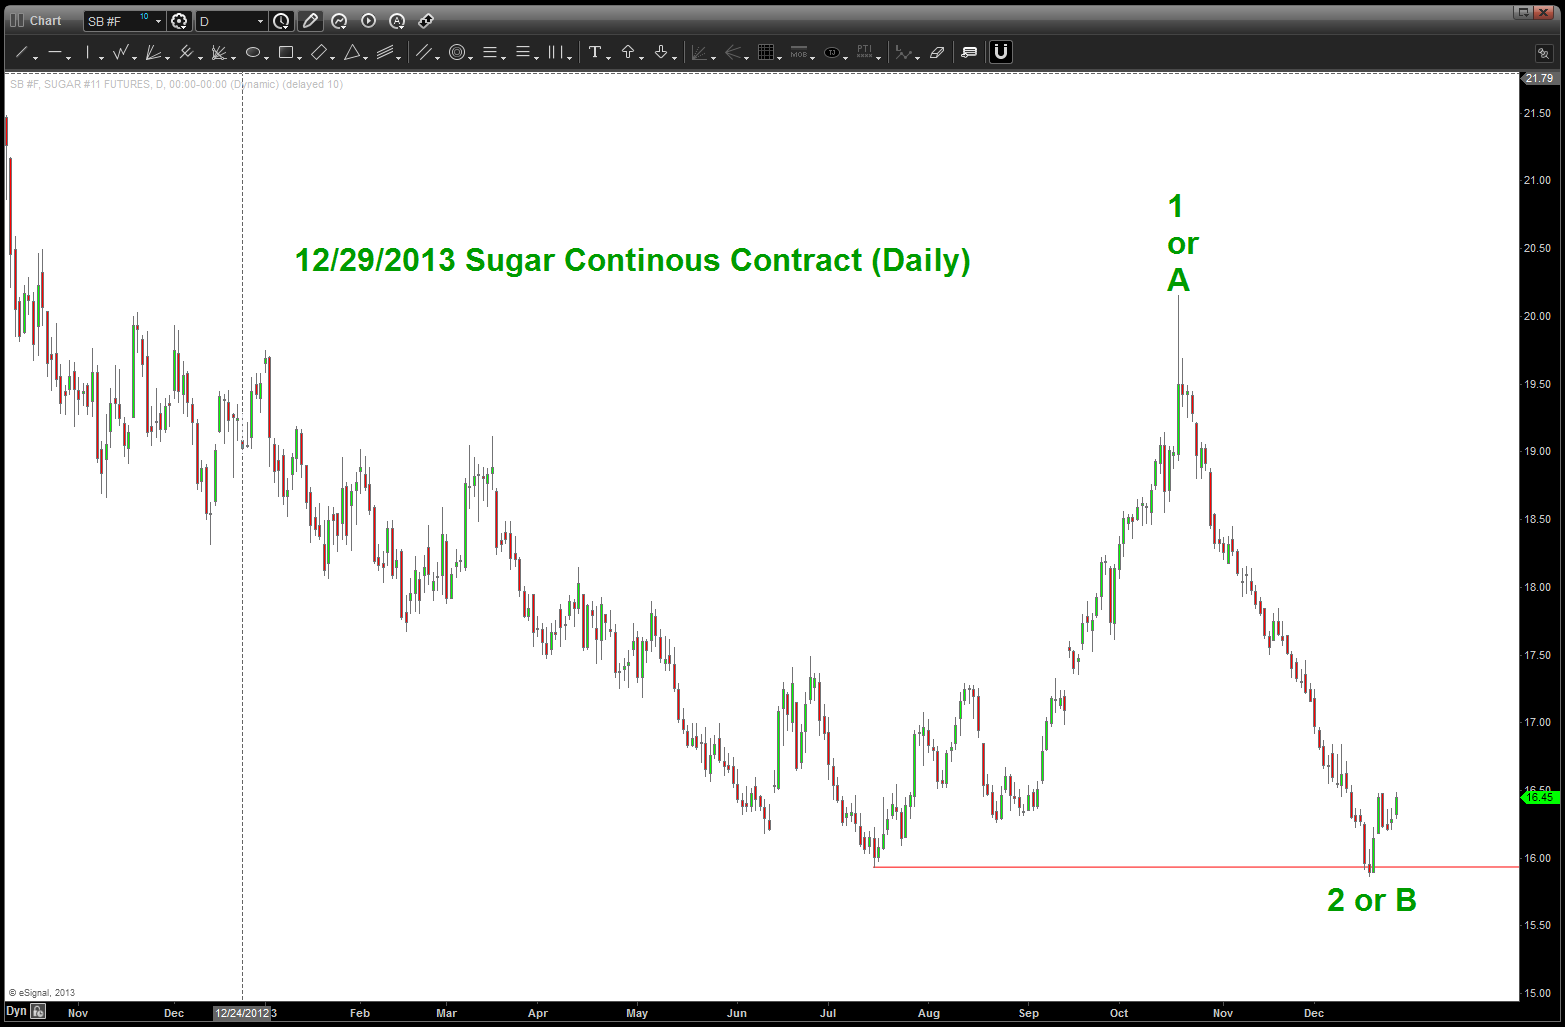
Sugar Update
Posted on December 29, 2013 Leave a Comment
here’s the last post on Sugar:
https://bartscharts.com/2013/09/13/buy-your-fruit-loops-now-here-comes-the-sugar-train/
as you can see below, the level held extremely nicely but after peaking in Mid-Oct, the bid was crushed. IF this level is a significant low, then we shouldn’t go below 16 again. either way, a potential label is shown. the characteristics of wave 2 are that the general traders feel the bear trend is in fact (it could be) and it can retrace all of the first wave up ….so, that is why 16 is so crucial. If we lose 16 then back to the drawing board …
the bearish interpretation is the area labeled 1 or A is actually the completion of the corrective move and we will lose 16. not sure if that is the case because of the long term pattern that was hit back in July.
stay tuned …
Sugar Update
