the joys of the puzzle …
Posted on October 18, 2013 2 Comments
a couple days ago I posted about the US Dollar missing my lower target and the potentiality of a bottom and even saw a “nice” inverse head and shoulders that IF it broke thru would be a bullish signal. it didn’t and, now, looks like my lower target is going to be attacked. quite frankly, I’m glad … for over 2.5 months i have steadfastly WAITED and deployed NO CAPITAL. Always, thinking, “I missed it” or “why the heck did it do that” or any number of ugly “little voices” that appear. my mentors have banged into my thick head to ONLY invest at PRECISE levels because then and only then can we manage the risk. I’ve taken that to the extreme and, quite frankly, it’s my Achilles’s heal from an PM perspective. making no apologies. I think the tendency to try and “nats ass” levels is based on the HOURS upon HOURS that I spent in the Navy precisely aligning attack vectors for putting a 2000 lb pound in the center of a window from 35,000 ft at 1.2 IMN. old habits are hard to break ….
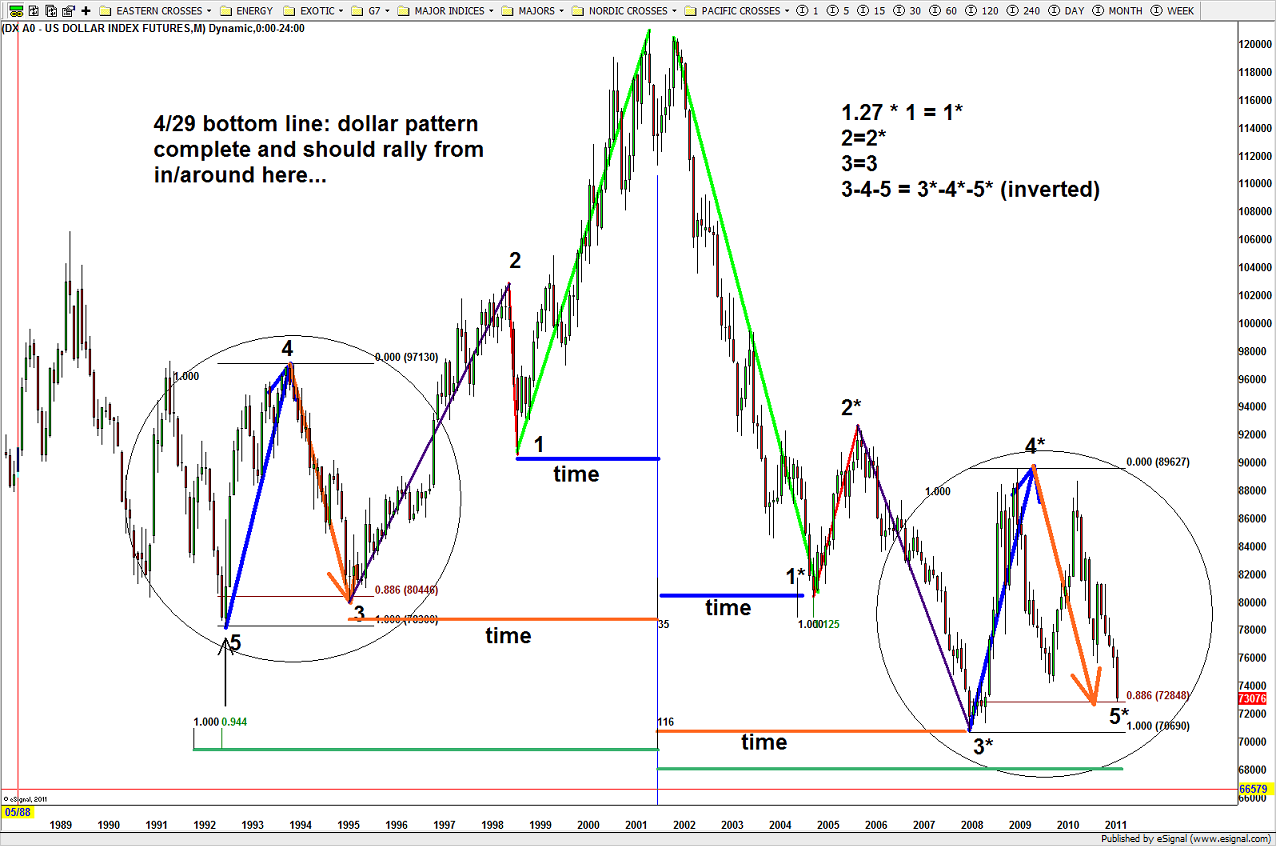
the other reason is because of a chart like below:
US Dollar Math and Geometry
if you take the time to STUDY the chart (and why not if your reading my post – thanks by the way) you’ll see the EXACT, again, EXACT measured moves at the low in 1992-1995 hit. so, in the context of WAITING 2.5 months for this opportunity to present itself, it’s really nothing in the context of 3 years. YES, there is and was a lot of money to be made day in and day out trading the swings. but you know what … I don’t like doing that. it doesn’t fit MY STYLE so I like to put the pieces of the puzzle together and deploy capital. So, this AM, let’s take a look at the pattern coming in on the US DOLLAR INDEX.
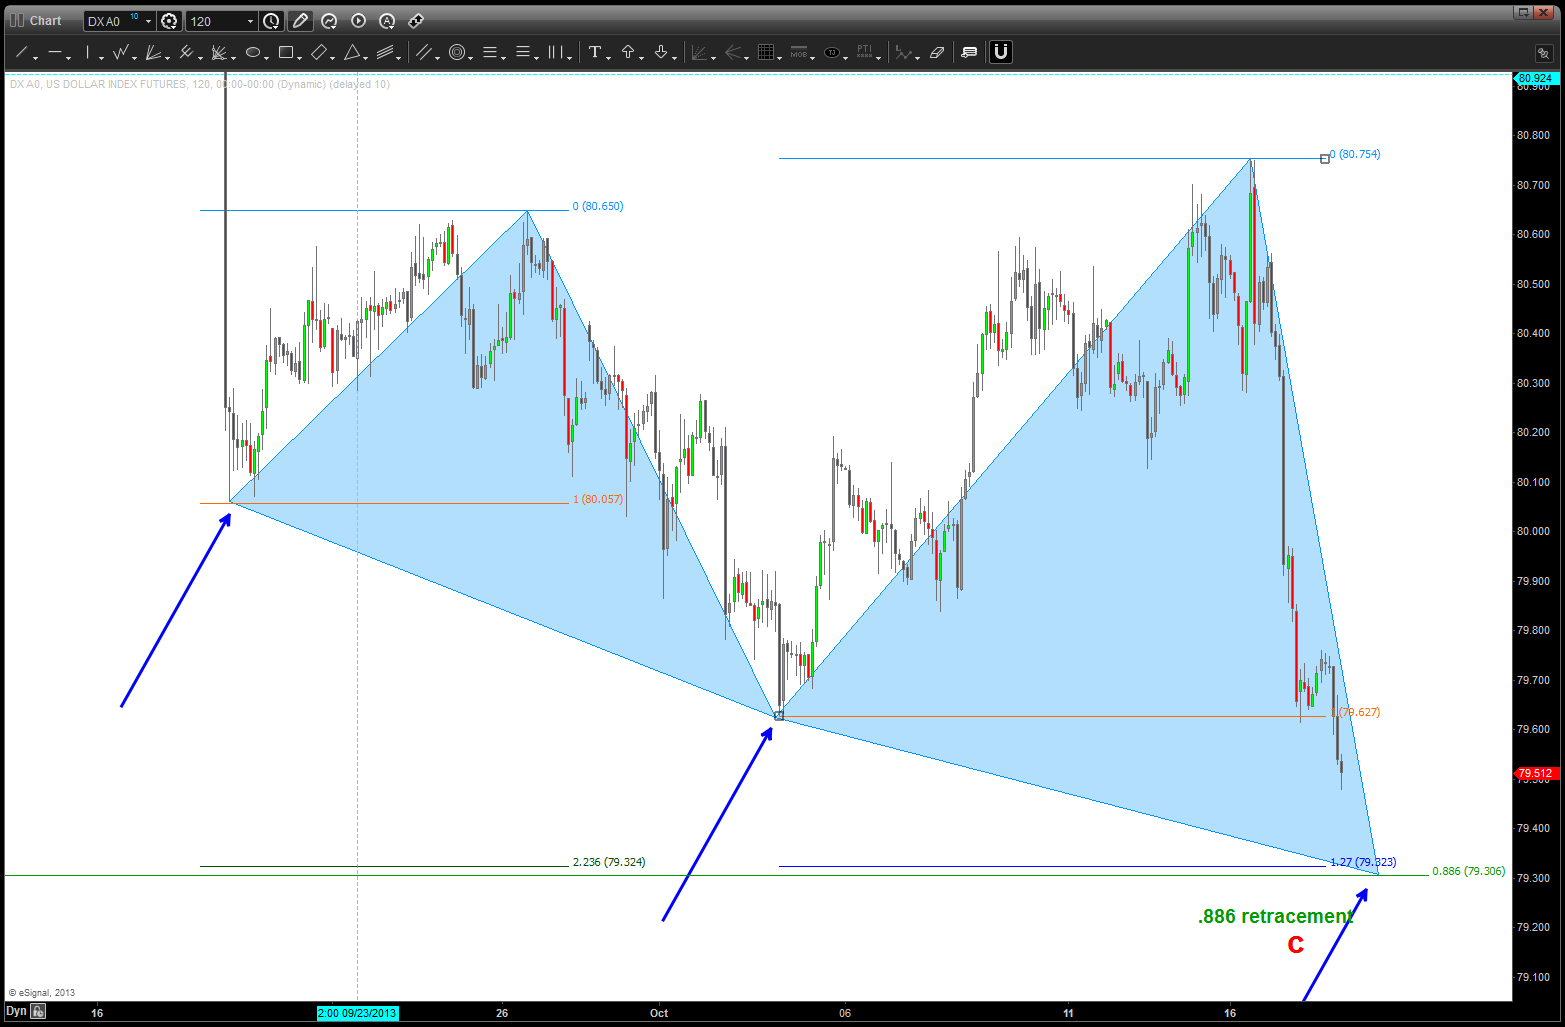
the key for me is the “measured move” correction like that of 05/2011. Bruce Buffer time … HERE WE GO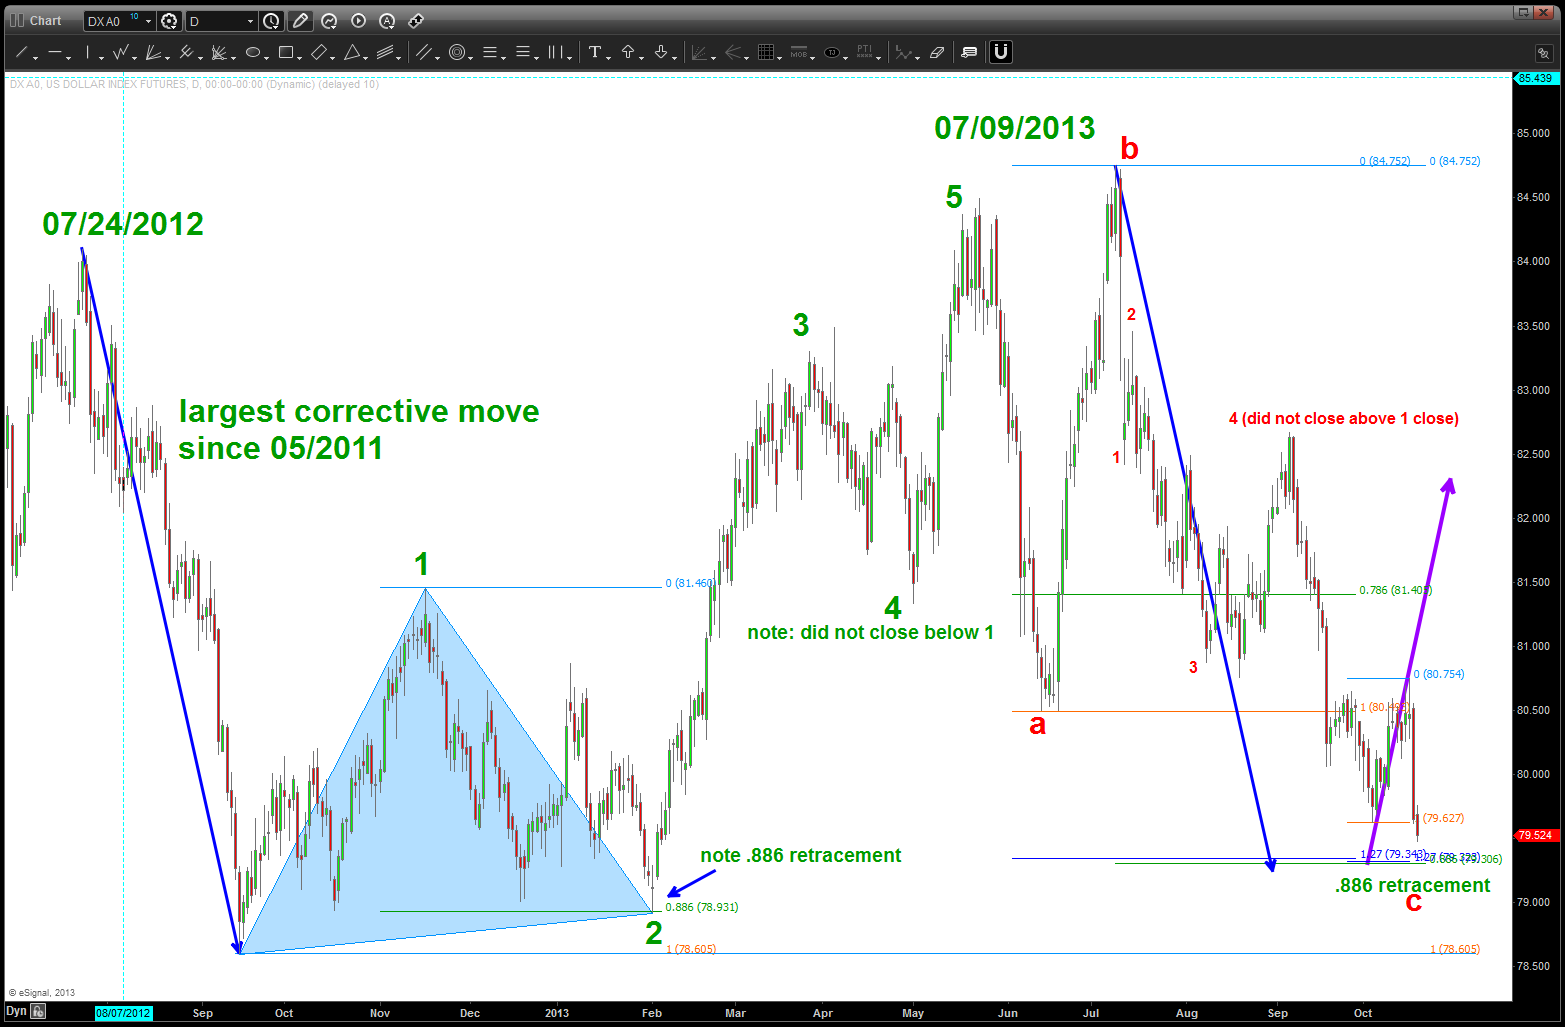
QUALCOM Confluence ….
Posted on October 16, 2013 Leave a Comment
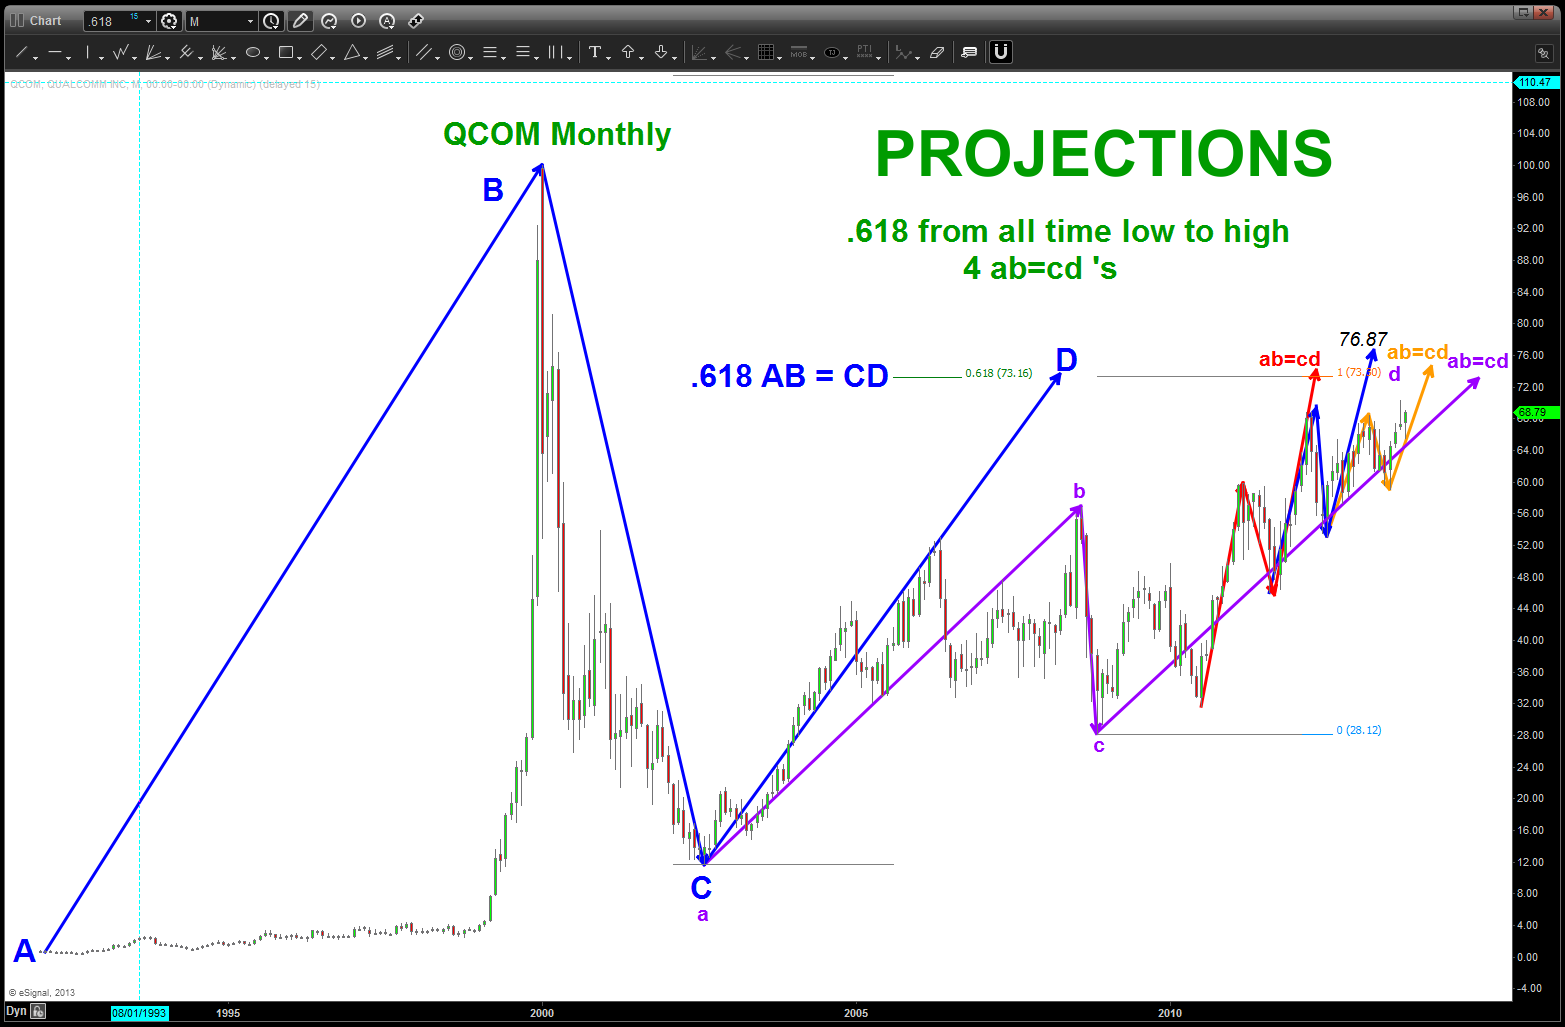
PROJECT then EXTEND then RETRACE …
for QCOM they are all coming together a little higher. Frankly, never seen this many ratio’s come together. Stay tuned BUT that’s all she wrote ….
projections (basic)
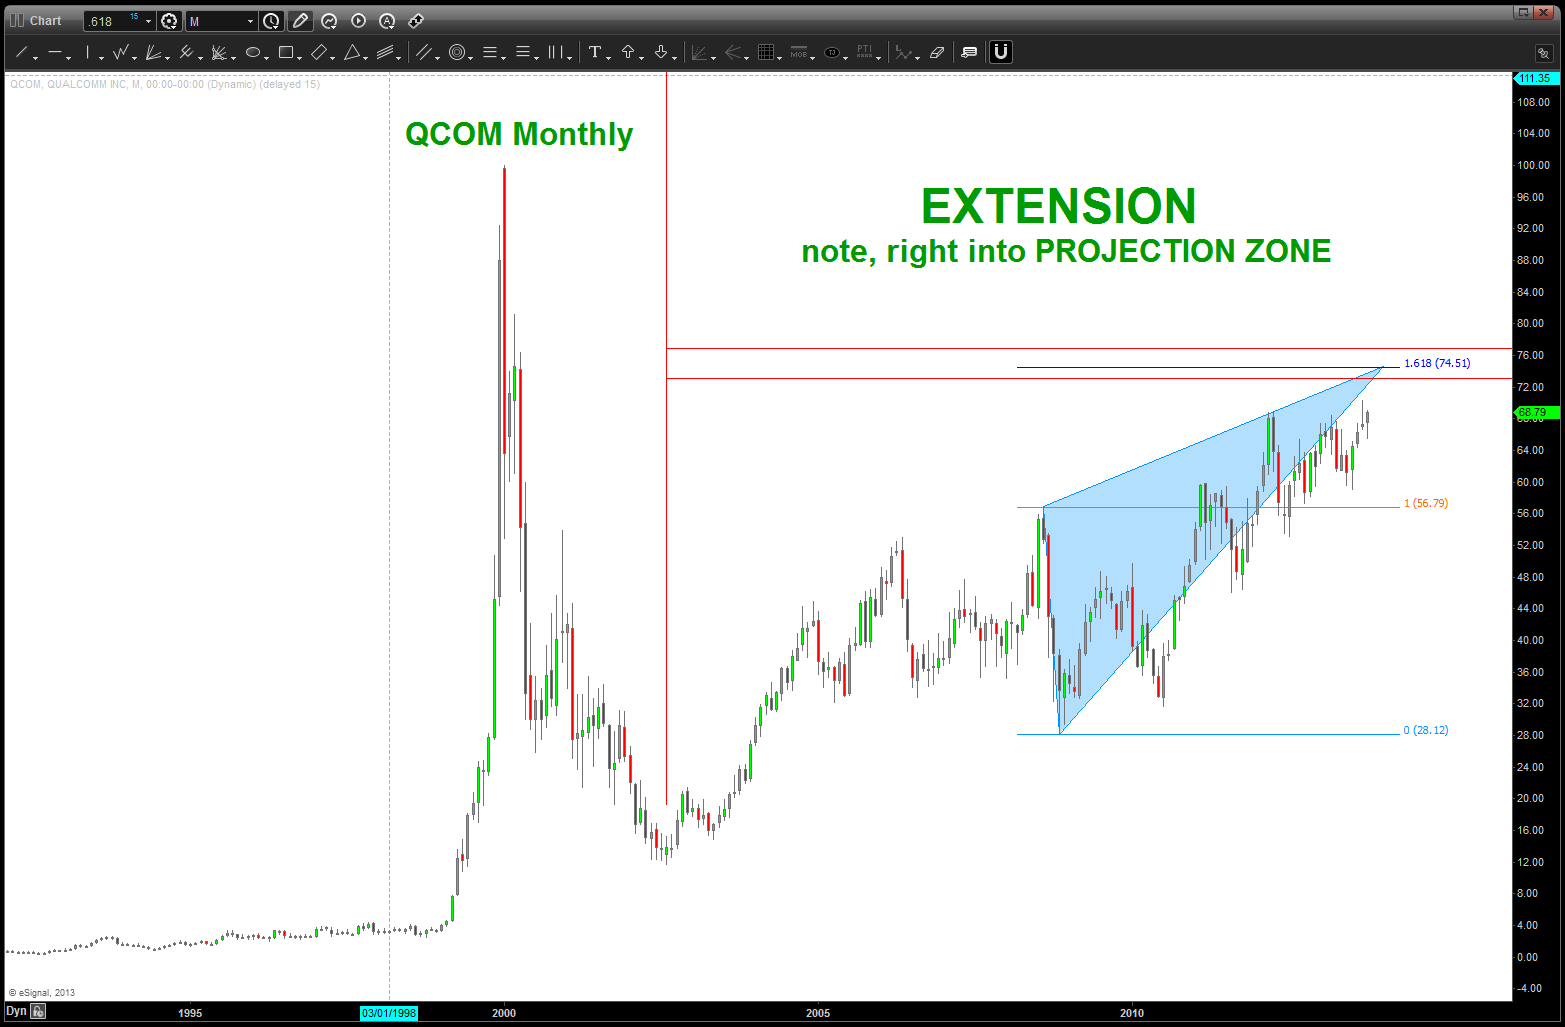
extension (basic)
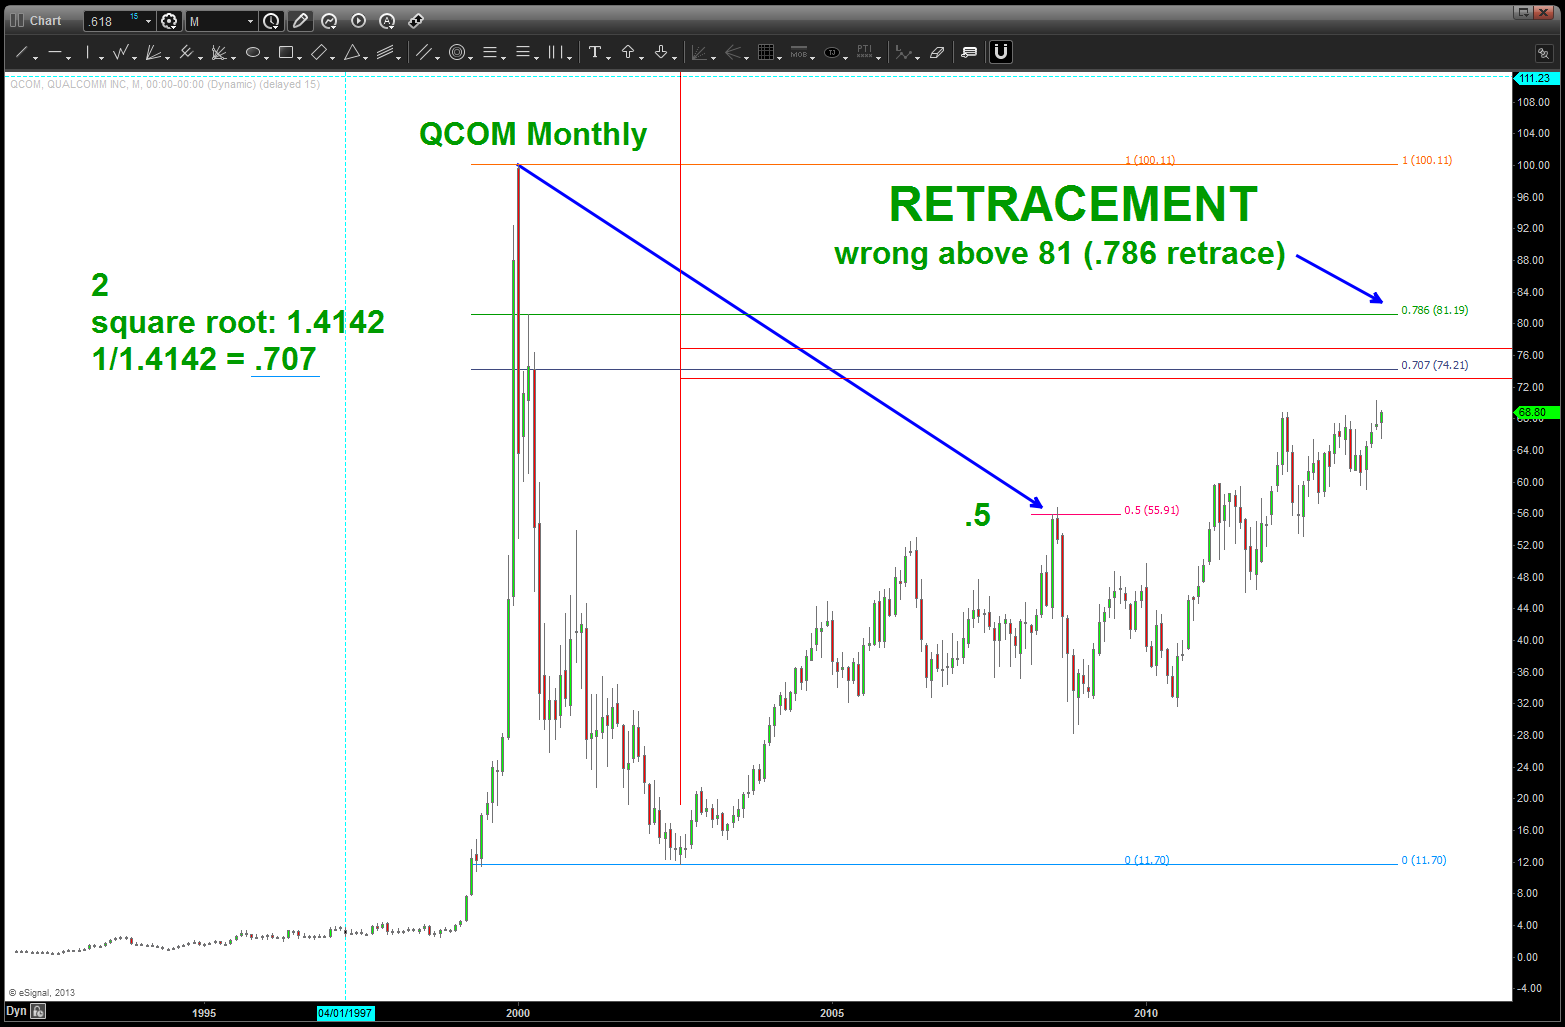
retracement (basic)
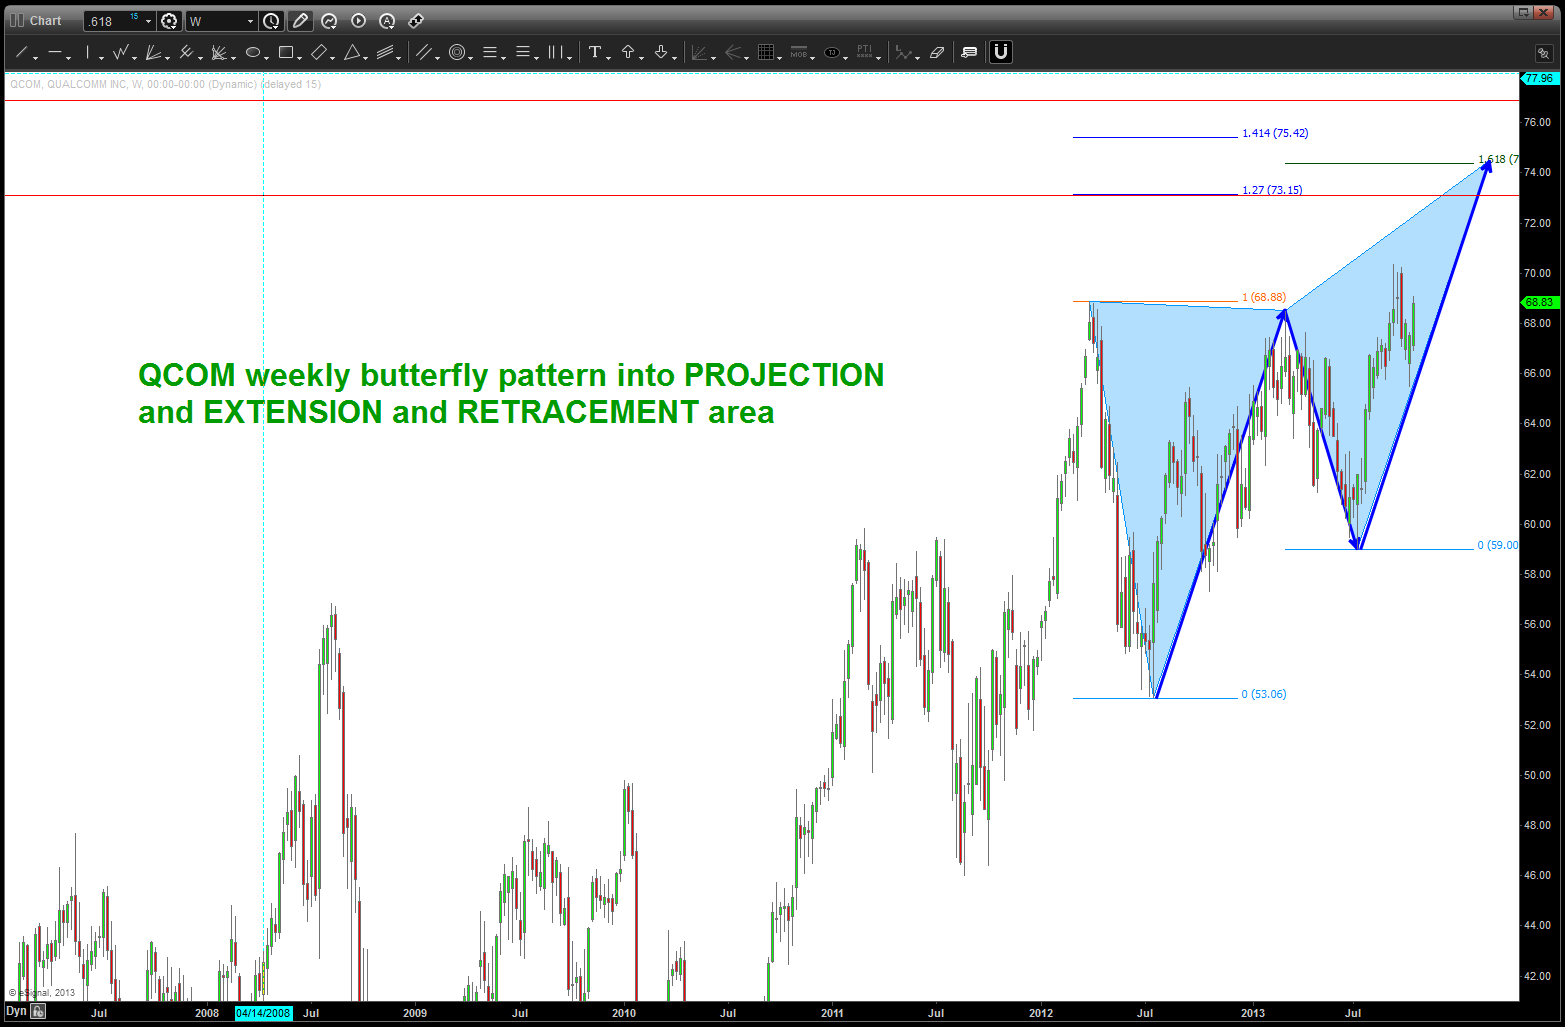
butterfly top (weekly)
the Shutdown and the US Dollar
Posted on October 15, 2013 Leave a Comment
my first post was almost two months ago and it concerned the US Dollar: https://bartscharts.com/wp-content/uploads/2013/08/august-20-2013-us-dollar.png and then it was updated: https://bartscharts.com/2013/10/01/dollar-index-done-or-correcting-or-a-little-lower/
we probed the lower level but never quite reached my area that I had been watching for two months as the place to attempt the long on the USD versus either the EURO or the POUND. this am, it is showing some pretty significant strength so this is in alignment w/ my analysis. now put the investment hat on and look for the best area to get long that will manage the risk. with the chaos in DC, this target a little lower could get hit on some surge/spike/rumor/ etc…we’ll just have to wait and see. lastly, look at the 4 hour inverse head and shoulders neckline that is being attacked. Sure looks like the dollar has bottomed …
this is BARTS CHARTS … if they go UP we have more buyers and if they go DOWN we have more sellers. Playing relaxing music and watching the chart instead of listening to the talking head pundits is just easier, don’t you think?
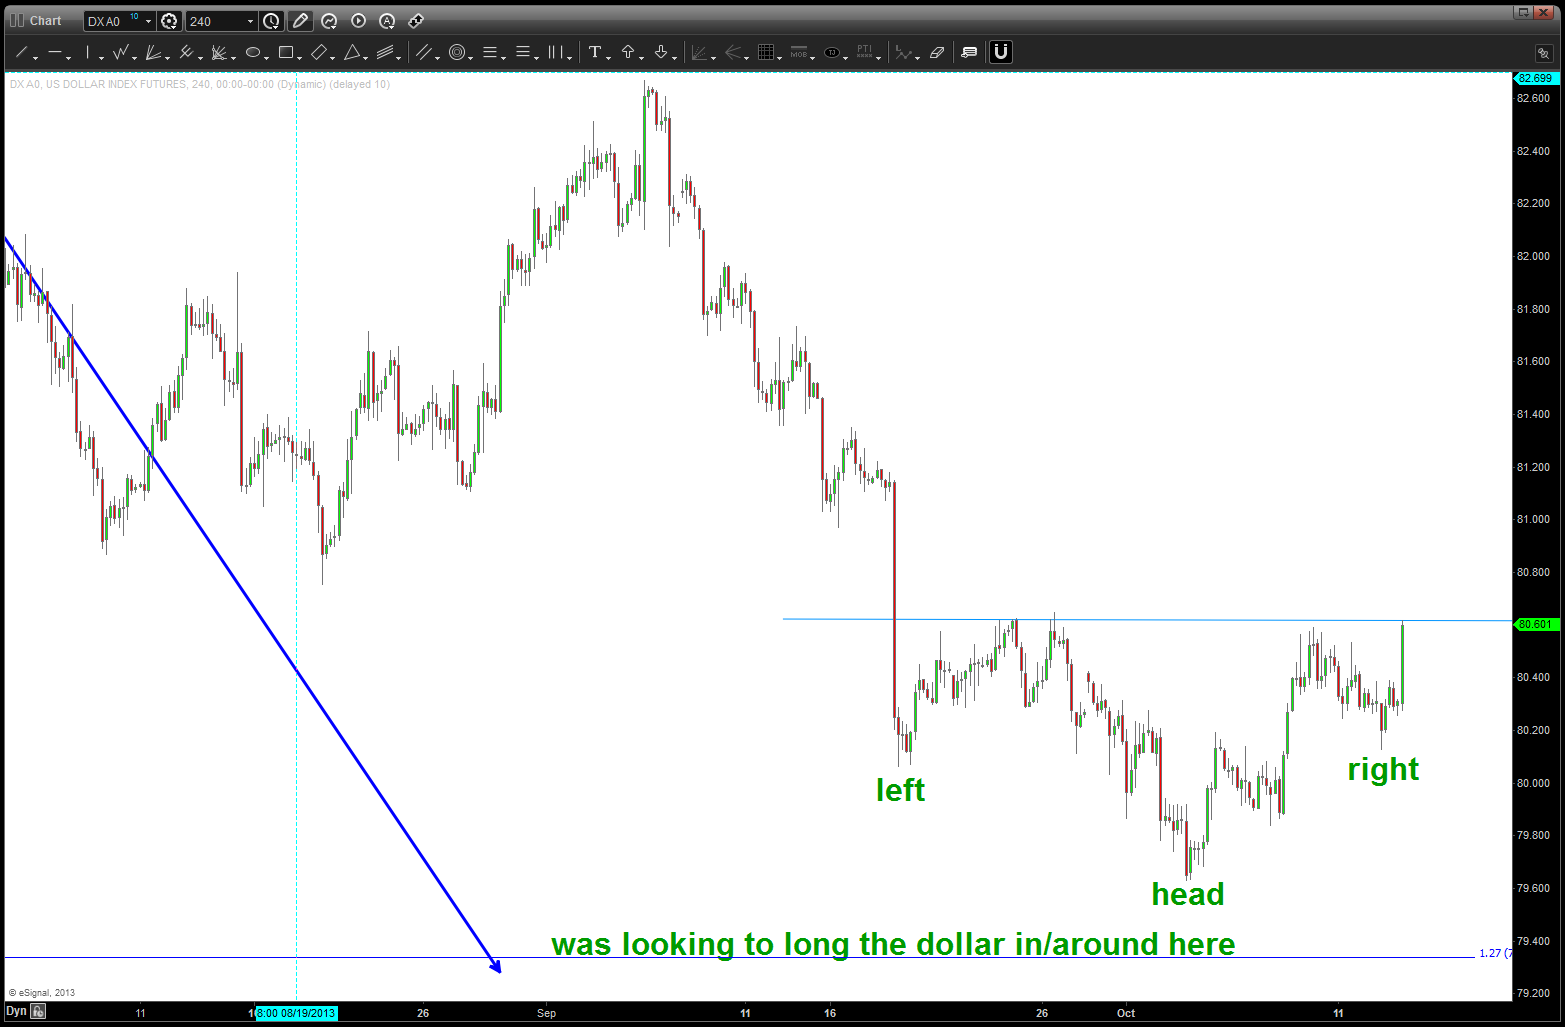
USD Inverse Head and Shoulders potential low in place
t easier, isn’t it?
Gold/Silver Index … continuing the thread
Posted on October 11, 2013 Leave a Comment
here’s the previous Gold/Silver Index posts:
https://bartscharts.com/2013/10/03/gold-silver-index-a-guide-for-the-yellow-brick-road/
so, as you can see the geometry is sure starting to unfold for a “double bottom” type of scenario and then, potentially, higher. If you read my Gold posts
https://bartscharts.com/2013/09/07/good-as-gold-part-1-of-2/
https://bartscharts.com/2013/09/08/good-as-gold-part-2-of-2/
then you’ll see how I’m looking for one more move lower on the Gold to set up a very nice buying opportunity. you’ll also see the reason why the levels approaching on the Gold/Silver Index are so key. Stay tuned on the Gold/Silver index because the level it found support in is KEY .. if we break that to the downside via a daily close below that level, then the index and Gold could certainly take a smash. stay tuned …
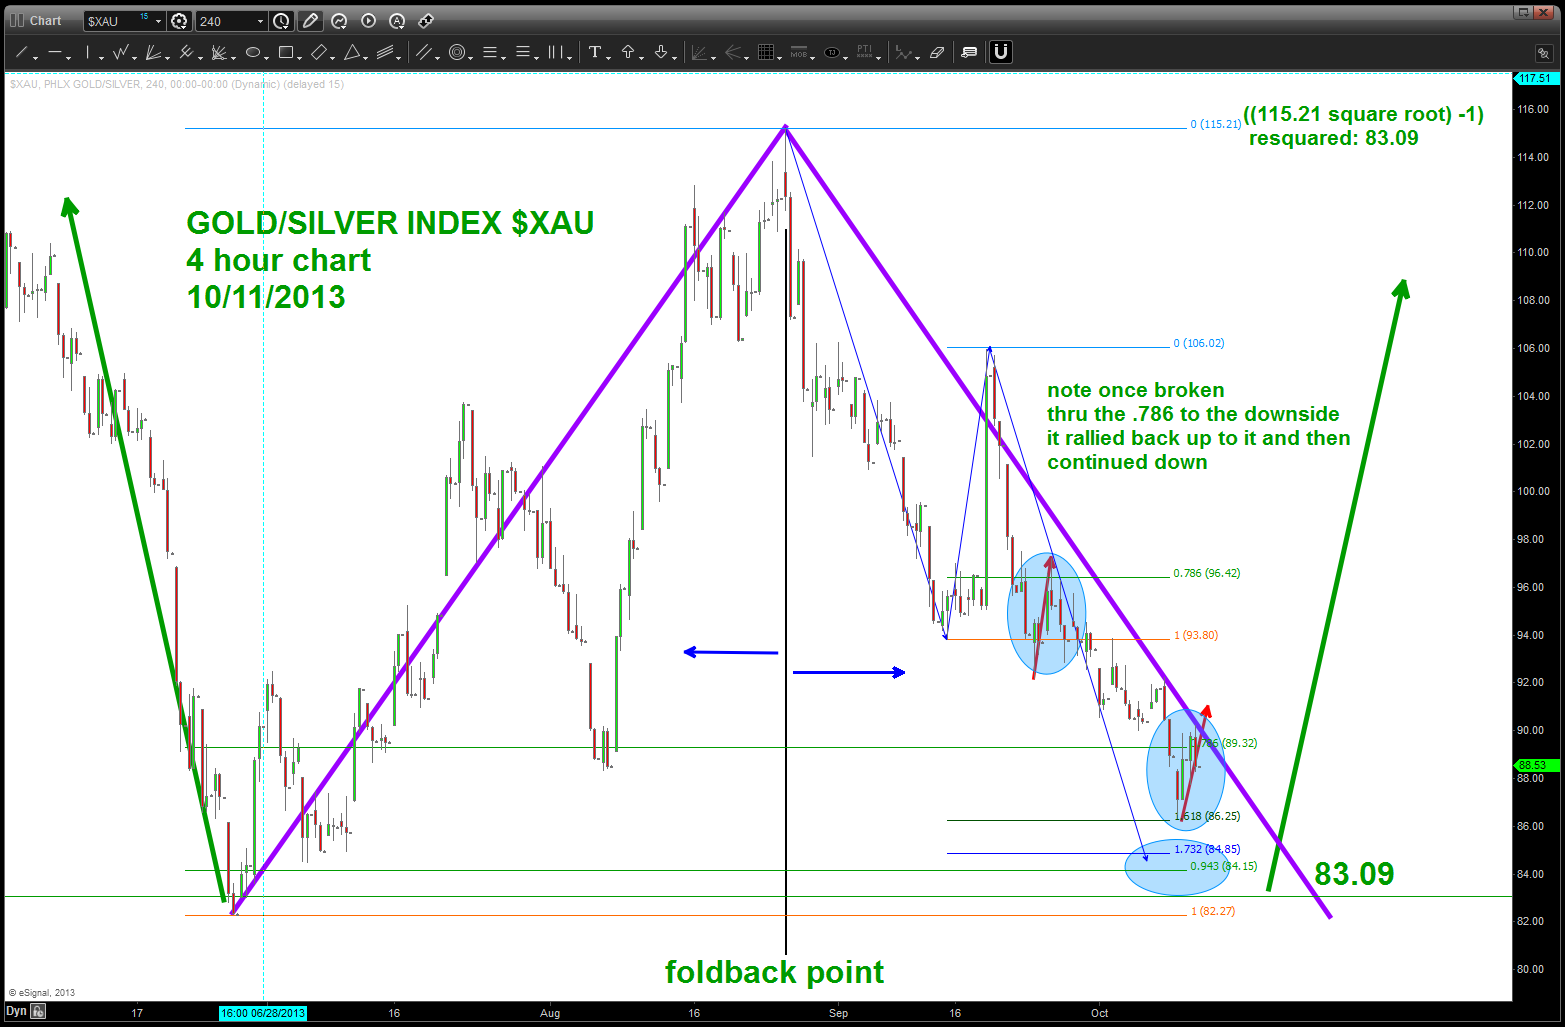
Gold Silver Index double bottom potential?
Japanese Yen Advance
Posted on October 10, 2013 1 Comment
I have been following this pattern closely … after an amazing move upward, we have been consolidating in what looks like a multi-month triangle. From a counting perspective it does fit the characteristics of a 4th wave so we’ll have to watch it closely for signs of the triangle being complete. At this point, right now, I don’t know. The symmetry of the ratio’s of the legs is “close” to the rules (they are supposed to be .618 of each leg) and the most latest low of yesterday finished a very nice buy pattern. For now I will sit on my hands … but the move is coming for weakness of the JPY versus the USD.

long term count

daily chart of triangle ratio’s and potentiality

other targets

pattern complete

60 min chart as of 0400 10/10/2013 … pullback coming to buy (?)
Staples Strength vs the S&P
Posted on October 7, 2013 1 Comment
if you wan to catch up I recommend reading the following two posts:
https://bartscharts.com/2013/09/22/the-upcoming-week-of-922-for-the-sp/
https://bartscharts.com/2013/09/25/the-ratio-of-staples-to-the-sp-xlp-spx-trust-me-its-important/
this AM, our pattern that we have been following has completed. what does that mean? the pattern either works or it doesn’t … if it works then our thesis is that the staples (as a sector of the overall market) will start to outperform on a relative strength basis (no not the oscillator) the general market. when this has occurred in the past, it has very nicely timed inflections points to the down side in the market ….


Long term monthly w/ bullish stair steps present
stay tuned … the symmetry of the BUY pattern in PRICE and TIME is very powerful that this level should hold.
the WMT greeter and inflection points
Posted on October 6, 2013 1 Comment
ratio analysis compares the relative strength of one security versus another. if the numerator is stronger then the ratio will go up and vice versa. what I try to look for are meaningful ratio’s that plot fear and greed and can warn us of potential inflection points in the market.
I am going to make an assumption that “everyone” loves Walmart ($WMT) and it’s place as a fabled American institution is a fact. Our thesis today is during BULL markets it will “not be as strong” as the overall market (the ratio of WMT/SPX will go DOWN) and during times of fear or volatility it will “be stronger” than the overall market (the ratio of WMT/SPX will go UP).
the chart below does a pretty good job of showing this assumption is valid.
the blue line is the SPX. the candles are the ratio of WMT/SPX. the dashed purple vertical lines are placed on the chart to show the inflection points at tops and bottoms.
note, in 2000 (high), 2003 (low), 2007 (high), 2009 (low) the ratio has 1) moved w/ almost the same velocity and 2) inflected almost exactly inverse as the S&P. HOWEVER from 04/2011-08/2012 the ratio actually trended with the overall market. (this is denoted by the blue arrow going up during this time frame) then, the ratio “went back to normal” and started going back down and the market continued up. an interesting divergence,,,,
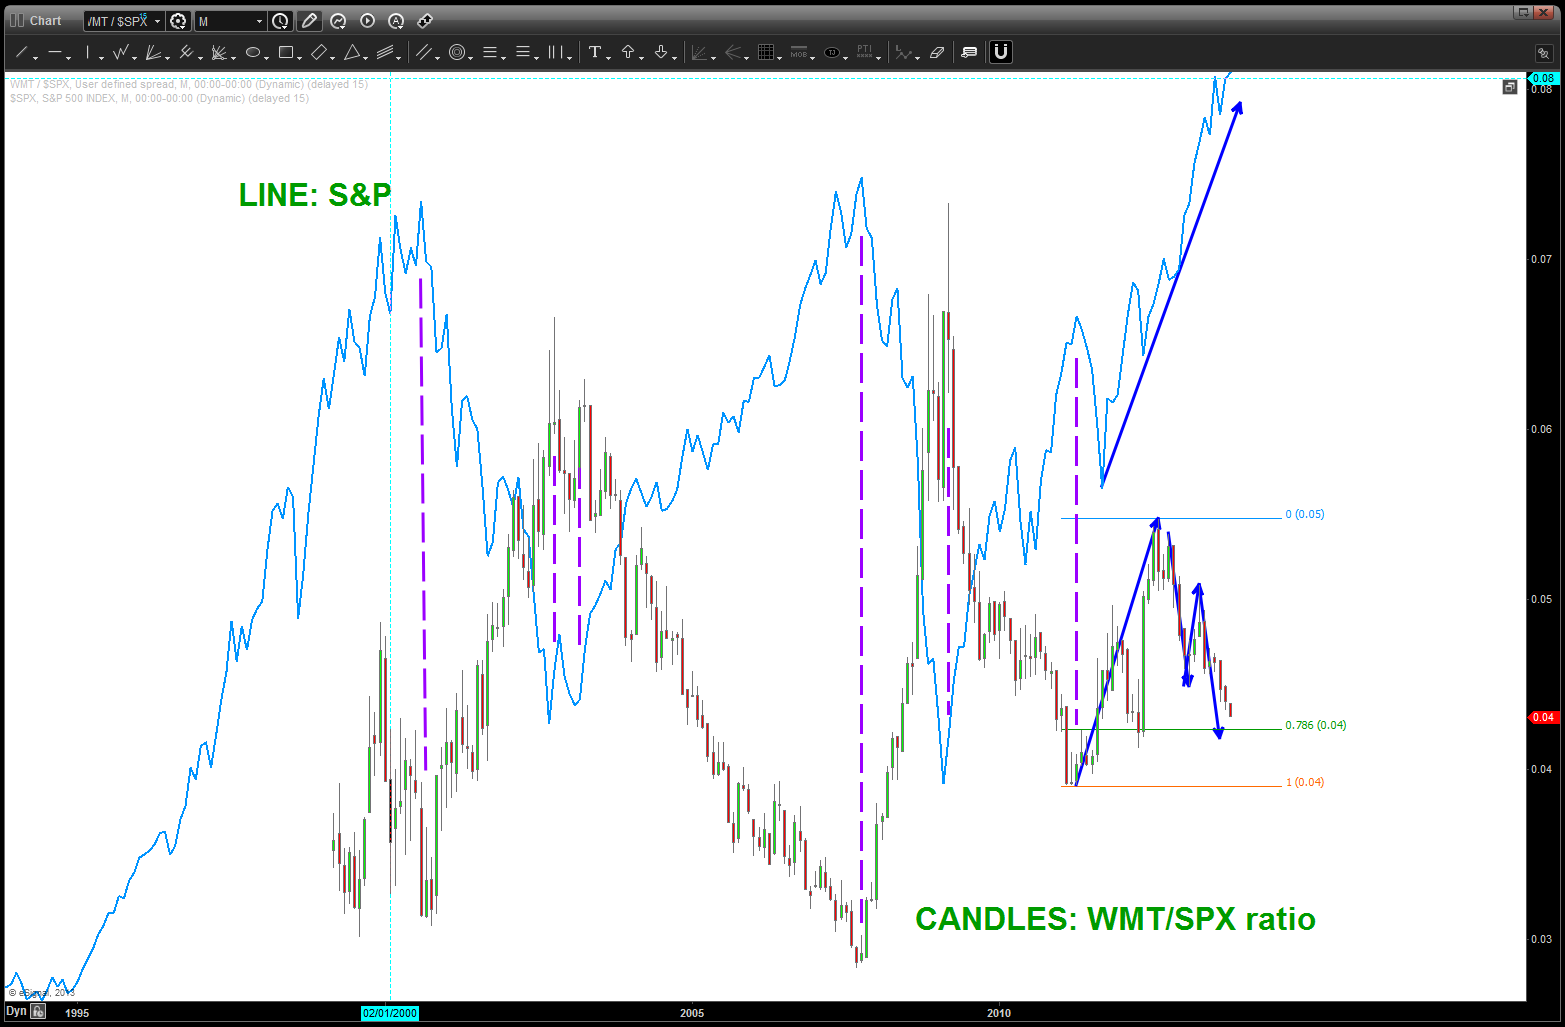
ratio of WMT/SPX compared to the SPX
the power of pattern recognition is it works on everything. so, we can look for patterns w/in this ratio to show potential inflections and then wrap it into an overall look at different sectors w/in the SPX to make a reasonable guess at moves to come. also, the longer the time frame of the chart, the more powerful the potential pattern becomes.
the chart below shows a clear 5 wave move ending and a pattern to be completing just a little lower. this signals that IF (the big IF) the pattern holds and the ratio finds support and begins to move UP then we “should” see a corresponding move down in the overall market.
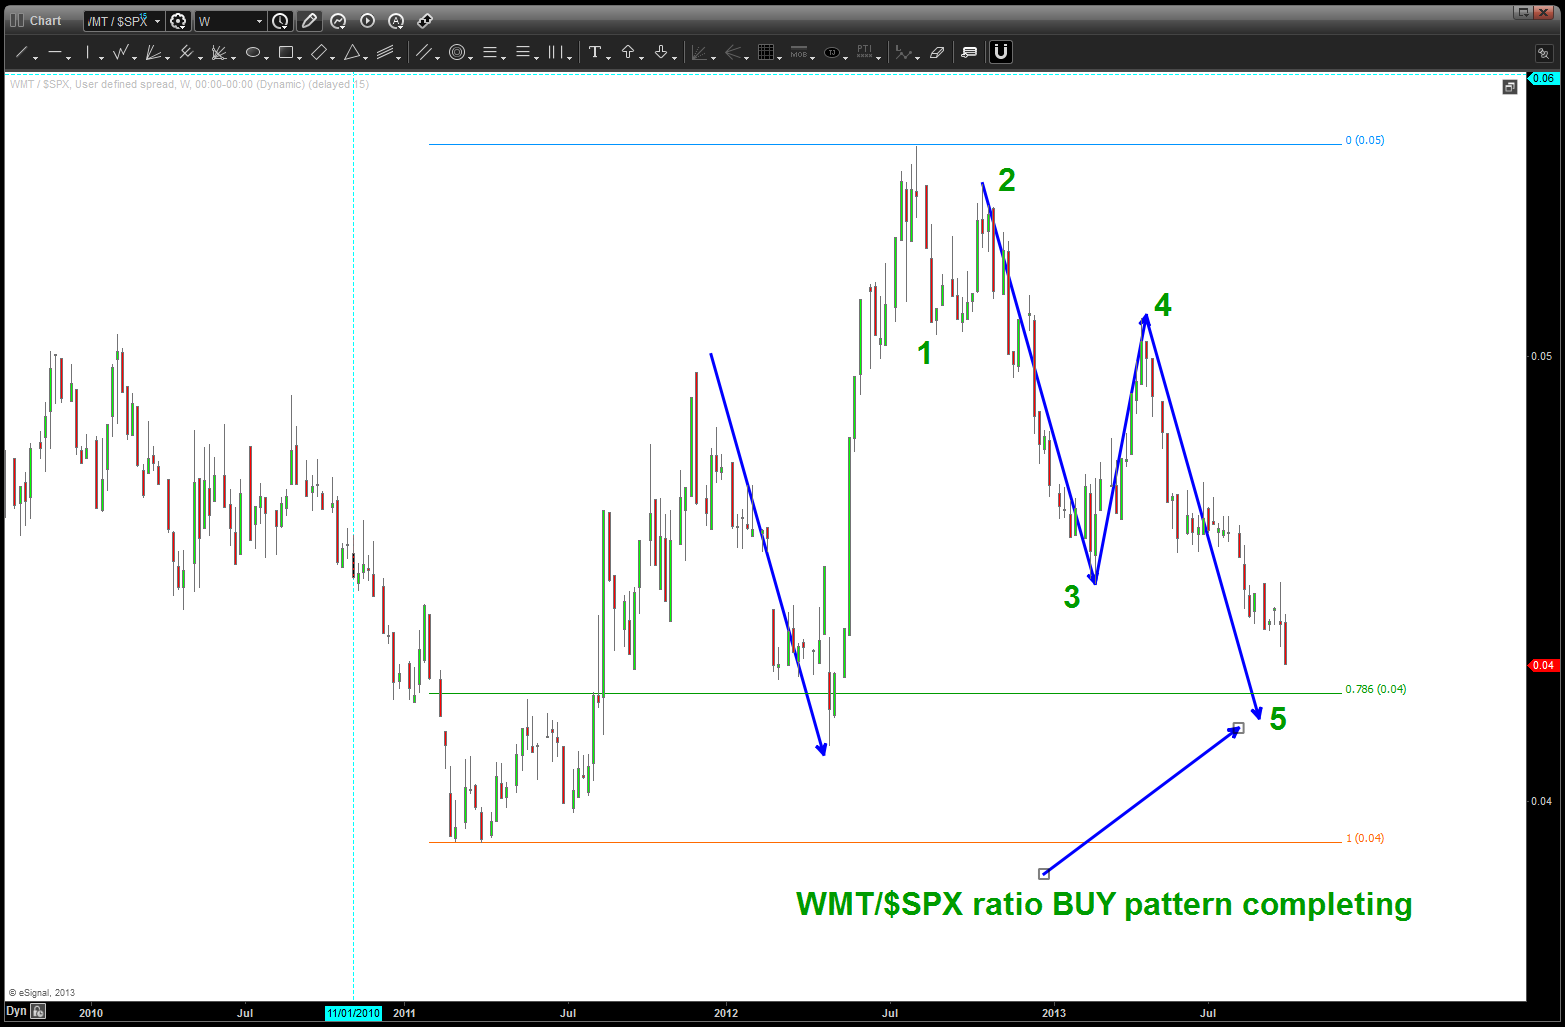
buy pattern coming into play a little lower
stay tuned and say hi to the next greeter you see and also tell them thanks for the market information!
Bart
Gold Silver Index – a guide for the yellow brick road?
Posted on October 3, 2013 1 Comment
To catch up to speed please view the following posts:
https://bartscharts.com/2013/09/07/good-as-gold-part-1-of-2/
https://bartscharts.com/2013/09/08/good-as-gold-part-2-of-2/
the gold silver index is correcting (or continuing lower) to very important levels – 88.69-89.36 or 86 or 84.21. We never know which level is going to hold or not … that being said, our continued outlook is to be bearish the metals from the perspective of Silver and Gold. I am still holding out for one more leg down …
watch these levels on the gold silver index as if they are taking out, then we have a good idea (probably) that Gold and Silver will also move to our long standing lower targets.
keep your powder dry …
Bart

Gold Silver Index approaching very KEY levels
Dollar Index done OR correcting or a little lower?
Posted on October 1, 2013 1 Comment
to get up to speed you can view my first post on the importance of the dollar: https://bartscharts.com/2013/08/20/the-usd-index/
so … if you have been reading/following I’m trying to get short the POUND or the EURO vs the Dollar. The dollar is a huge deal and w/ the EURO making up 60% of the index, it’s good to monitor. The POUND will shuck and jive but it only makes up around 11% of the index so you can’t be EXACT w/ it. The other major component is the JPY YEN at 14%.
metals and oil got hit — but note the strength of the “Oil Services Index” (that’s probably where the BUY program is running as there isn’t really any buying going on …)
so, looking for that low in the dollar to be carved out HERE or a little lower ….
stay tuned and keep your powder dry …

3 major patterns into a daily .786 retracement

IMPORTANT SELL PATTERN on the dollar .. if this holds it will open lower target IF it fails then good case for a dollar low (?)

big picture of the Dollar
TSLA, Patterns and dogfighting an F-14 in afterburner (check fuel!)
Posted on October 1, 2013 Leave a Comment
when there are more BUYERS the stock goes UP when there are more SELLERS the stock goes down. PERIOD … notice I didn’t mention anything about anything else because, quite frankly, NOTHING else matters. It could be the smartest MBA in Finance or CFA or the geekiest CMT on the planet using all kinds of technical indicators to show divergence, bollinger band breakout, moving average indicator w/ RSI or blah f’ing blah …. just find your edge, believe in your edge and invest w/ your edge. in the end, we are playing cowboy and indians shooting mouse clicks at each other. put your cowboy hat on or your indian out fit and go at it …
I love this quote from the Bible Luke 12:7: “Indeed, the very hairs of your head are all numbered.”
why? well, on a chart that is all we have until we start bastardizing them w/ all kinds of useless lagging indicators. We have a NUMBER for PRICE and a NUMBER for TIME.
so, we have PEOPLE (machines) who are buying and PEOPLE (machines) who are selling. (Machines can’t help be affected by the greed of the person who coded it) those people are governed by EMOTION and EMOTIONS go UP and they go DOWN. So, IF (the big IF) EMOTIONS fuel a move and NUMBERS are graphically showing the move then we can put the two together and develop patterns that show EXTREMES in emotional behavior. this is the nature of parabolic moves.
“calling” or “picking” tops has proven to be tough if not impossible … HOWEVER finding areas of potential tops/bottoms helps and then a STRATEGY to potentially take advantage of the inflection is a gameplan. (see Sugar post for an example)
the Greeks knew it, the Egyptians knew it and it’s the old “yin yang” coming right at ya … EXPLOSIONS up and down lead to corresponding moves in the opposite direction. It’s proven time and time again … parabolic moves are followed by devastating corrective moves.
see this post: https://bartscharts.com/2013/08/20/sir-issac-newton-and-aapl-fell-from-the-tree/
Now to $TSLA … this thing isn’t parabolic, it’s a ROCKET SHIP…good on them, holy smokes and KABOOM this thing has gone into orbit. as a market musician coloring pictures and going to 3rd grade geometry. that scares me like anything else out there …
here are some potential targets, but this move is OVER and what’s another 10% in the intervening 50+% correction that will be forthcoming.
my first signal would be a MONTHLY signal reversal candle. NOTE IT HAS NEVER GIVEN ONE SO UNTIL YOU GET ONE KEEP RIDING THE ROCKET SHIP.
But, like fighting 1v1 in a high performance fighter the real threat becomes FUEL after a while. you can’t stay in after burner forever … you’ll run out of gas and flame out, just like this high flyer.

parabolic advances of the NAZZIE, Home Builders, Financials and Cyclicals

the rocket ship

working the geometry to find the gravity center

some targets and observations

FIGHTS ON — note his wings are back against an F-16 at the merge — not good!


