the ratio of STAPLES to the S&P ($XLP / $SPX) – trust me, it’s important
if you have the time, please read this post: http://allstarcharts.com/are-staples-the-key-to-this-market/ . You’ll note that I incorrectly saw a triangle and expected the market to roll over once the break out occurred. that analysis was wrong … however, the market went UP when the ratio went down — exactly like it’s used to. We are now approaching another pattern point here … the chart below shows how critical the time component has been w/ these corrective moves and also the beautiful BUY pattern we have approaching — If this pattern works then we should see the equities go down as this pattern works … if not, then the trend UP in equities will continue. To review, here is the pattern we are watching:
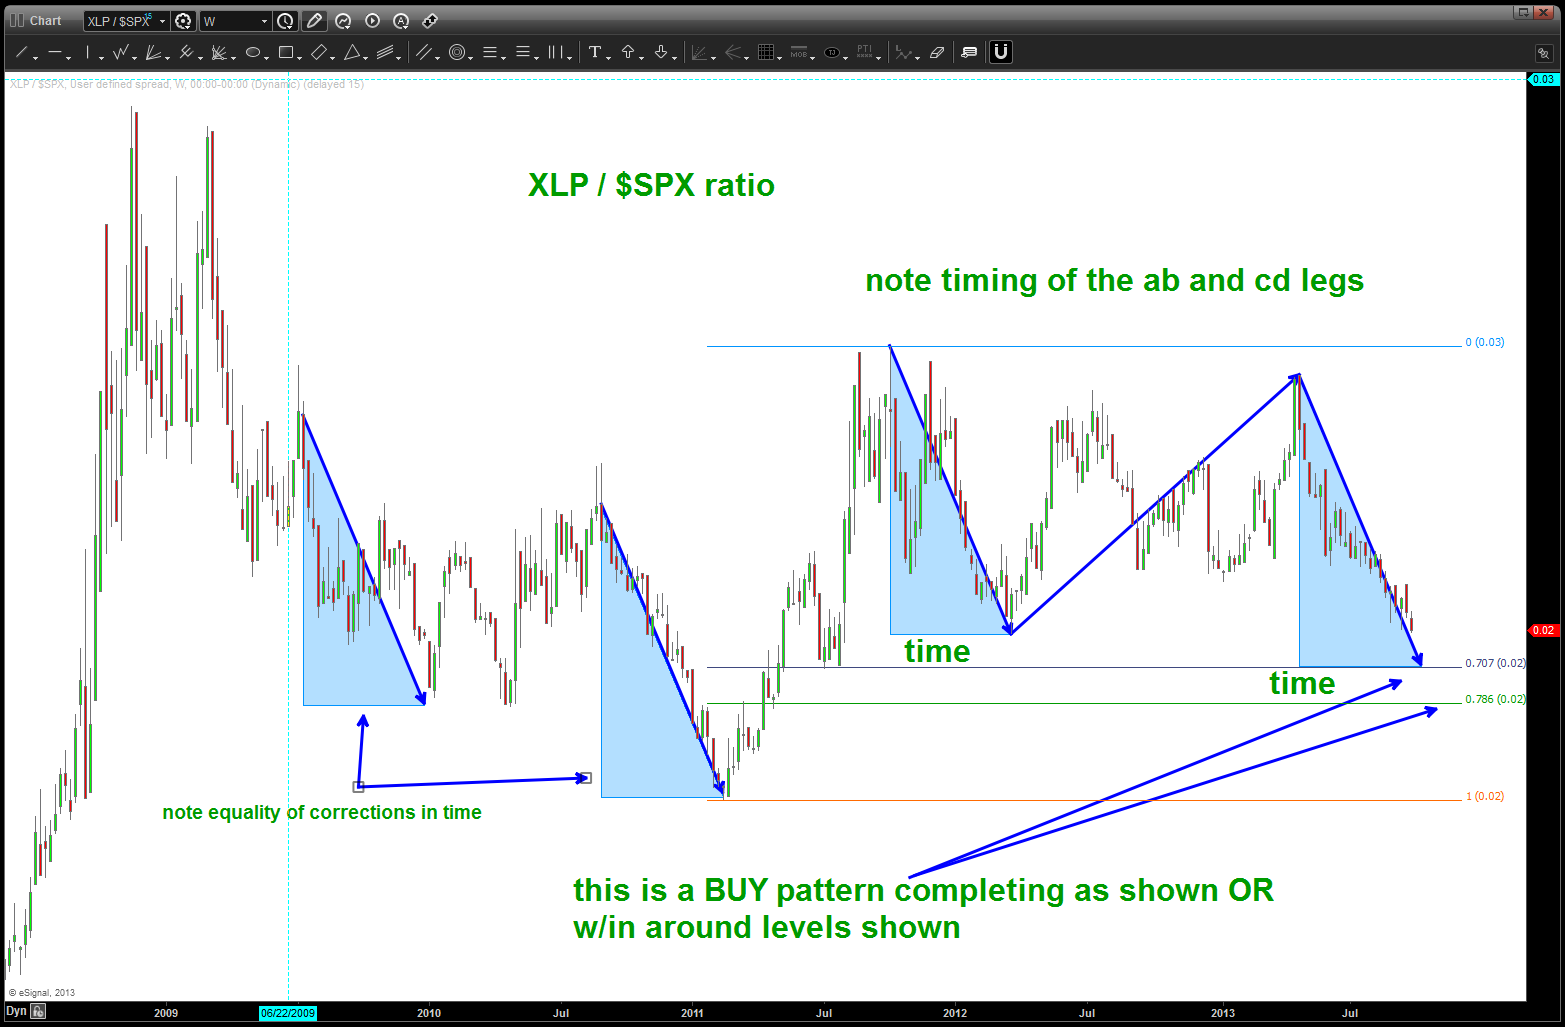
BUY pattern on the ratio
since a picture paints a thousand words and, quite frankly, I’m beat tonight I’ll SHOW you why this ratio has proven to be so accurate in the past. bottom line, every MAJOR MOVE since 2000 has been inverse to the move of this ratio. it’s almost EXACT ….I’m just going back to a weekly chart. see the above link for the monthly look.
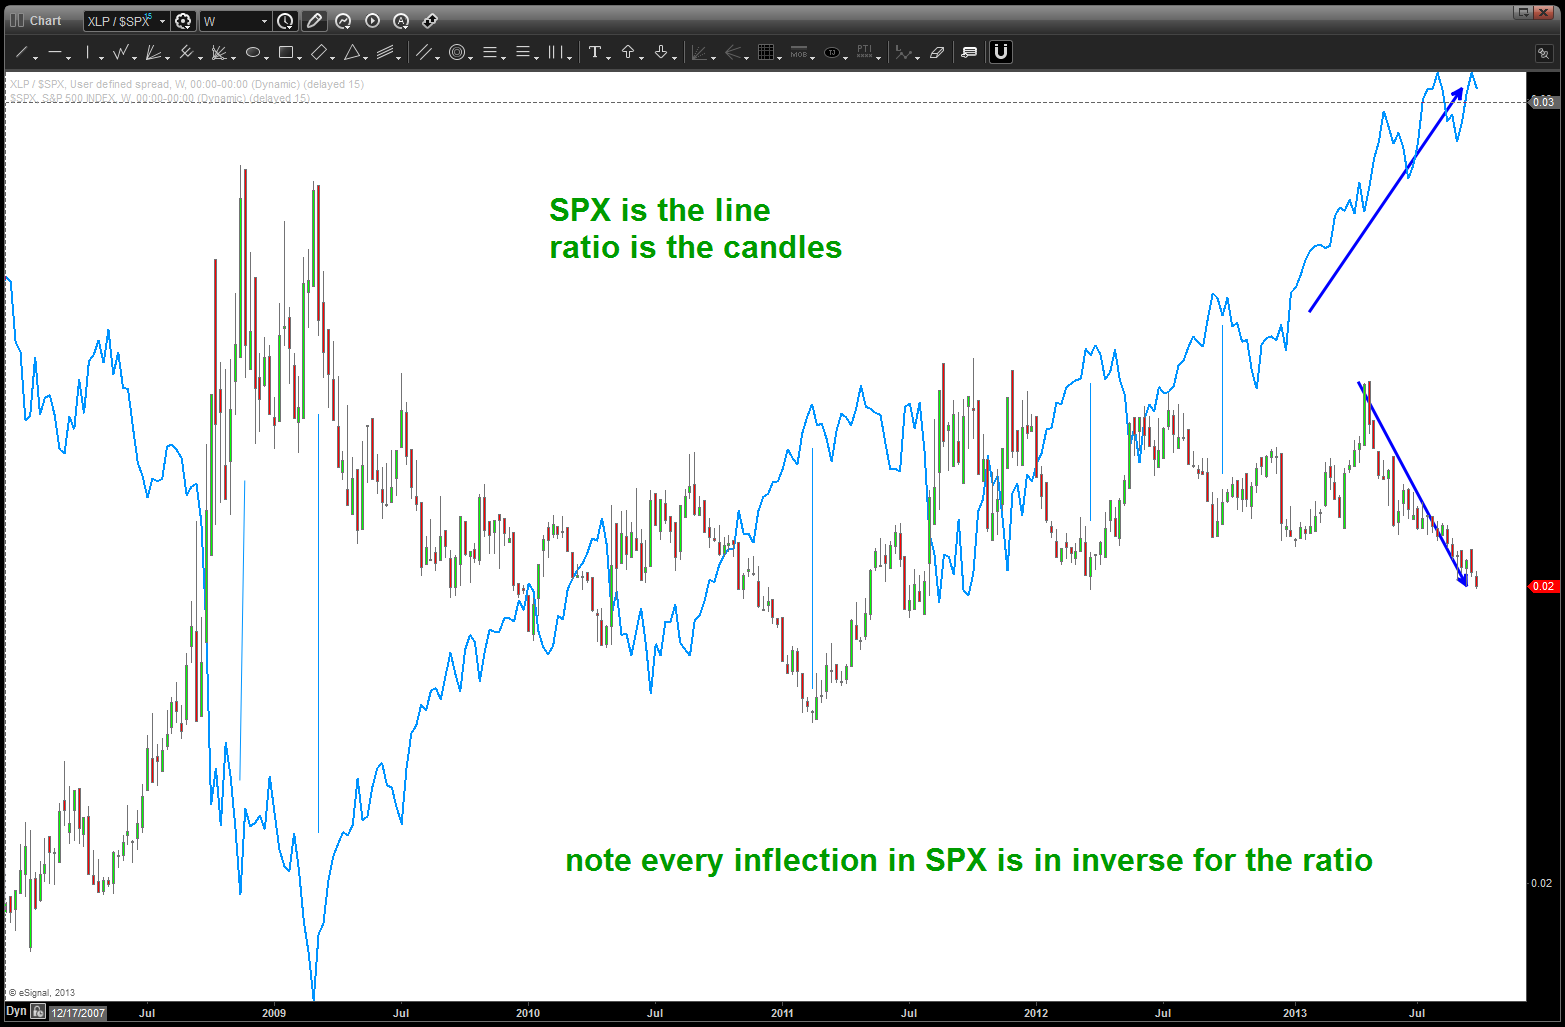
ratio w/ the SPX overlaid on top off it as the line
as a advanced pattern recognition trader dealing w/ probabilities I think this level on the ratio will tell us EXACTLY where we are …. stay tuned and monitor closely.
B

Pingback: Staples Strength vs the S&P | Bart's Charts