A look at the high flyers in 2014 – all lower significantly!
I am neither bearish nor bullish. I am a pattern recognition trader that puts everything into the context of human behavior. the rally from 2009 is so over stretched that 2014 will bring, potentially, a down side move of enormous proportions. There I have said it …simply based on the MONTHLY (read long term) SELL PATTERNS present this is going to be a THUMP. If the PATTERNS FAIL (which they do, obviously) then the band will play on … I just don’t see it happening and, quite frankly, i am alone in my thinking.
The bullishness present RIGHT NOW is the most extreme it’s been in the history of the stock market …do you want me to type it again? Here’s a look at the high flyers and, again, I think they will all be lower, significantly. Hope I’m wrong…
GOOG: note the same pattern and measured move that is present. Tried at/around 925 and got my clock cleaned. in prove it mode now … but sure looks done.
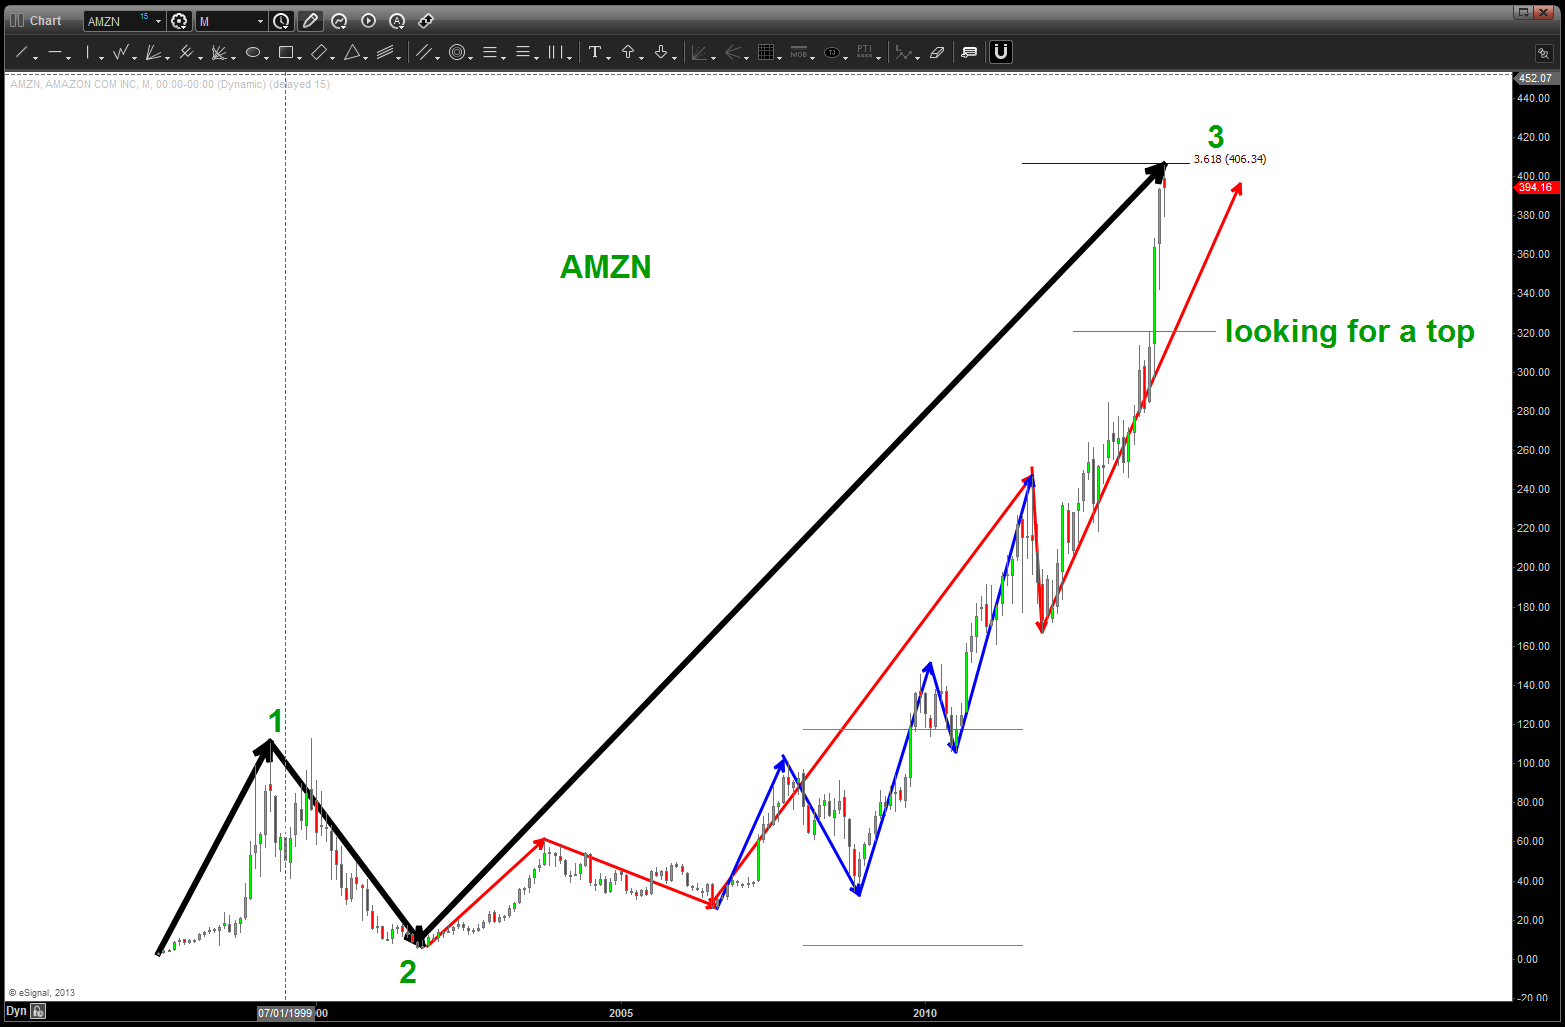
AMZN: a 5 wave count is present and I was looking for a top lower, but got run over by the euphoria present in the market. this doesn’t change the count, it’s just going to hurt that much more …
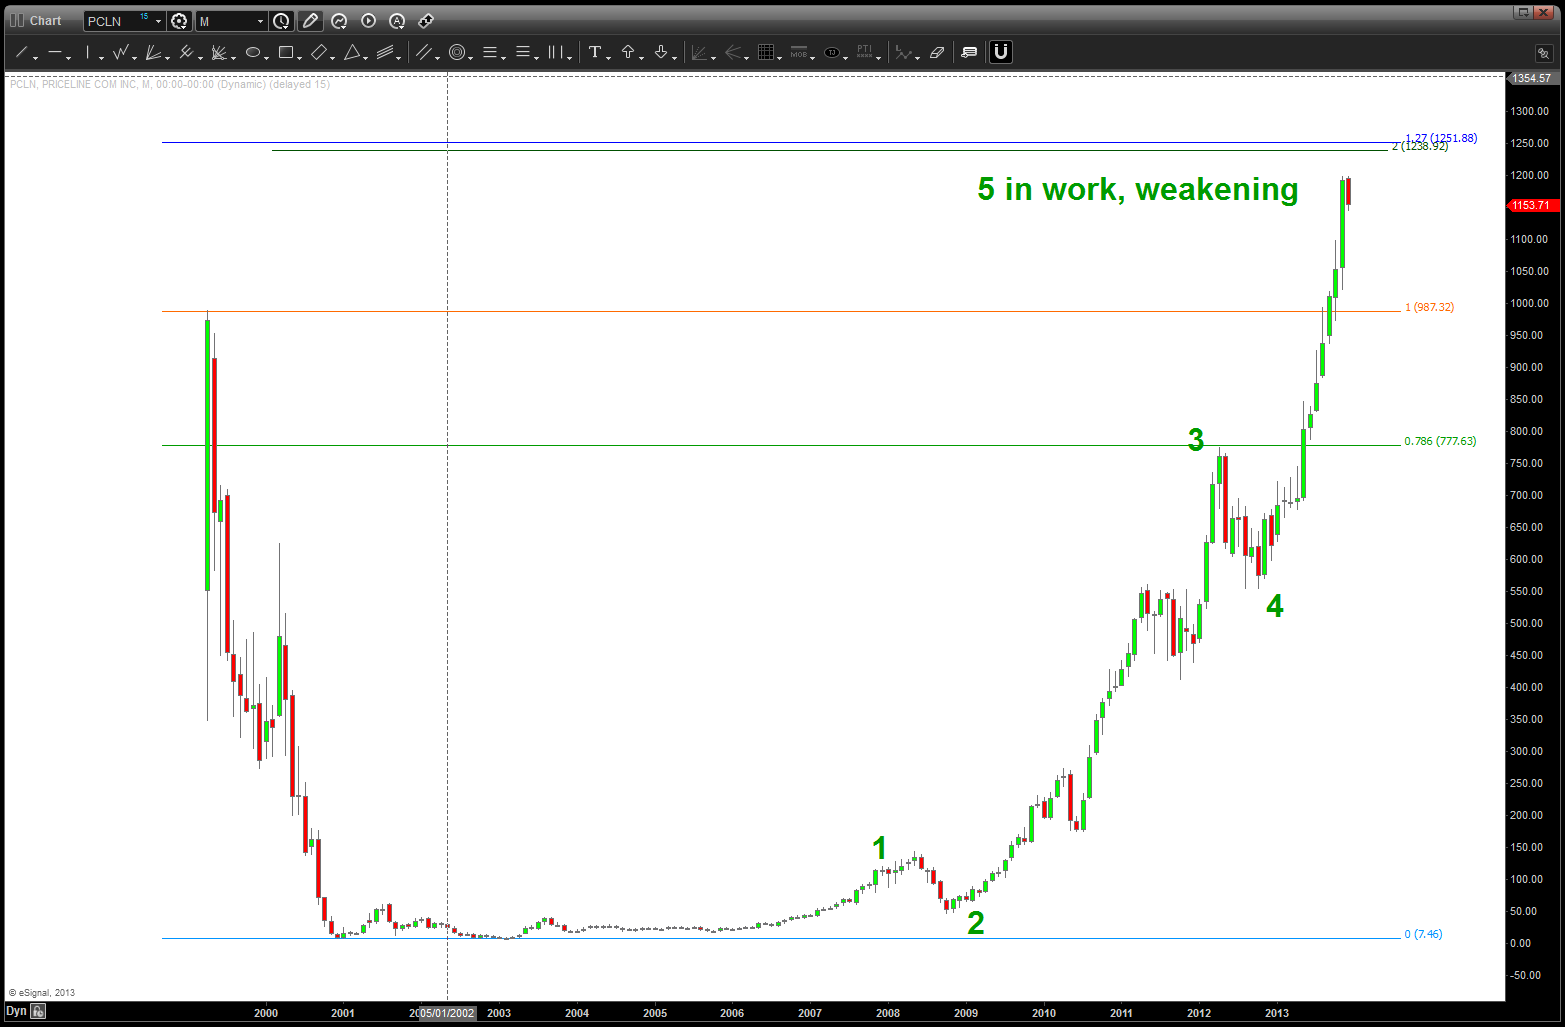
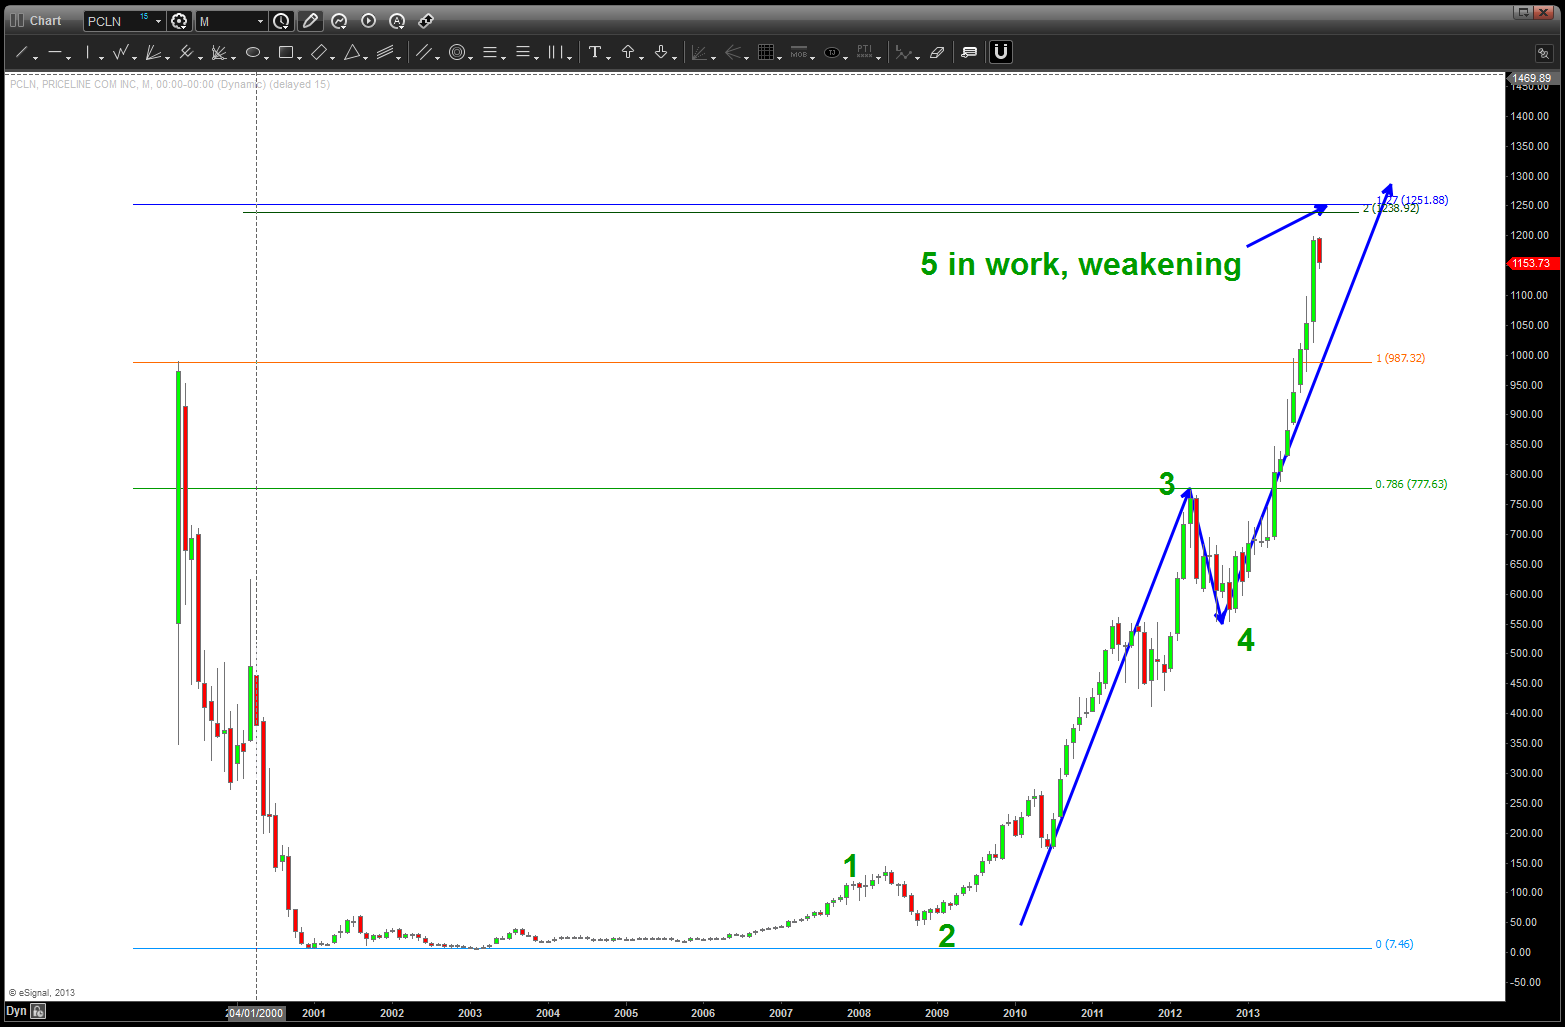
PCLN: again, a clear 5 wave count present and a high flyer of AMAZING proportions .. perhaps a little higher to targets shown? but 5th wave is weakening.
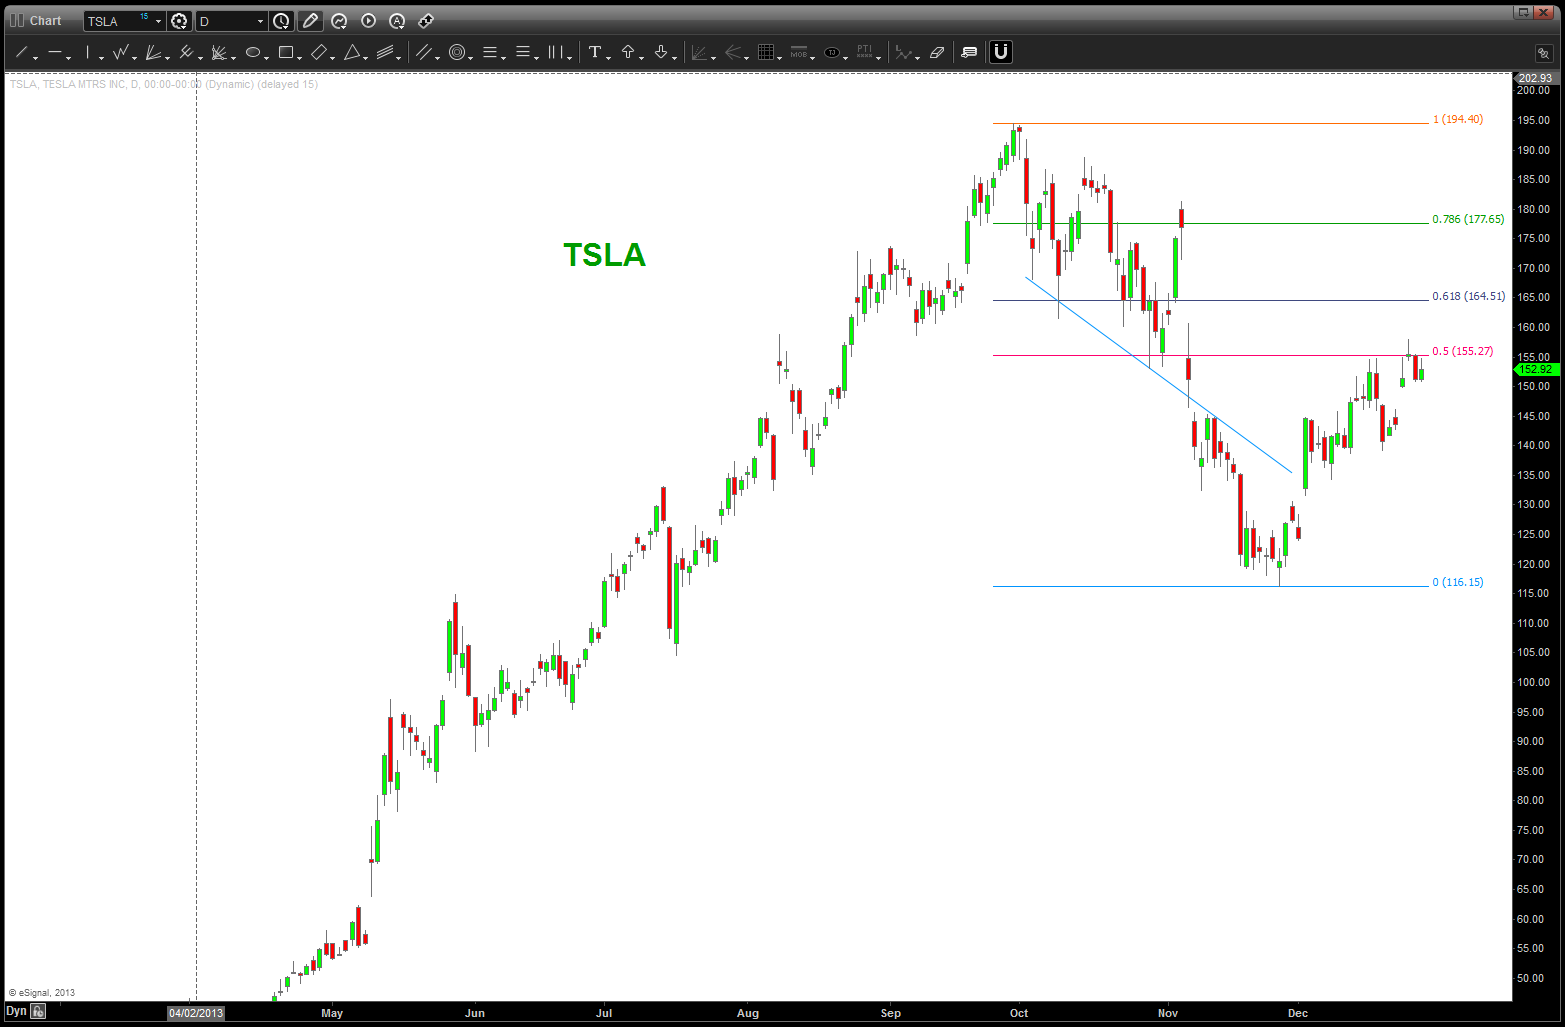
TSLA: bounce occurred as expected .. believe it will start, in earnest once the new year rolls around.
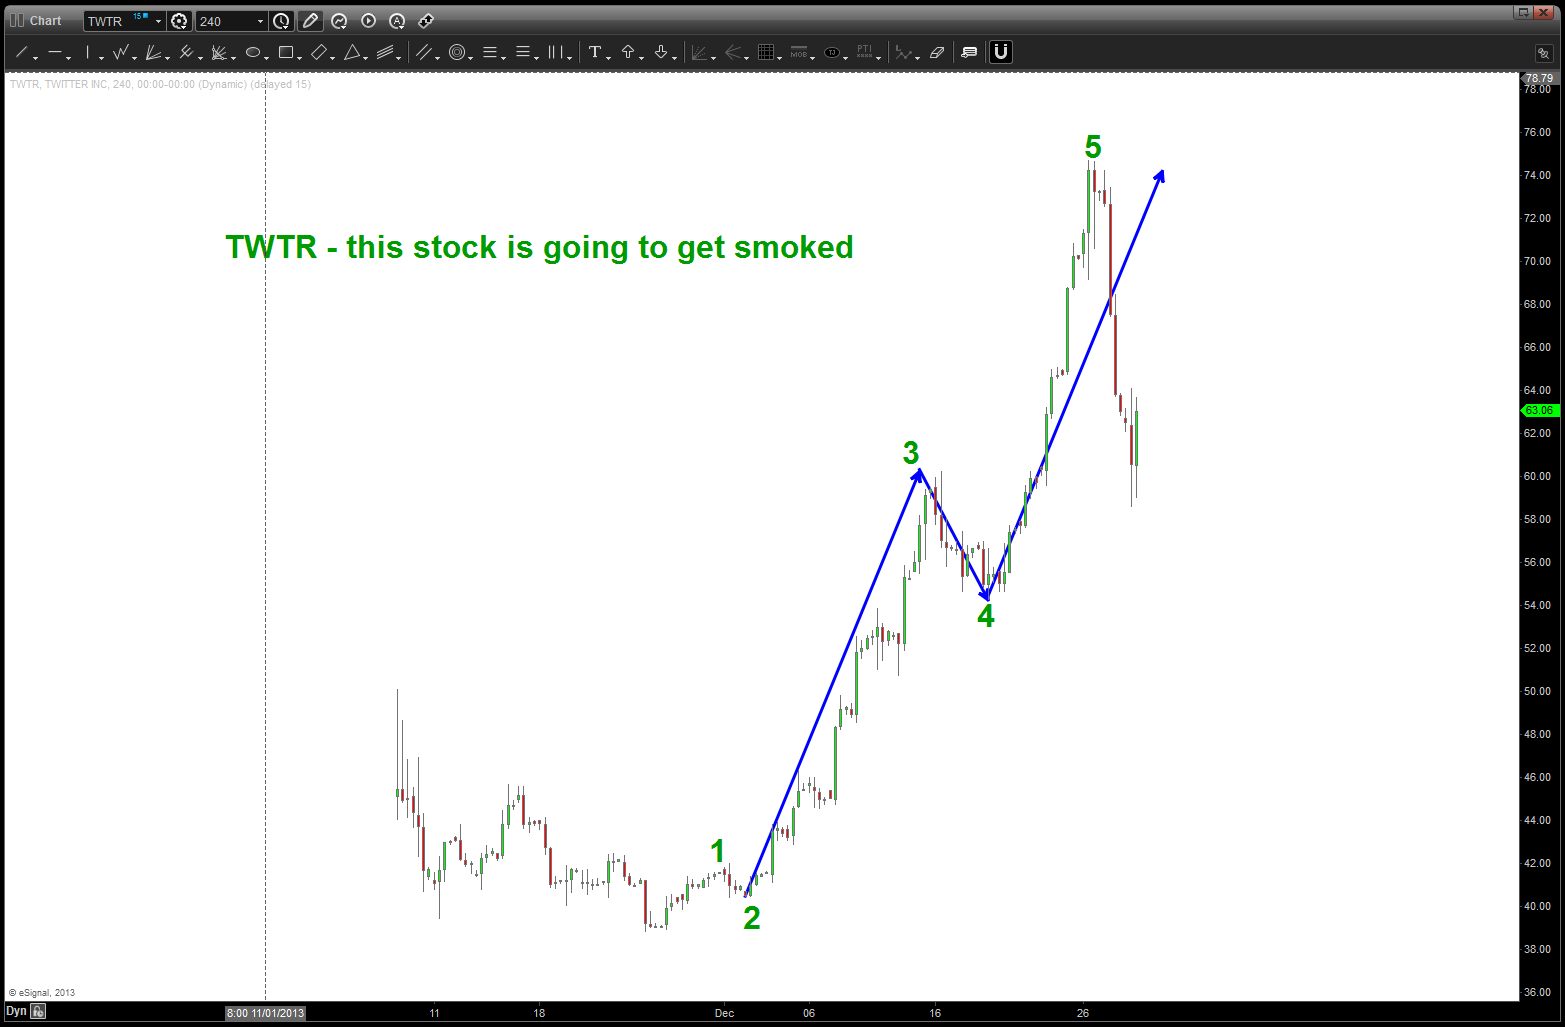
TWTR: bouncing today, but possible count complete. believe this stock is going to get smoked
FB: unorthodox count but one that makes sense .. basically, this entire move has been a corrective expanded flat and FB will go to single digits.


Pingback: update on the high flyers … | Bart's Charts
Pingback: update on the high flyers … | Bart's Charts