the YEN in 2014
the monster move made by the YEN and, correspondingly, the Nikkei 225 has been extremely impressive. the BOJ drew a line in the sand 10/2011 at 76 USD/JPY. That monthly/weekly candle reminds me of the end of the bear market in gold at 252. Kaboom and off she went …
more importantly, take a look at these two long term charts – I believe there is a long way to go.
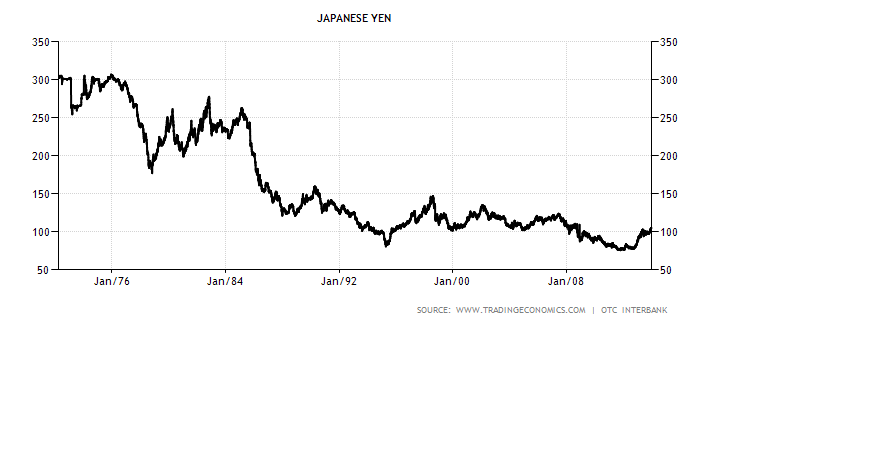
long term JPY vs USD since inception 1972
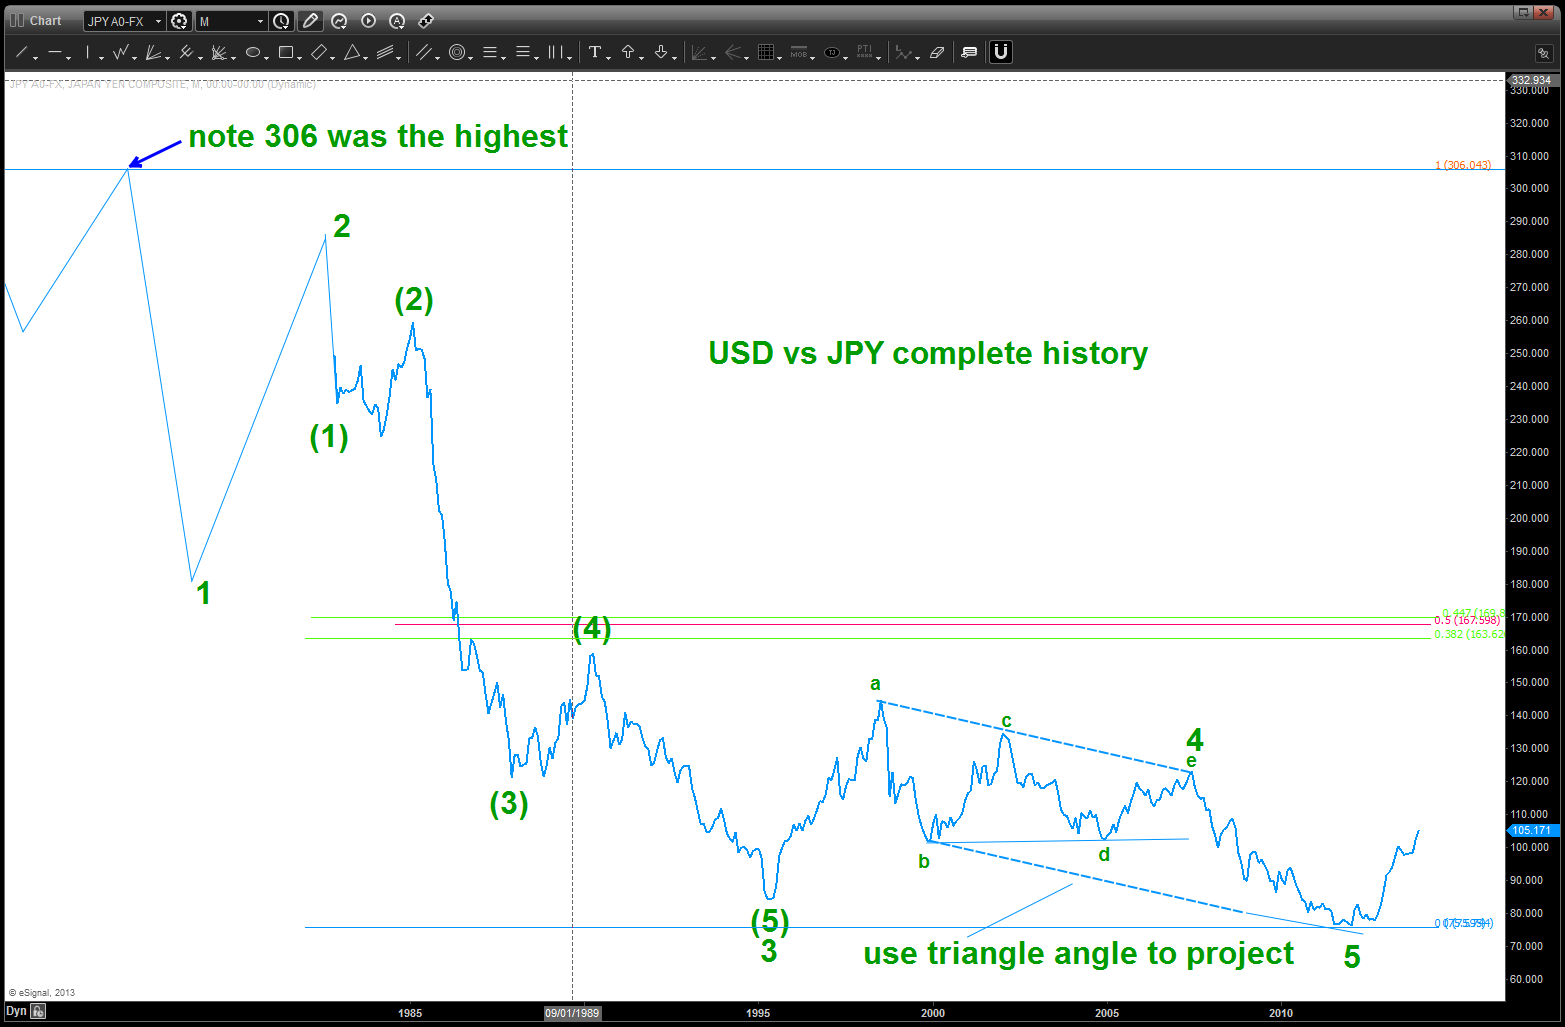
a possible count
using the date from the first chart I have superimposed a line that shows the “basic” movement from the all time high at 306. it’s “close enough” to get the look/feel of the count and I believe we have traced out a major 5 waves down. I like the 5th wave bottom because it corresponds to the “line in the sand” that the BOJ set …taking the long term perspective, an initial target of 160-170 is, quite frankly, a reality. so where are we now …?
right now, I believe risk favors sitting on your hands as a pretty nice 5 wave movement certainly appears to be completing and we are banging right into the .618 retracement of the “e” wave of the major 4th wave triangle. my focus will be on a a-b-c type of correction that could go rather deep but, ultimately, will provide a another opportunity to get long USD, AUD, POUND, CAD, CHF versus the JPY. If history is our guide, then this correction could last a while … waves 2 and 4 were multi-month corrections. so … sit on your hands and wait for a pattern to appear. again, patience will be our guide to look for a still monstrous opportunity.
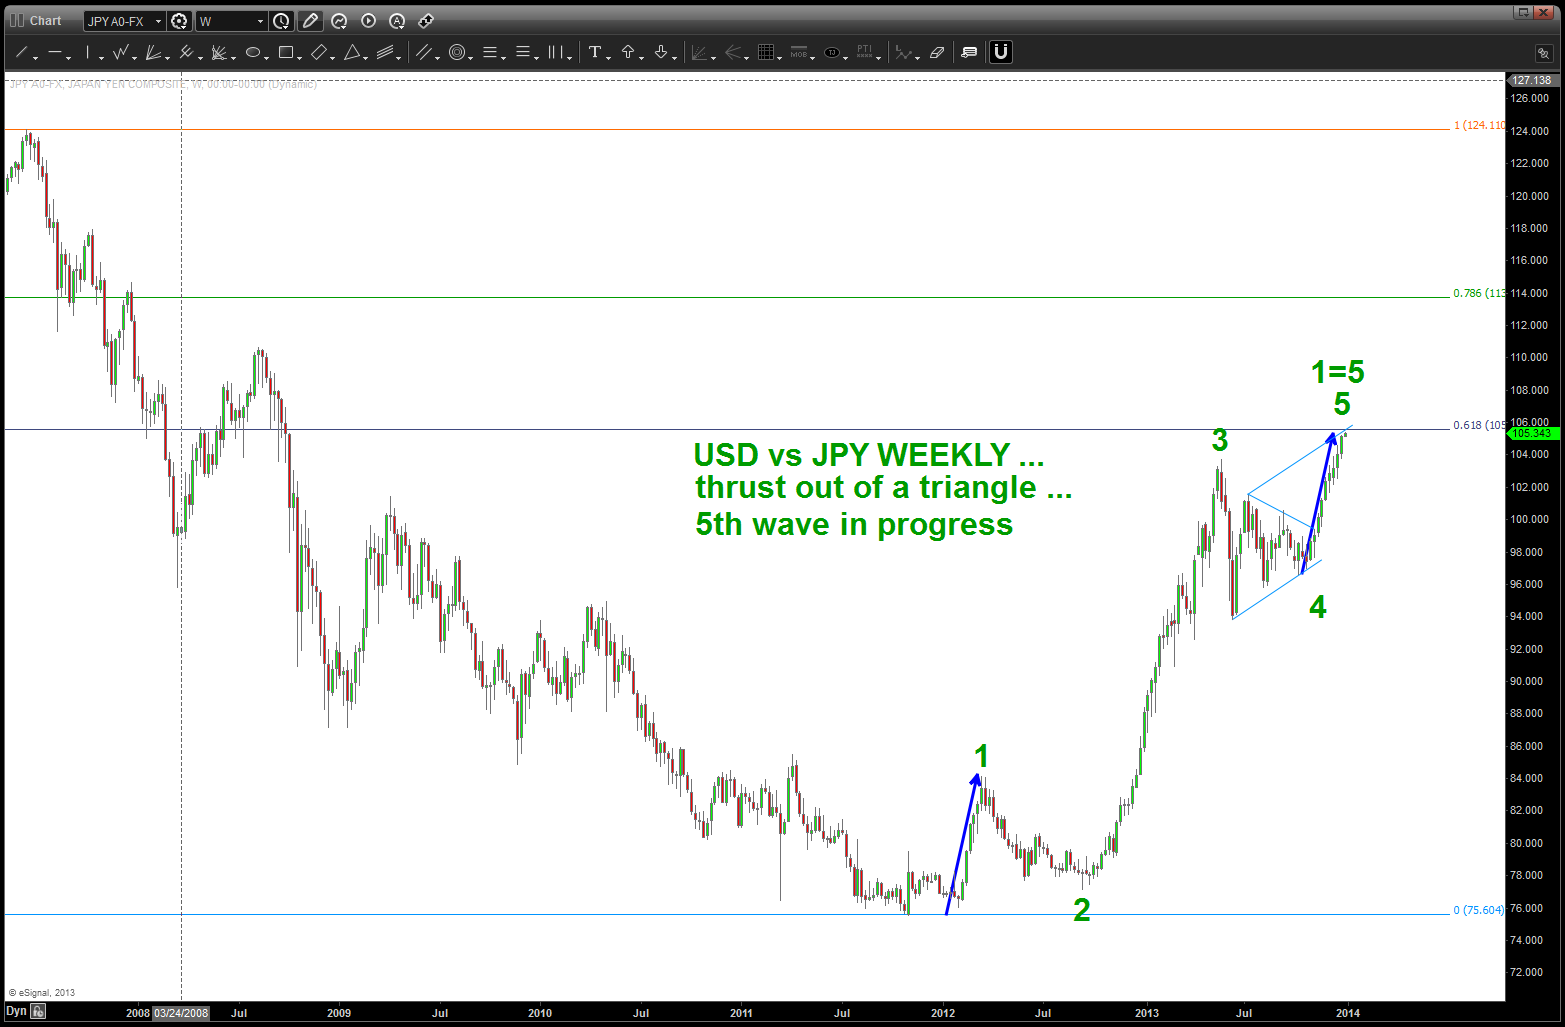
USD vs JPY weekly
