Crude, the Loonie and Oil Services Index for 2014
the chart below shows the Oil Services Index $OSX (candles) w/ USDCAD (inverted/line) overlaid on top …
some observations:
- when the blue line (Loonie) is going down it is weak. when the blue line (Loonie) is going up it’s strong …
- at most inflection points, the $OSX and Loonie are synchronized nicely. however, for most of 2013 this relationship has diverged. in that, while one was going UP (Oil Services Index) one was going down (Loonie weak)
- the Loonie topped a good 6 months prior to the $OSX in 2007-2008. However, once they synced they got smashed …
- the 2009 bottom was well synchronized and since then they have move very nicely together.
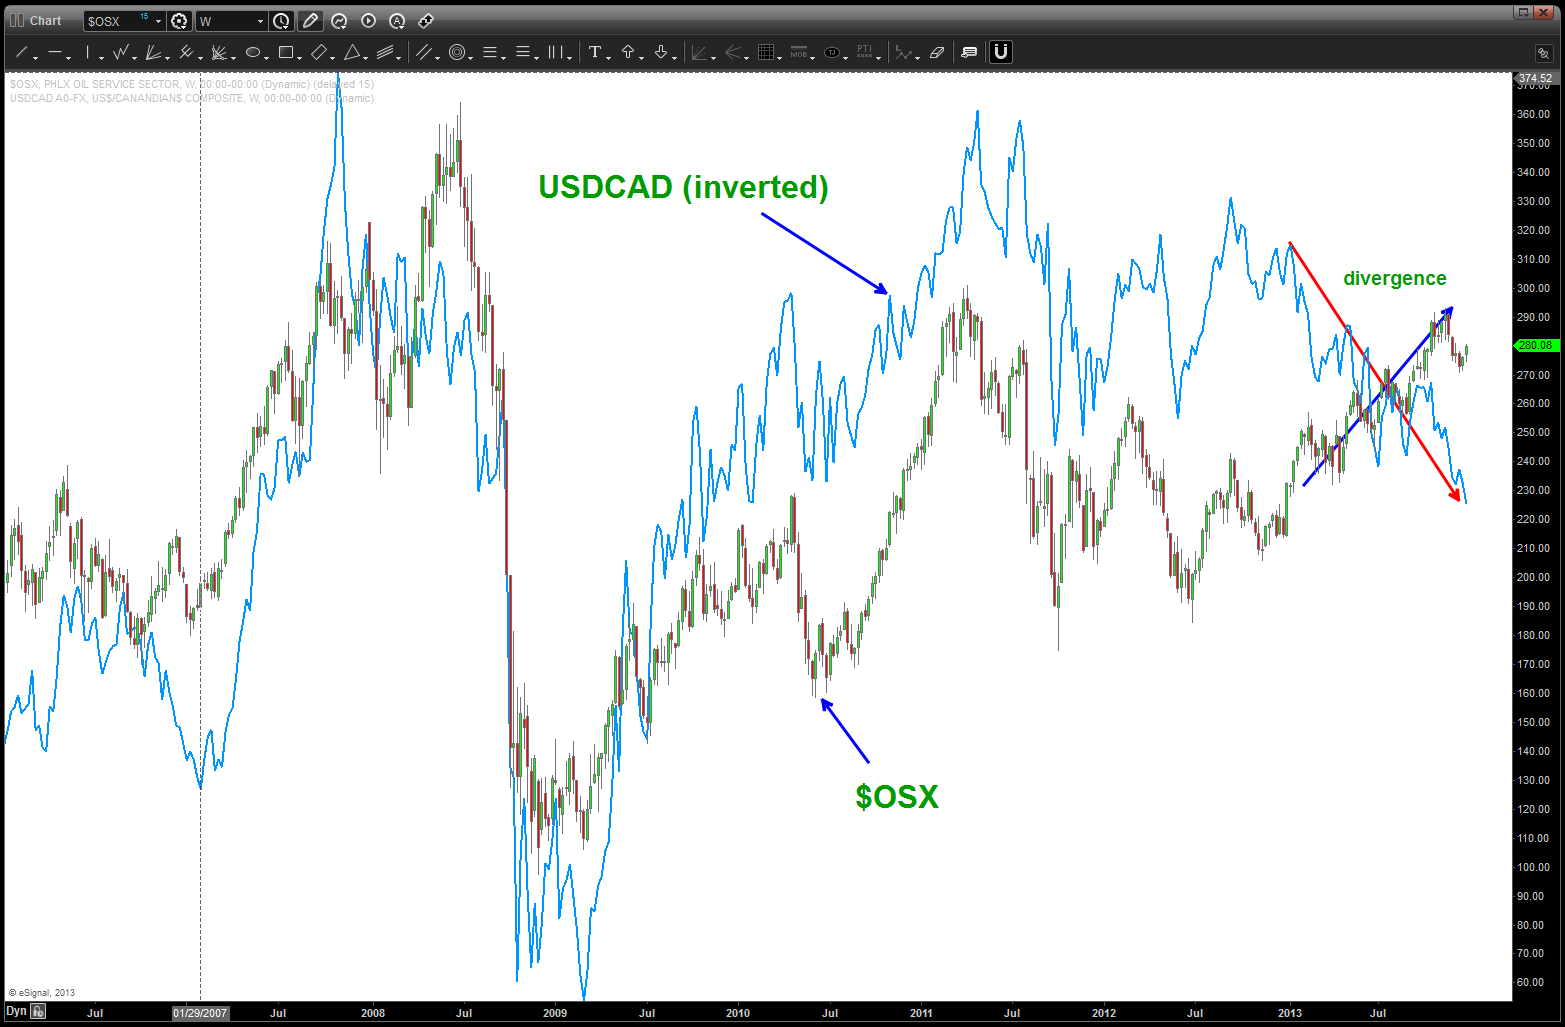
$OSX and USDCAD
below, we have added (black line) Crude Oil to the chart and, as expected, it is very synchronized w/ $OSX EXCEPT since September 2013. Note, the $OSX has held up, nicely. What is this $OSX?
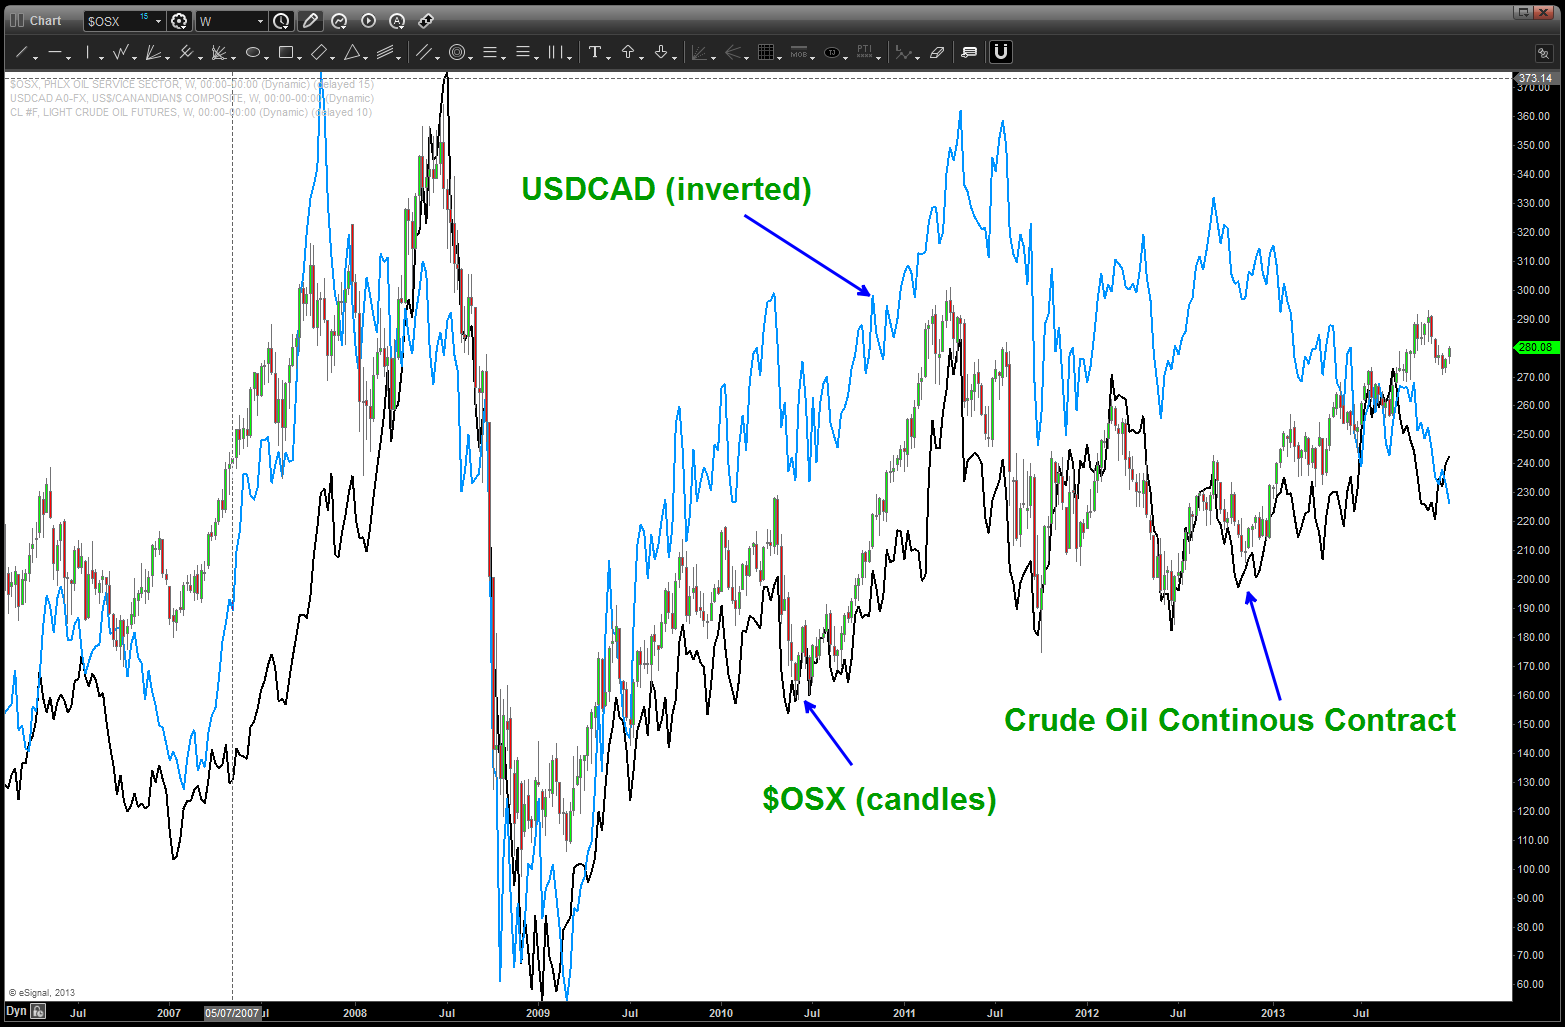
Oil Services, Loonie and Crude
The OSX tracks 15 large companies w/in the context of the Oil Services world …Changes in the Philadelphia Oil Service Sector Index tend to be associated with changes in the oil and gas markets, since greater exploration and construction of wells occurs when oil prices are high and less such activity is carried on when prices are lower. They were all affected by the Gulf of Mexico Oil spill …
so first let’s go thru the 15 components and look for big picture patterns – BUY or SELL.
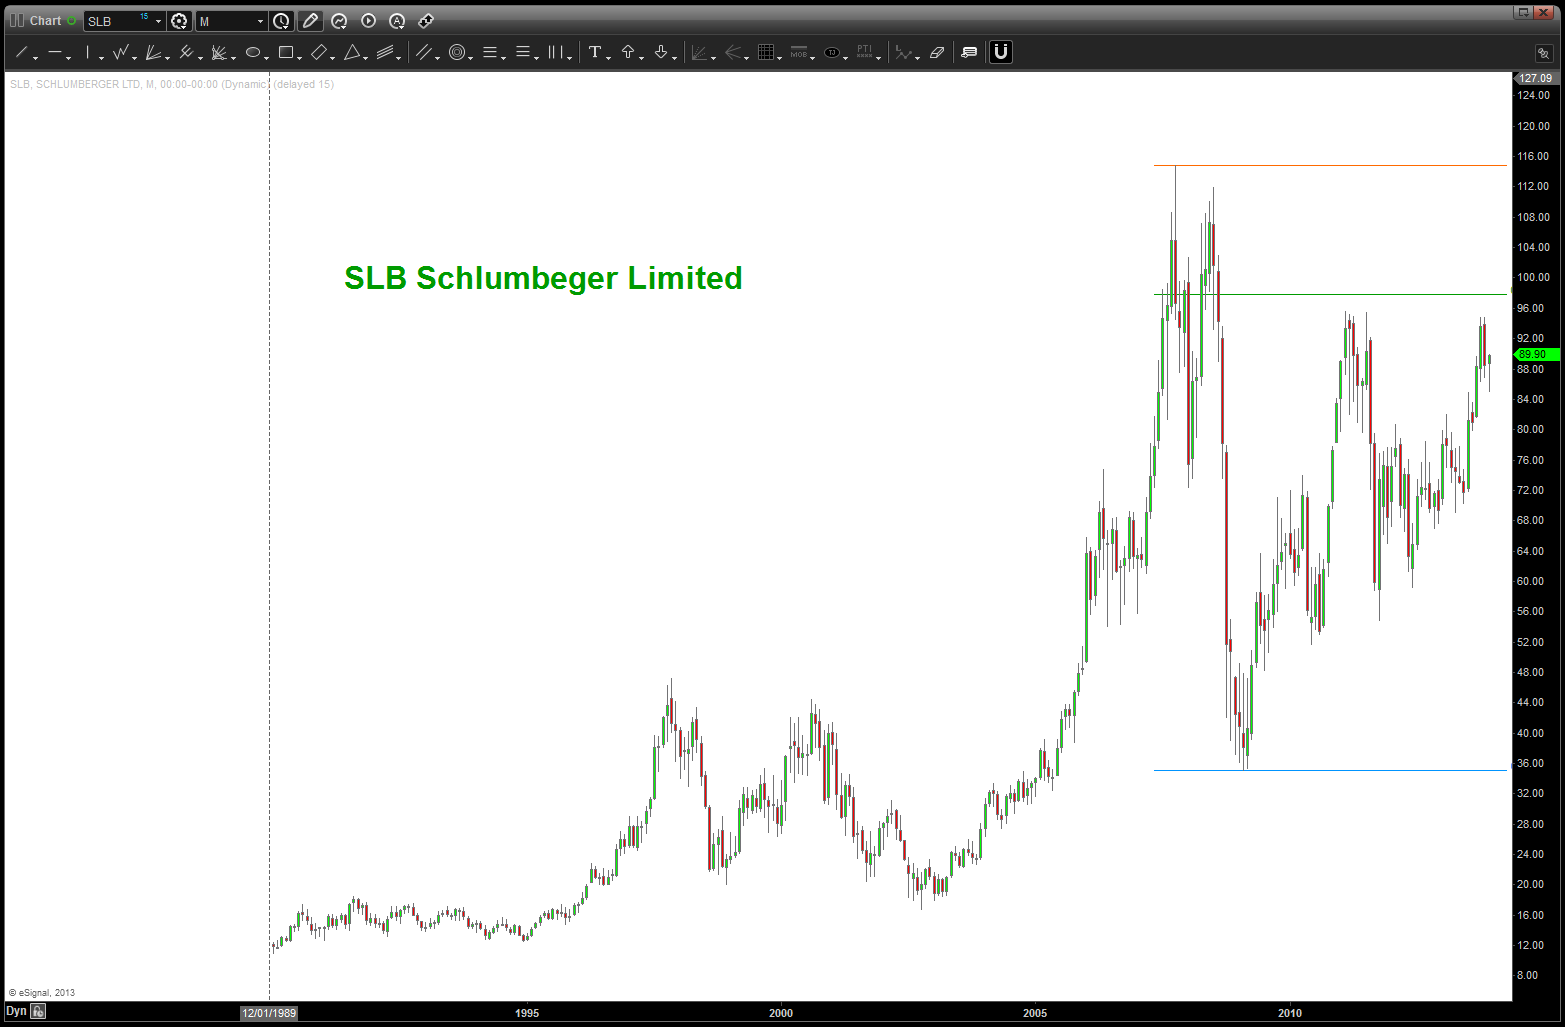
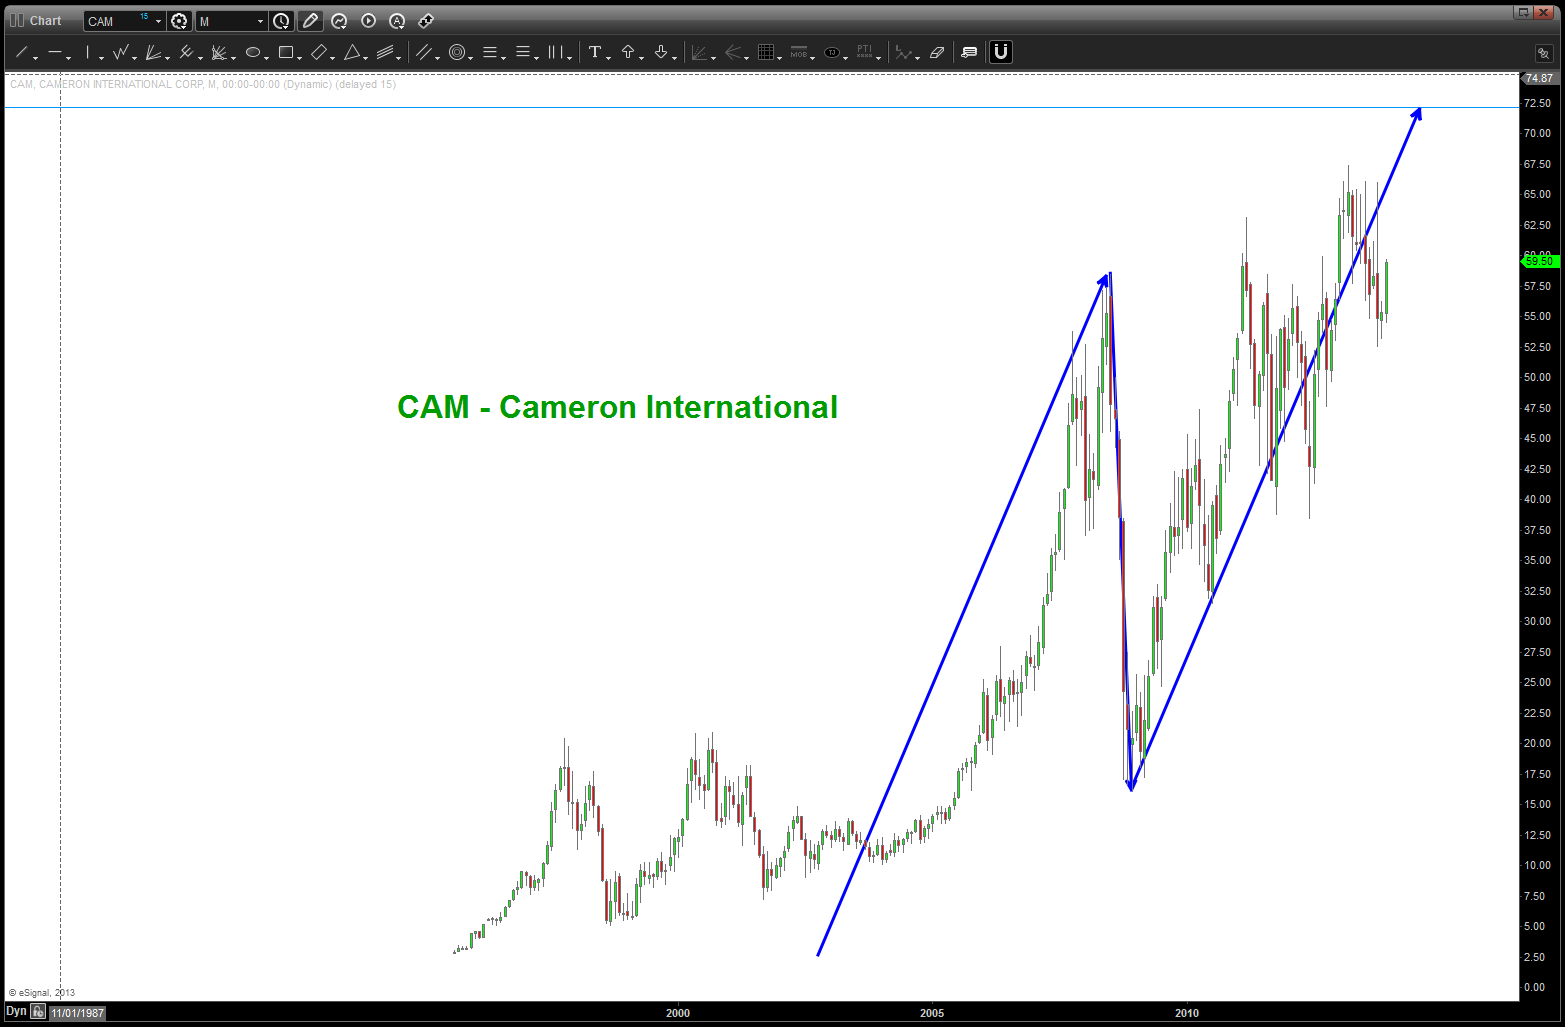
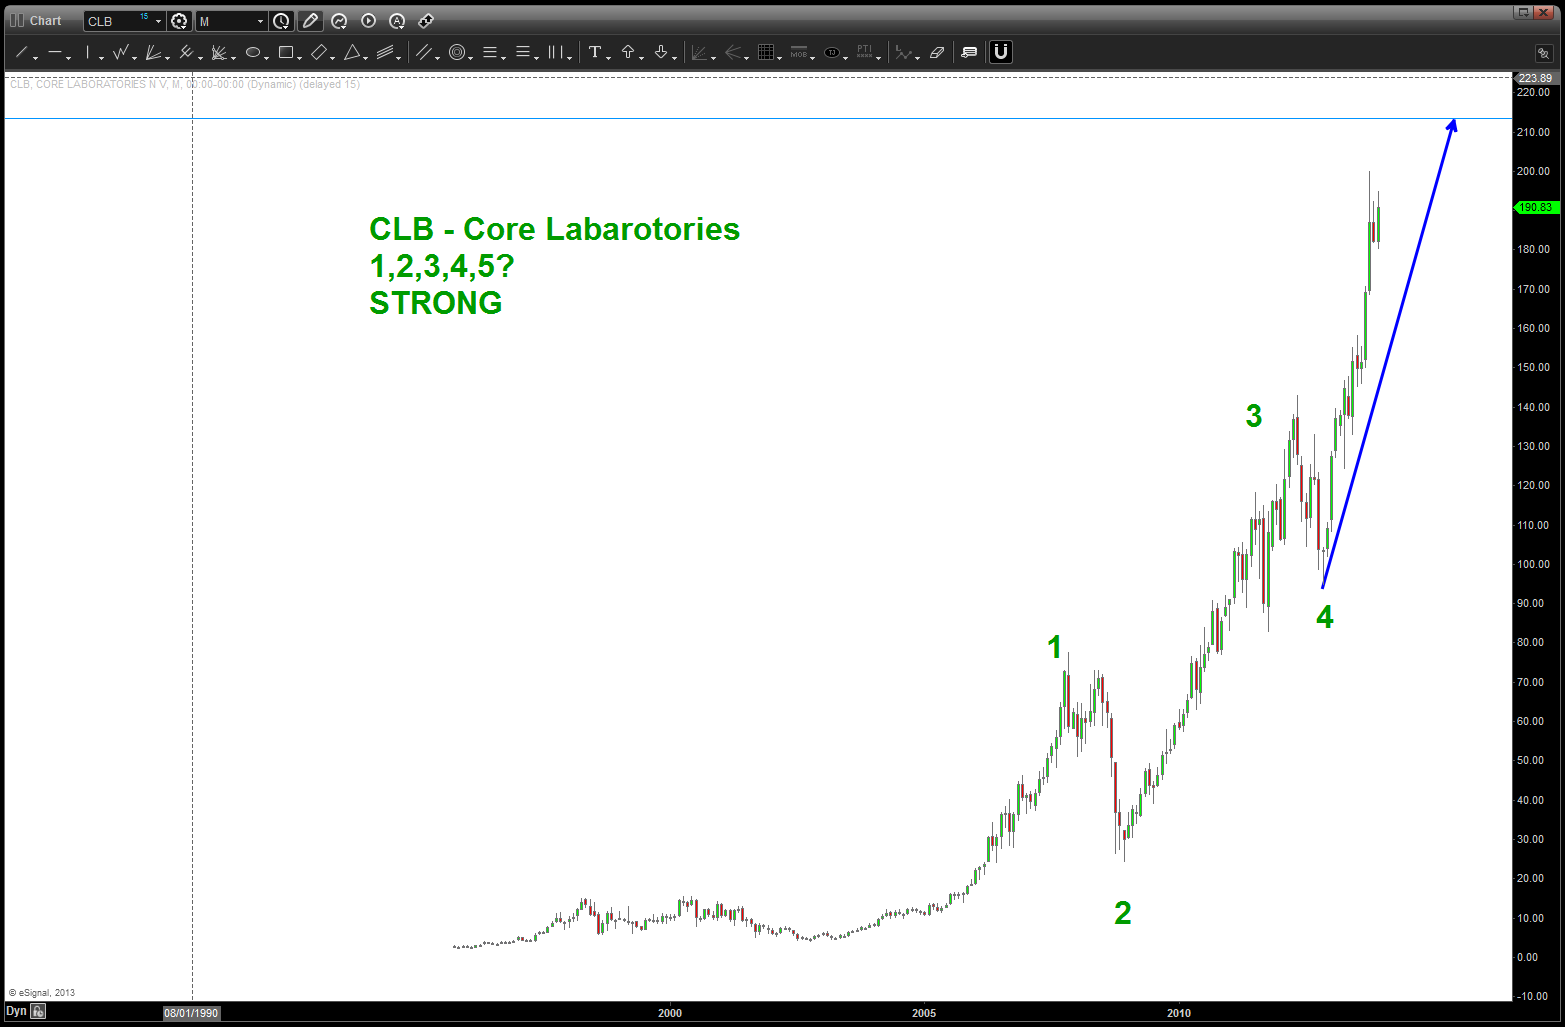
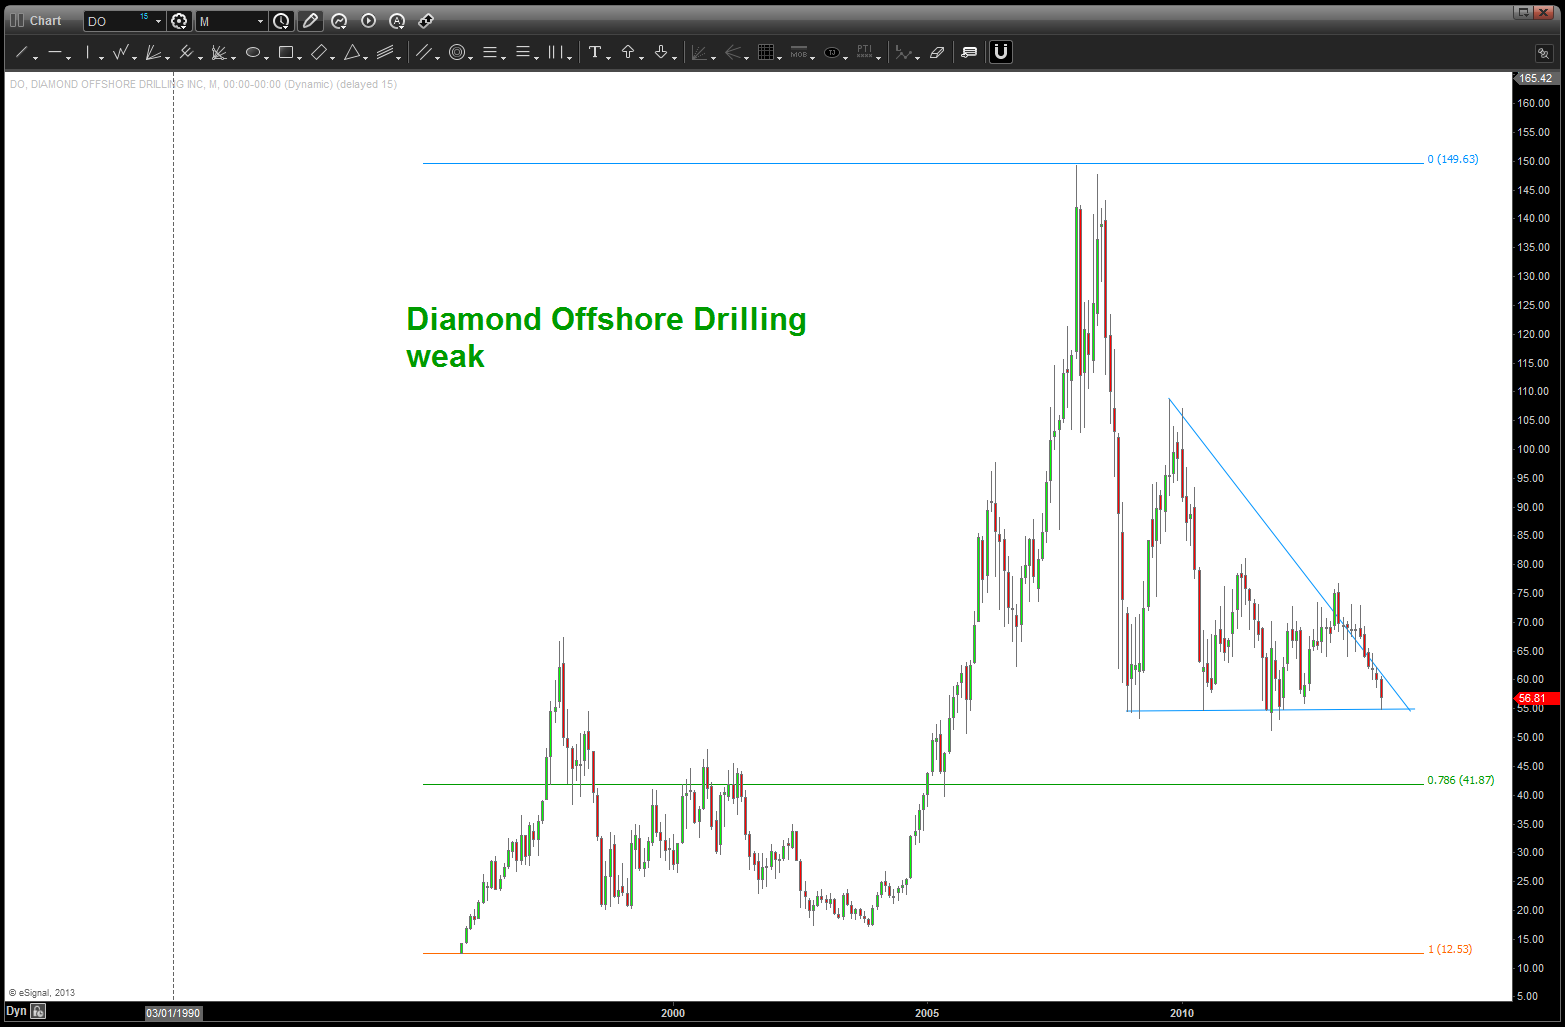
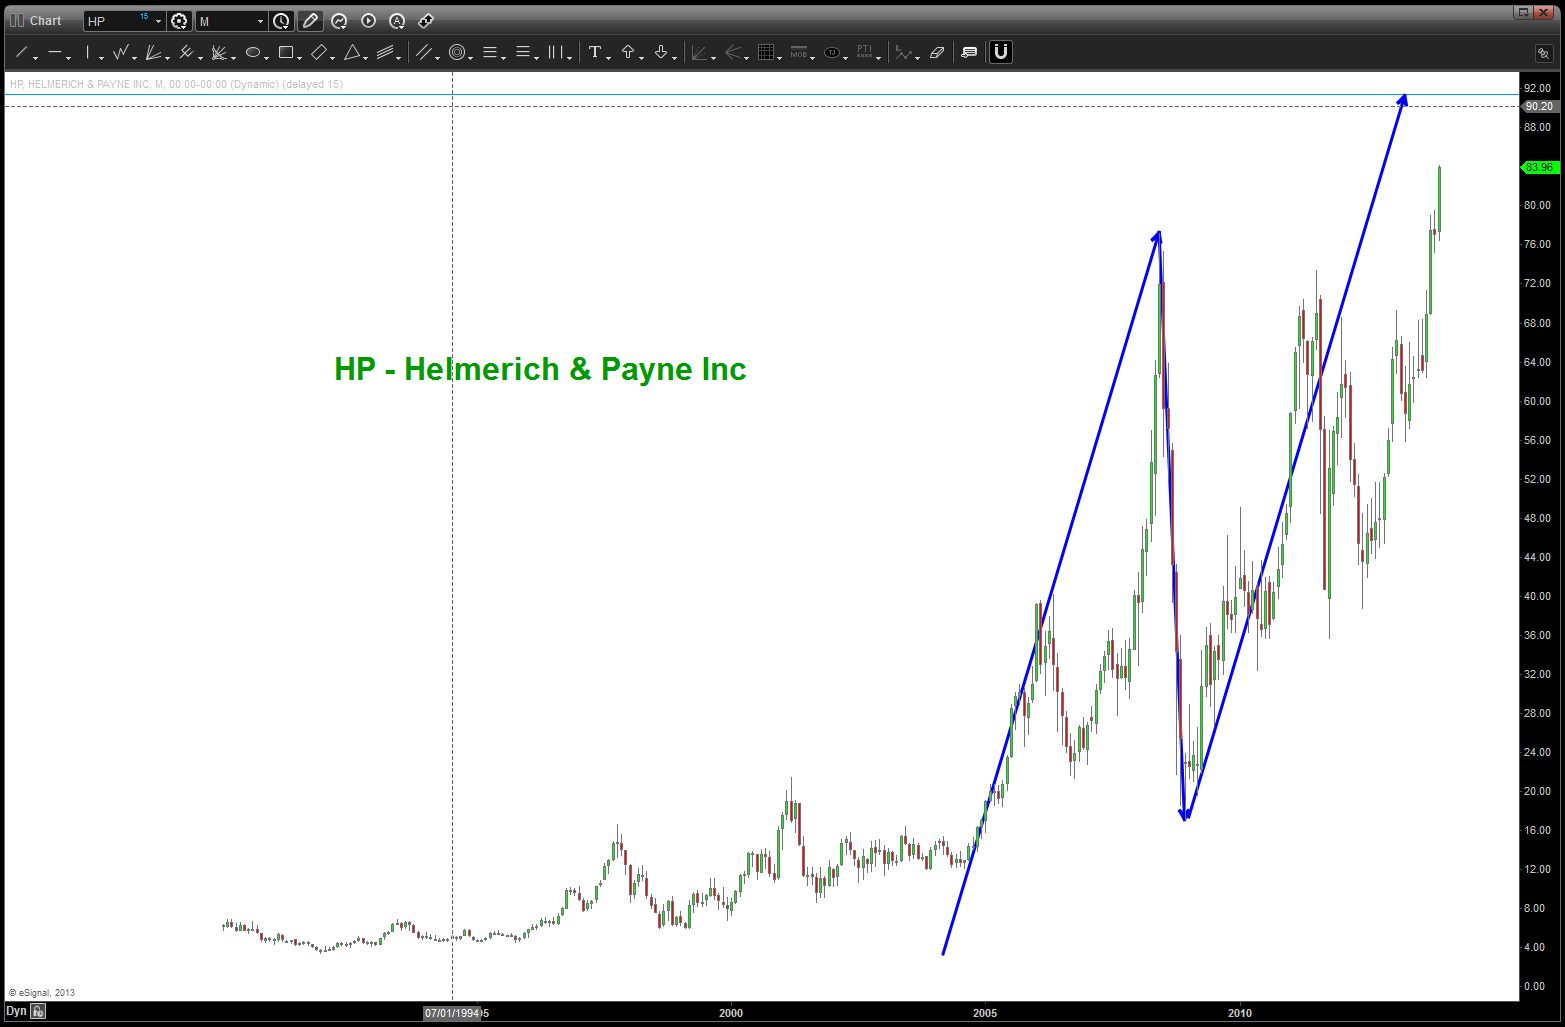
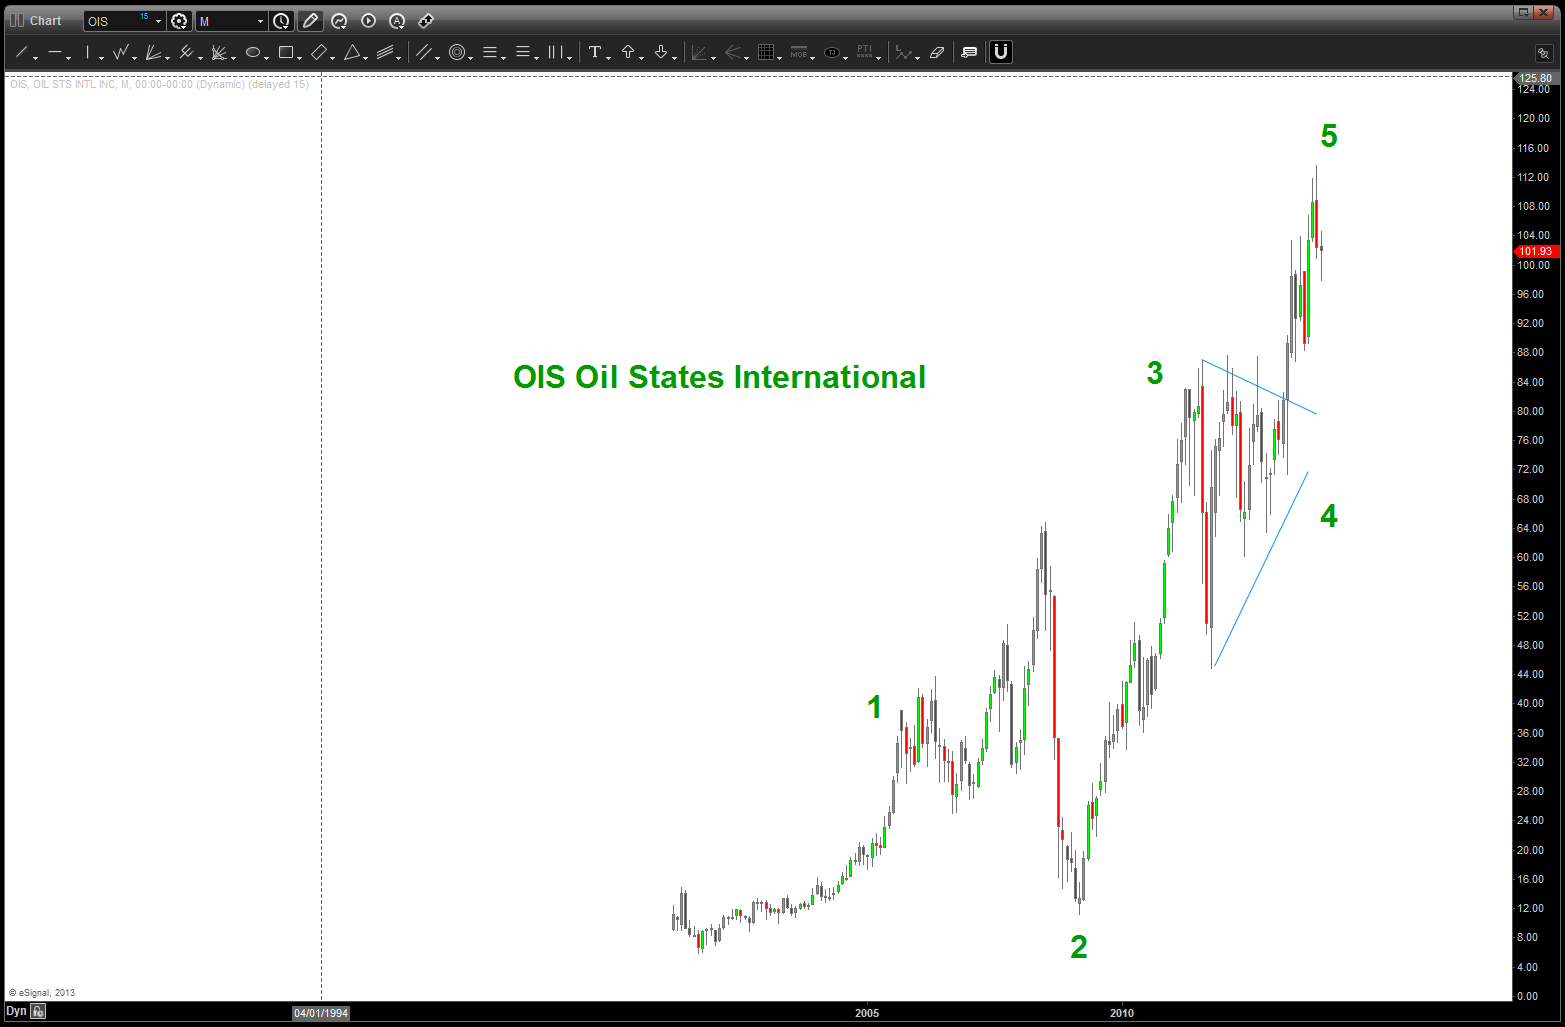
so, as we can see, there are some nice SELL patterns coming in, there are a couple weak ones and where I didn’t post any charts there wasn’t a glaring pattern to be seen. Bottom line – I’m not seeing significant strength in the index but to elevate some of the stocks to hit their targets perhaps we’ll see some more strength. so, now we need to break down each individual component …
Crude Oil: https://bartscharts.com/2013/10/31/crude-oil-a-potential-roadmap/ this was my last post. I am still in the “look and feel” phase that the top at 147 was a 3 and the low in/around 35 was a 4. while the pattern completing at 110 was good, the thrust off this bottom trend line last week led me to see a triangle where we can see a,b,c,d,e – triangle complete and off to a new high ? CRUDE BULLISH
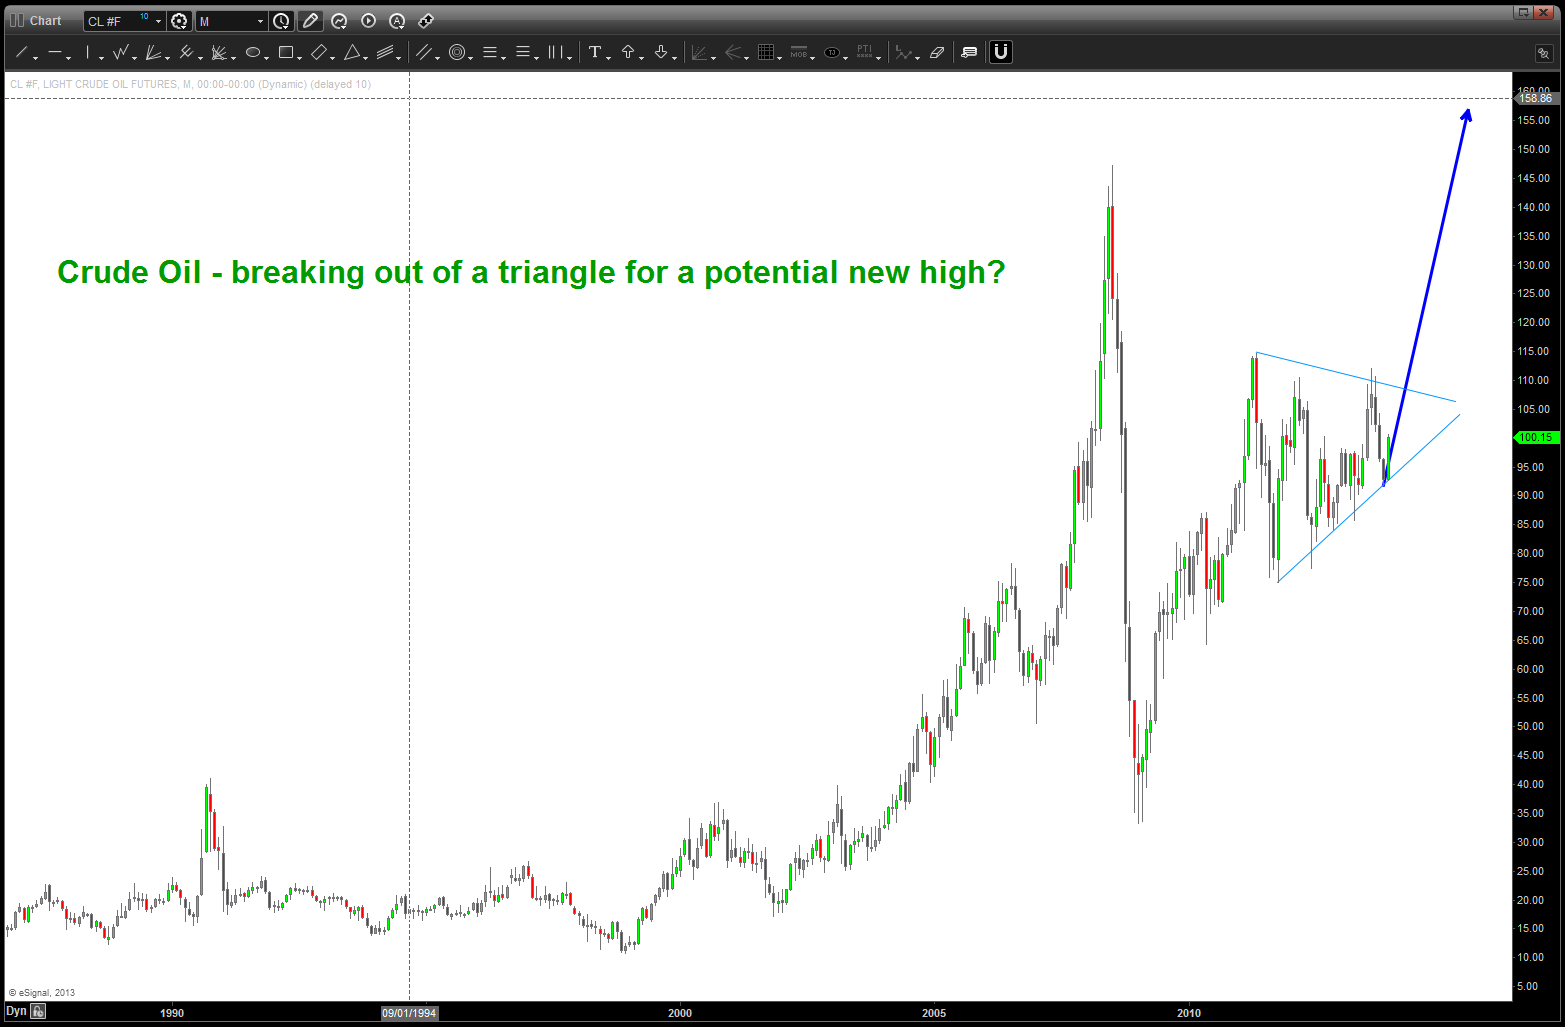
Crude Oil
USD vs CAD: just a little bit higher (200 pips) we have some pretty major targets. while I am a DOLLAR BULL, also recognize that the Loonie is a small percentage of the overall index. LOONIE BULLISH (after a little more weakness)
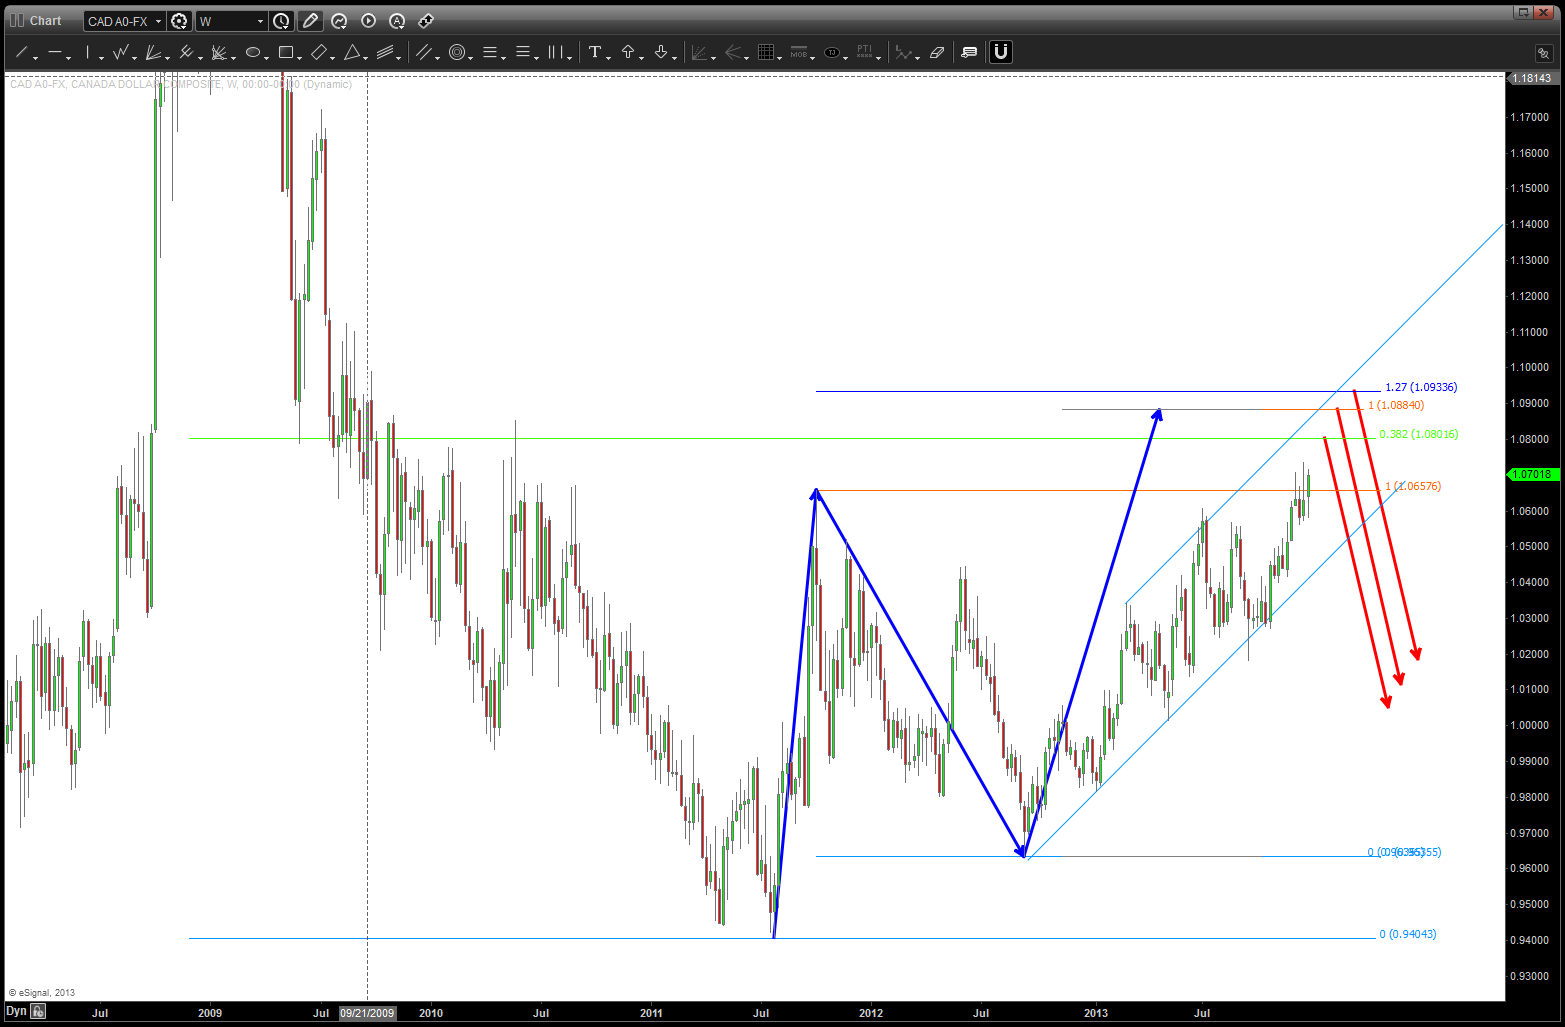
CAD vs USD
Oil Services Index: the only thing “wrong” w/ this chart is that, a RULE of counting is 4 cannot go below 1. In this case it does, However, the Crude chart spikes thru but never closes below. so, I am keeping this count. Note, we smacked right into the .618 price projection area at/around 294 and are testing it again. the 306-307 level will be key.
So, our roadmap to follow is:
- Crude – breakout of triangle.
- Loonie – BUY a couple hundred pips lower
- Oil Services – break thru – with strength and conviction (read volume) levels show
one last, this is something to be patient w/ …. I would not recommend jumping all over this tomorrow but wait and see these levels get attacked … the GREAT thing about PATTERNS is we now have clear lines in the sand for where we are correct or wrong. Go back to the beginning of the post – w/ that divergence between the OSX and CAD-Crude the patterns will tell us which way this entire family (Crude, OSX, CAD) will resolve. It very well could go completely opposite but not until the pattern levels are targeted. they will either work or fail and then we’ll pounce
