Crude Oil … a potential roadmap
I enjoy this chart, not only for the amazing dynamics of the math and harmony but … I’ll tell you in a minute
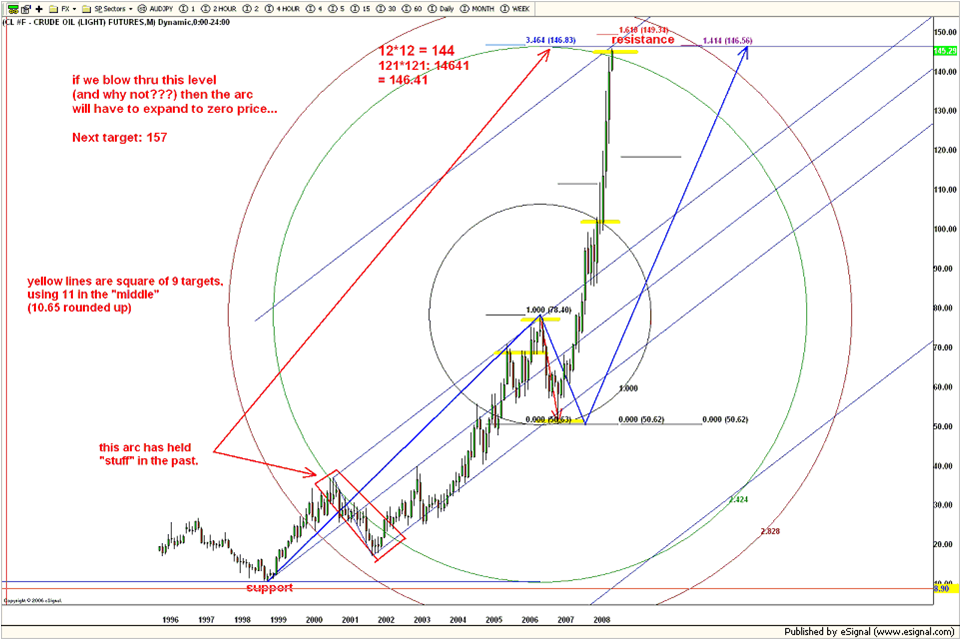
Exact high on crude oil …
here’s why – it occurred on my birthday! 🙂 July 11, 2008 was the high on crude …
anyway, I have to admit that this scenario I am putting out on the blog is, perhaps crazy, but it’s an interpretation that you can pay attention to or not … the one thing I DO NOT LIKE is that first move up from one ….it sure looks like only 3 waves and, well, that can’t be right BUT in the context of the picture it fits so I am going w/ it. the other thing is wave 4 can’t overlap the end of wave 1 and well, technically, it does go threw there for a bunch of months but NEVER closes below so I’m working w/ that one also .. subjective interpretation so to speak.
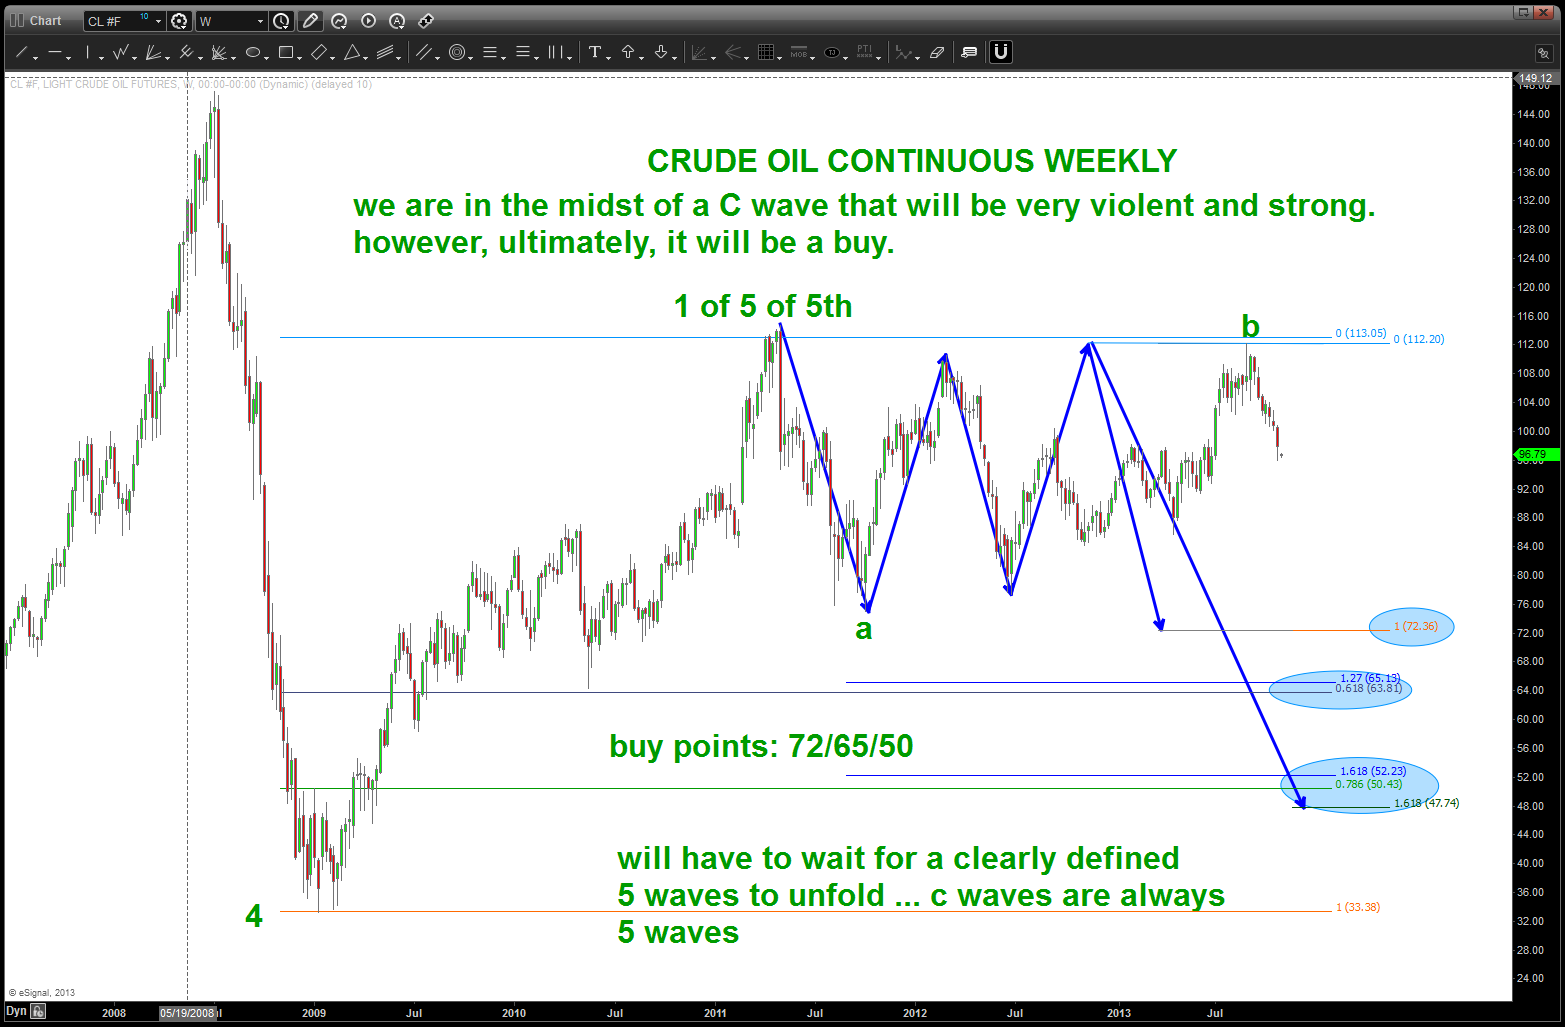
so, below are the pictures that I”m working w/ … the thesis is we have a very powerful C wave in oil down that has just begun and one that will, ultimately need to bought – perhaps 6-9 months from now … enjoy.
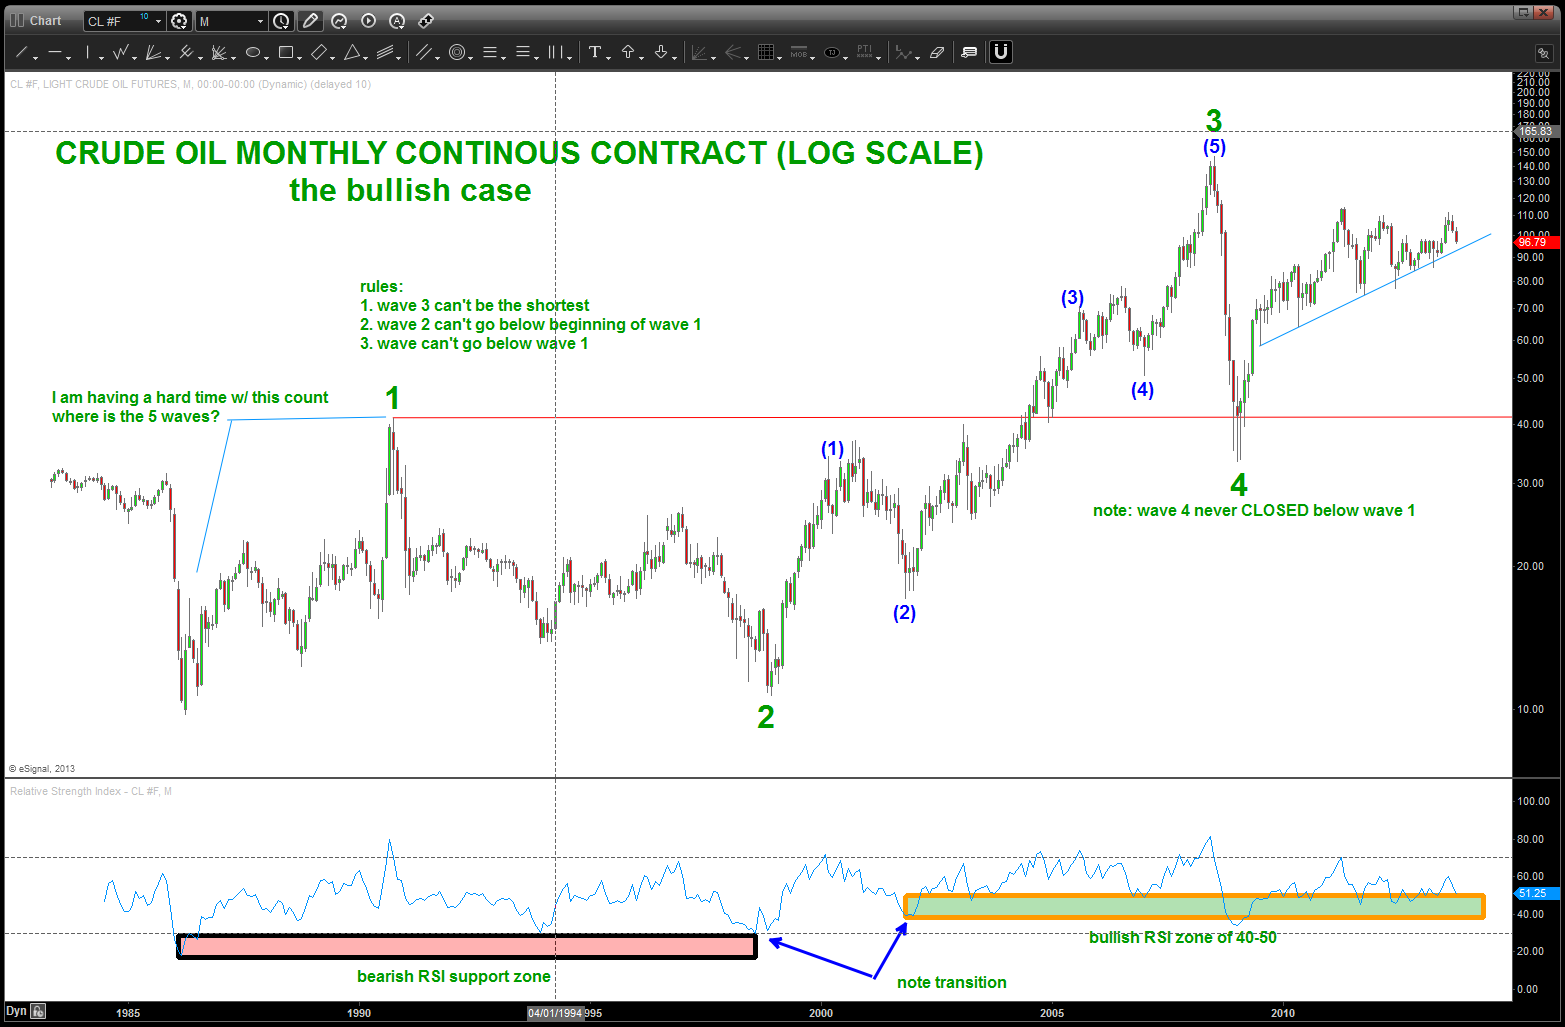
a POTENTIAL count

Pingback: Crude, the Loonie and Oil Services Index for 2014 | Bart's Charts