it’s FED time and an explanation of the recent price action in fixed income
can’t believe it’s been a month …amazing how time flies.
here’s the summary of my post from the last FED meeting (note it was 4 or so hours before the announcement) :
https://bartscharts.com/2013/09/18/bruce-buffer-of-ufc-and-the-fed/
“HOWEVER, in the context of an amazing 30+ year bull market in the fixed income world we have reached the “normal” and “standard” correction that has existed since the beginning of this bull market in the 80′s. We do have one more correction low that “could” happen so perhaps a little lower is in the cards. what’s really fascinating to me w/ regard to the FED FUND futures chart is it hasn’t budged. the traders of the world don’t think anything is going to happen …
Per my post a week or so ago on bonds the BUY of BONDS (sell YIELD) is the side of the market I want to be on ….”
so, the fixed income market has bounced and here’s my explanation of the “why”:
https://bartscharts.com/2013/10/21/plotting-the-next-move-in-fixed-income/
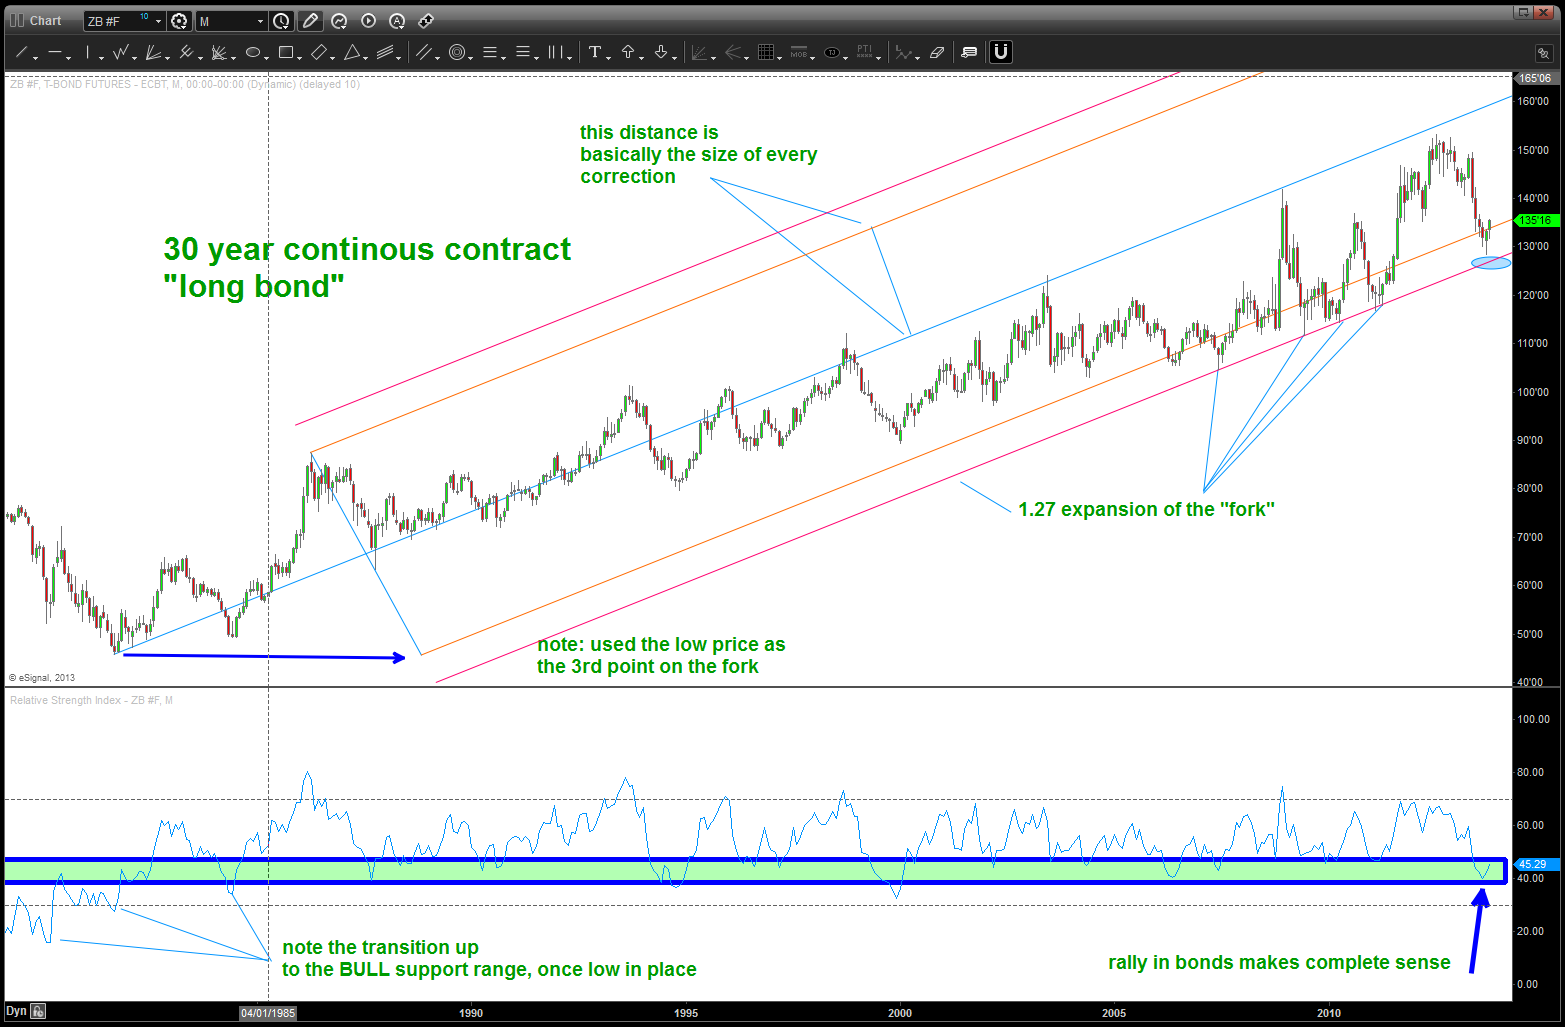
let’s face it, the trend is your friend,and after 30 years this “normal” correction was doing something amazing predicatable w/ regards to the long term RSI and the bullish support zones inherent w/in a bull market. go GOOGLE RSI bull or bear zones and you’ll find that the 40-50 level is BULLISH support and, guess what, that is exactly where the RSI (on a long term chart) bounced. (see chart below)
again, call me crazy but we could see another new high in the bonds … nothing in this chart tells us that the trend is over. HOWEVER, our first HINT that the trend is over is a MONTHLY CLOSE BELOW our support zone shown …
as an advanced pattern recognition trader (music, sacred geometry, fibonacci) none of the most recent price action is surprising at all….