Loonie, OSX, Crude – time for another inflection? UPDATE to the UPDATE

11/5/2016 – Crude Continuous is giving us a nice “heads up” that this move is CORRECTIVE in the scheme of a much larger corrective pattern to finish a big big 4.  the market corrects (most of the time) in 3 waves labeled A-B-C …in this case let’s follow the set up:

  • $26 dollars was the END of 3 of 5
  • $51 was the top of A
  • the 51.92 slight new high (NOTE WAS IN 3 WAVES) was a ‘minor’ b wave and this move lower is ‘c’ to finish the a-b-c sequence of B.
  • the ‘usual’ relationship is 1.618*a = c and note all of the ratio’s come together in/around 31.30-31.60.  THAT’s a GREAT BUY for crude.
    • Else – we could just be arcing out a FLAT and 38 holds it and if we have 5 waves down into 35.70-35.90 that could be it.
  • either way … we are moving into a very nice BUY of crude.

Until we hit that bottom .. the LOONIE will probably not strengthen and churn/burn in around these levels or a little higher. be patient, the move is coming.

here’s the ideal pattern we are watching:

wave18

here’s crude:

page_16-11-05_12-47-32

here’s Loonie vs EURO and USD:

page_16-11-05_12-55-53


page_16-11-05_12-58-57


10/24/2016 – target hit on the USD vs LOONIE.  Watch this one carefully.  It “appears” that everyone is thinking of a big breakout but, as you can see, we had multiple targets coming into play and they were hit today.

WATCH FOR A DAILY CLOSE BACK BENEATH CHANNEL OR THE .382 as shown.

page_16-10-24_20-42-40


page_16-10-24_21-09-53


go ahead and follow this link if you want to follow some real time PATTERNS w/ technical analysis and the correlation between the 3 items in the subject line: https://bartscharts.com//?s=LOONIE

appears we are at another critical juncture:

  • Crude – 2 buy patterns present.
  • OSX – buy level indicated
  • USD vs LOONIE – multiple patterns present for another move in LOONIE strength.

again, these are just patterns folks … but we have a very clearly defined demarcation line for the next move to begin.

stay tuned

Bart

charts below, let me know if you have any questions.

page_16-09-20_14-40-24 page_16-09-20_14-43-03 page_16-09-20_14-51-26 page_16-09-20_15-14-05 page_16-09-20_15-23-19 page_16-09-20_15-27-18


Loonie, OSX, Crude – time for another inflection? UPDATE

10/24/2016 – target hit on the USD vs LOONIE.  Watch this one carefully.  It “appears” that everyone is thinking of a big breakout but, as you can see, we had multiple targets coming into play and they were hit today.

WATCH FOR A DAILY CLOSE BACK BENEATH CHANNEL OR THE .382 as shown.

page_16-10-24_20-42-40


page_16-10-24_21-09-53


go ahead and follow this link if you want to follow some real time PATTERNS w/ technical analysis and the correlation between the 3 items in the subject line: https://bartscharts.com//?s=LOONIE

appears we are at another critical juncture:

  • Crude – 2 buy patterns present.
  • OSX – buy level indicated
  • USD vs LOONIE – multiple patterns present for another move in LOONIE strength.

again, these are just patterns folks … but we have a very clearly defined demarcation line for the next move to begin.

stay tuned

Bart

charts below, let me know if you have any questions.

page_16-09-20_14-40-24 page_16-09-20_14-43-03 page_16-09-20_14-51-26 page_16-09-20_15-14-05 page_16-09-20_15-23-19 page_16-09-20_15-27-18


Loonie, OSX, Crude – time for another inflection?

go ahead and follow this link if you want to follow some real time PATTERNS w/ technical analysis and the correlation between the 3 items in the subject line: https://bartscharts.com//?s=LOONIE

appears we are at another critical juncture:

  • Crude – 2 buy patterns present.
  • OSX – buy level indicated
  • USD vs LOONIE – multiple patterns present for another move in LOONIE strength.

again, these are just patterns folks … but we have a very clearly defined demarcation line for the next move to begin.

stay tuned

Bart

charts below, let me know if you have any questions.

page_16-09-20_14-40-24 page_16-09-20_14-43-03 page_16-09-20_14-51-26 page_16-09-20_15-14-05 page_16-09-20_15-23-19 page_16-09-20_15-27-18


Update on ratio of OSX/NYA

05/31/2016

here’s an update to the BUY of the RATIO of OSX/NYA. couple things to note:

  • pattern held and note the move UP in Crude pretty much the same day the pattern hit
  • it’s not that much of a bounce …would expect it to have been bigger, especially w/ the move in Crude and the Loonie vs USD.
  • also, note the divergence in the ratio as the crude oil continued higher. this has usually led to a move lower in crude …
  • stay tuned, does this spell weakness ahead for Crude and the Loonie?

Page_16-05-31_08-25-27 Page_16-05-31_08-27-55 Page_16-05-31_08-30-04


here’s the RATIO of $OSX / $NYA. it has a buy pattern HERE or a little LOWER.

below that is crude and CAD vs USD (USDCAD inverted) overlaid on top of the ratio.

they move together

so IF this BUY pattern works THEN we have a big move coming BULLISH for Crude and the Loonie.

Page_16-01-10_21-08-29 Page_16-01-10_21-07-00

Loonie, time to get long …

I missed my entry at the .786.  (was on travel)

That’s OK …what I’ll try to do is do a real time look at getting into the first retrace.

  • Here’s the charts …
    • Relative Strength of the $OSX / $NYA.
      • note, the AB-CD is a little lower but believe we are in the zone for the PATTERN To be complete
    • Crude
      • on schedule, and look at the daily, almost perfectly on time
    • USD vs LOONIE
      • smacked exactly into the .786 and other ratio’s and has begun to strengthen …

Note: using intermarket and ratio analysis we were able to synchronize the “POTENTIAL” pivot in the Loonie, using Crude, relative strength of the OSX and then the patterns on the Loonie.

Stay tuned as this might get really interesting.

this entire thing is wrong w/ a daily closing above the .786.

I have my line in the sand, I like that.

B

Page_16-01-22_05-37-54 Page_16-01-22_05-29-46

Page_16-01-22_05-31-55 Page_16-01-22_05-33-45

continuing to work the LONG LOONIE opportunity …

folks, this one is setting up to be a doozie …

if you search my site for $OSX you’ll see we have been following this correlation w/ the LOONIE and USD for a while.  What’s the OSX telling us?  well, it sure looks to be bottoming – soon.

here ya go …

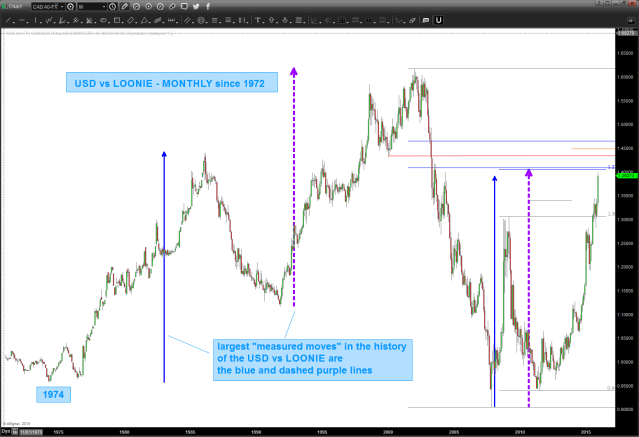
CHART 1: USD vs LOONIE
  • since the beginning of the float and going all the way back to 1972, the USD vs LOONIE has completed two measured moves. The blue and the dashed purple arrows.  they are almost the same but the purple is a little longer ….
  • note, the measured move goes right up into the 1.27 extension and the .707 retrace.
  • 1.45-1.46 could also do it BUT that goes way beyond the last measured move.
  • we should find resistance and pattern completing in/around here for this to work

usd vs loonie

CHART 2: $OSX
  • the OSX is highly correlated w/ the LOONIE vs USD.
  • we are very close to a pattern completing that would lead us to BUY the OSX
    • .786 retracement
    • 1.27 extension
    • .618 ab=cd projection from all time high
    • TIME – we are 89 months from the all time high
    • TIME – some basic cycle work shows January as a potential low
    • TIME – note, ALL of the IMPORTANT LOWS since 1974 have occurred in December
  • bullish divergence which, for me, is a big deal on a Monthly

osx

CHART 3: RELATIVE STRENGHT of the $OSX/$NYA
  • the relative strength of one security to another is done by simply dividing them … if the NUMERATOR is “stronger” then the chart goes up and vice versa.
  • the key w/ this ratio is the PERFECT SELL GARTLEY PATTERN which occurred right at the low of the USD vs LOONIE.
  • now, we have
    • measured move blue arrow coming in here to a little bit lower
    • H+S projection (taking apex to neckline and projecting) lands right on the .786
    • .786 retracement
    • 1.27 extension right on .786
    • AB=CD (dashed purple arrow) a little lower
    • bullish divergence
  • THESIS: this is coming into a BUY zone which will cause the LOONIE to strengthen

relative strenght of osx vs nya

CHART 4: Relative Strength of the OSX/NYA w/ the USD vs LOONIE (INVERTED) to show strong correlation.
correlation of loonie and osx vs nya
so, were entering a ZONE for Crude, Loonie and Oil Services Index to all pivot … stay tuned.
have a great weekend.
Bart

Loonie, the Dollar and the Oil Services Index

CLIFF NOTES: USD support for BUY opportunity shown//very important divergence present in OSX and LOONIE vs USD.  for the life of the data they have moved opposite but for the past 2 years they have rolled together.  while they have lead/lagged they have, essentially, been doing the opposite at tops and bottoms.  When one tops the other bottoms and vice versa.

april 01 2014 CAD big low april 01 014 cad polarity april 01 cad buy

so, at times, one could look to the Oil Service Sector and see if a BUY or SELL pattern completed and then look for the opposite pattern to appear on the Loonie vs the USD.  For two years that has not been the case .. they are moving together.  They could roll together into infinity but something certainly doesn’t make sense …

Main20140401092100 Main20140401093154

so compare the commodity currencies (AUD/NZD/CAD) against each other ….BOOM a beautiful SELL PATTERN on the AUDCAD

Main20140401093637

CLIFF NOTES: Loonie “should” strengthen against the AUSSIE

how about CNZDCAD? not suprising — KIWI is kicking everyones butt right now … it’s at an all time high against the LOONIE w/ strength.

GBPCAD:

Main20140401094120


EURCAD:

Main20140401094403

CHFCAD:

Main20140401094633


CADJPY

Main20140401094955

Main20140401095216

Crude, the Loonie and Oil Services Index for 2014

the chart below shows the Oil Services Index $OSX (candles) w/ USDCAD (inverted/line) overlaid on top …

some observations:

  • when the blue line (Loonie) is going down it is weak.  when the blue line (Loonie) is going up it’s strong …
  • at most inflection points, the $OSX and Loonie are synchronized nicely. however, for most of 2013 this relationship has diverged.  in that, while one was going UP (Oil Services Index) one was going down (Loonie weak)
  • the Loonie topped a good 6 months prior to the $OSX in 2007-2008.  However, once they synced they got smashed …
  • the 2009 bottom was well synchronized and since then they have move very nicely together.
$OSX and USDCAD
$OSX and USDCAD

below, we have added (black line) Crude Oil to the chart and, as expected, it is very synchronized w/ $OSX EXCEPT since September 2013.  Note, the $OSX has held up, nicely.  What is this $OSX?

Oil Services, Loonie and Crude

The OSX tracks 15 large companies w/in the context of the Oil Services world …Changes in the Philadelphia Oil Service Sector Index tend to be associated with changes in the oil and gas markets, since greater exploration and construction of wells occurs when oil prices are high and less such activity is carried on when prices are lower.  They were all affected by the Gulf of Mexico Oil spill …

so first let’s go thru the 15 components and look for big picture patterns – BUY or SELL.

Main20131229105932 Main20131229105303 Main20131229105422 Main20131229105523 Main20131229105641 Main20131229105754 Main20131229105836

so, as we can see, there are some nice SELL patterns coming in, there are a couple weak ones and where I didn’t post any charts there wasn’t a glaring pattern to be seen.  Bottom line – I’m not seeing significant strength in the index but to elevate some of the stocks to hit their targets perhaps we’ll see some more strength.  so, now we need to break down each individual component …

Crude Oil: http://bartscharts.com/2013/10/31/crude-oil-a-potential-roadmap/ this was my last post.  I am still in the “look and feel” phase that the top at 147 was a 3 and the low in/around 35 was a 4.  while the pattern completing at 110 was good, the thrust off this bottom trend line last week led me to see a triangle where we can see a,b,c,d,e – triangle complete and off to a new high ?  CRUDE BULLISH

Crude Oil
Crude Oil

USD vs CAD: just a little bit higher (200 pips) we have some pretty major targets.  while I am a DOLLAR BULL, also recognize that the Loonie is a small percentage of the overall index.  LOONIE BULLISH (after a little more weakness)

CAD vs USD
CAD vs USD

Oil Services Index: the only thing “wrong” w/ this chart is that, a RULE of counting is 4 cannot go below 1.  In this case it does,  However, the Crude chart spikes thru but never closes below.  so, I am keeping this count.  Note, we smacked right into the .618 price projection area at/around 294 and are testing it again.  the 306-307 level will be key.

So, our roadmap to follow is:

  • Crude – breakout of triangle.
  • Loonie – BUY a couple hundred pips lower
  • Oil Services – break thru – with strength and conviction (read volume) levels show

one last, this is something to be patient w/ …. I would not recommend jumping all over this tomorrow but wait and see these levels get attacked … the GREAT thing about PATTERNS is we now have clear lines in the sand for where we are correct or wrong. Go back to the beginning of the post – w/ that divergence between the OSX and CAD-Crude the patterns will tell us which way this entire family (Crude, OSX, CAD) will resolve.  It very well could go completely opposite but not until the pattern levels are targeted.  they will either work or fail and then we’ll pounce

Part IV and “your time is gonna come”

this is the Part IV post from a couple months ago:

http://bartscharts.com/2013/09/15/part-iv-sp-and-energy/

this energy sector needs to be watched … the OSX, XOI, XLE are painting  the same picture as they have gone up in the context of targets that have now been hit or are completing just a little higher. Crude, however, has been pretty weak … not widely reported is the fact that the Administration basically lifted economic sanctions on Iran so perhaps they are flooding the markets w/ their oil…who knows and that’s not for me to conjecture.

however, in the context of the S&P energy does make up roughly 10% of the index so, in order for the index to start moving lower we will need to see these patterns complete and start down.  they HAVE NOT yet …but they are basically in the zone

November 10 2013 XOI November 10 2013 OSX November 10 2013 Crude November 10 2013 XLE