continuing to work the LONG LOONIE opportunity …
folks, this one is setting up to be a doozie …
if you search my site for $OSX you’ll see we have been following this correlation w/ the LOONIE and USD for a while. What’s the OSX telling us? well, it sure looks to be bottoming – soon.
here ya go …
CHART 1: USD vs LOONIE
-
since the beginning of the float and going all the way back to 1972, the USD vs LOONIE has completed two measured moves. The blue and the dashed purple arrows. they are almost the same but the purple is a little longer ….
-
note, the measured move goes right up into the 1.27 extension and the .707 retrace.
-
1.45-1.46 could also do it BUT that goes way beyond the last measured move.
-
we should find resistance and pattern completing in/around here for this to work
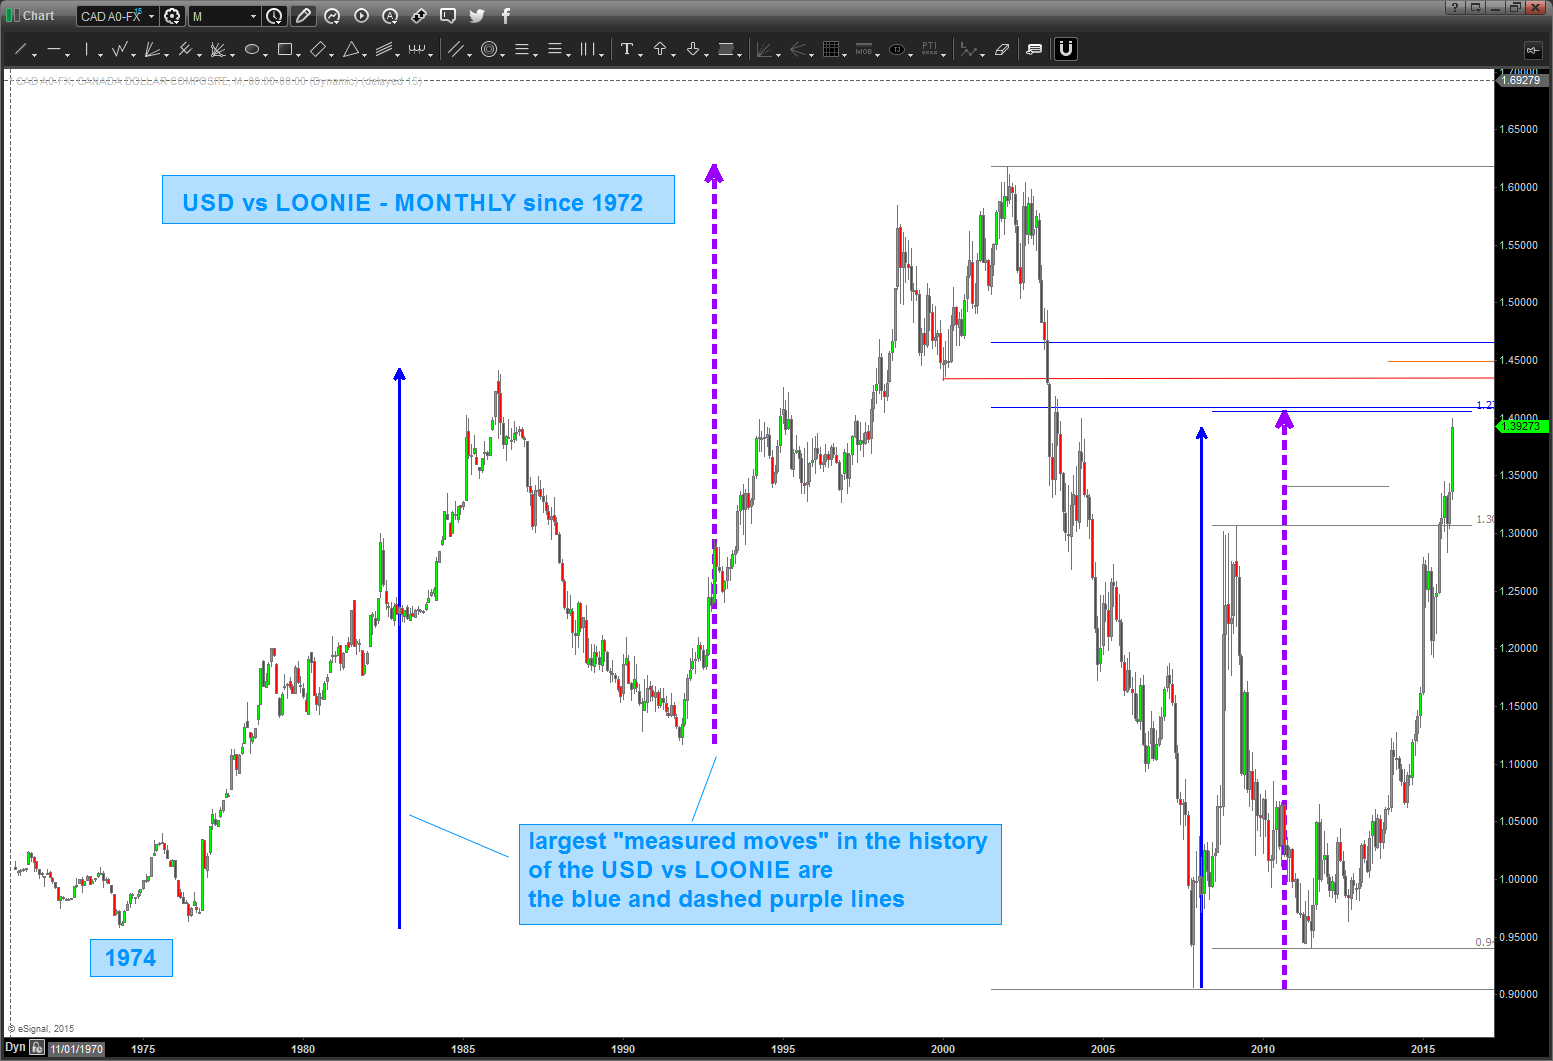
CHART 2: $OSX
-
the OSX is highly correlated w/ the LOONIE vs USD.
-
we are very close to a pattern completing that would lead us to BUY the OSX
-
.786 retracement
-
1.27 extension
-
.618 ab=cd projection from all time high
-
TIME – we are 89 months from the all time high
-
TIME – some basic cycle work shows January as a potential low
-
TIME – note, ALL of the IMPORTANT LOWS since 1974 have occurred in December
-
-
bullish divergence which, for me, is a big deal on a Monthly
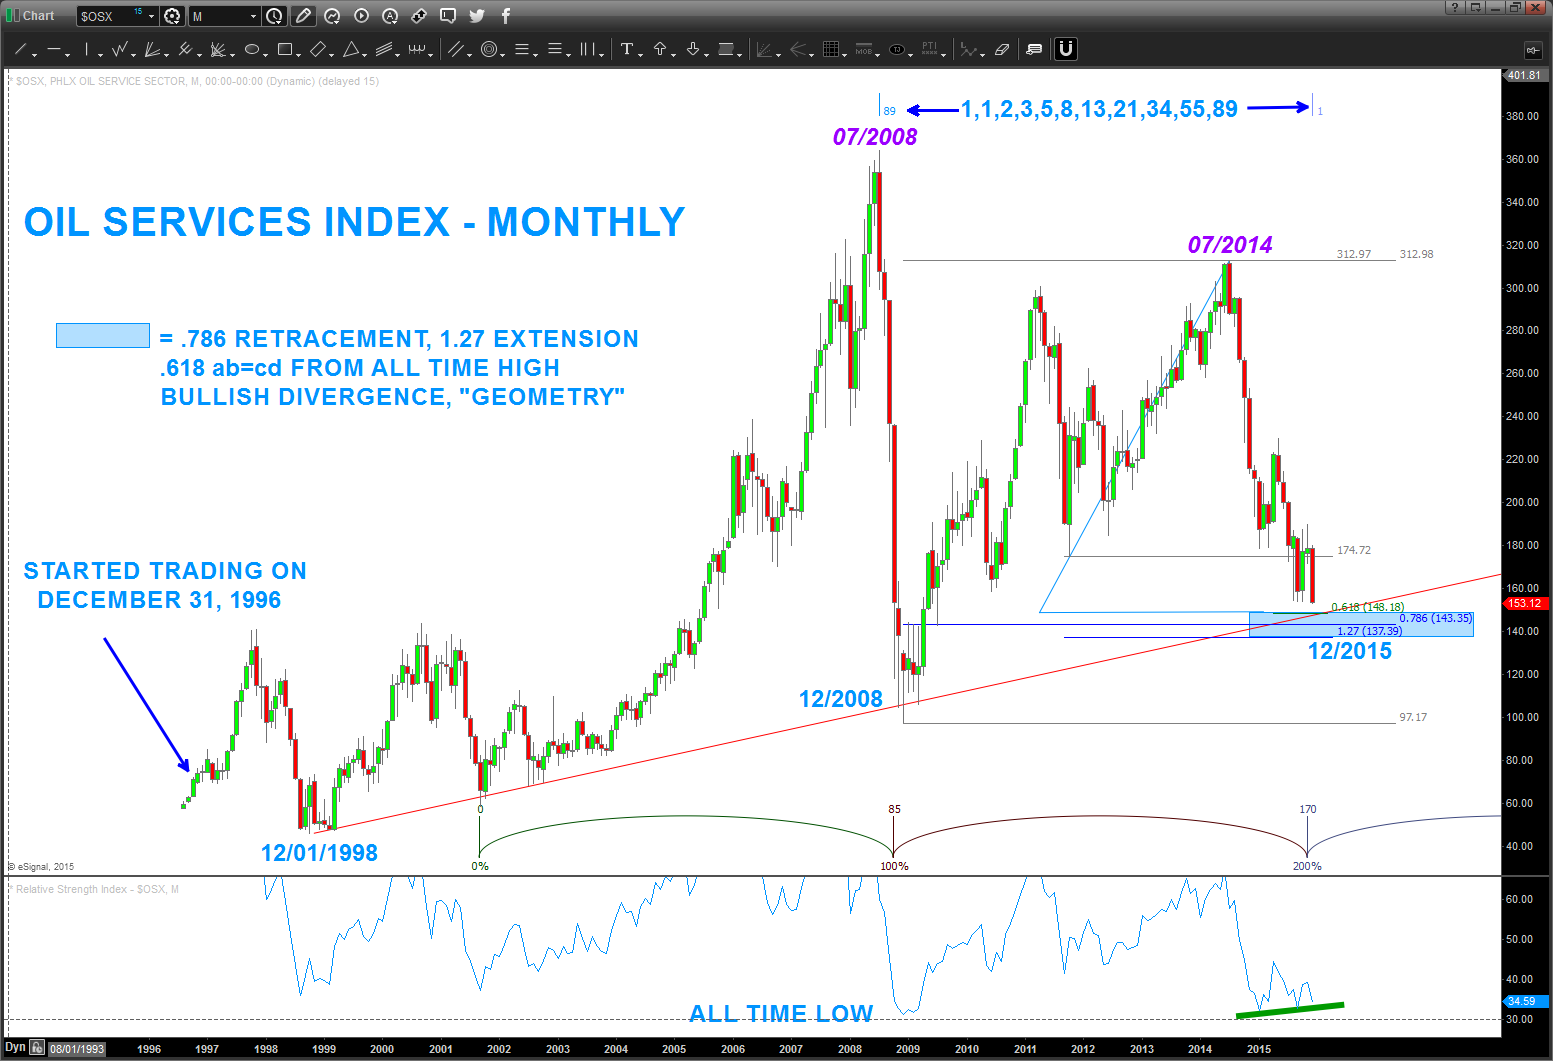
CHART 3: RELATIVE STRENGHT of the $OSX/$NYA
-
the relative strength of one security to another is done by simply dividing them … if the NUMERATOR is “stronger” then the chart goes up and vice versa.
-
the key w/ this ratio is the PERFECT SELL GARTLEY PATTERN which occurred right at the low of the USD vs LOONIE.
-
now, we have
-
measured move blue arrow coming in here to a little bit lower
-
H+S projection (taking apex to neckline and projecting) lands right on the .786
-
.786 retracement
-
1.27 extension right on .786
-
AB=CD (dashed purple arrow) a little lower
-
bullish divergence
-
-
THESIS: this is coming into a BUY zone which will cause the LOONIE to strengthen
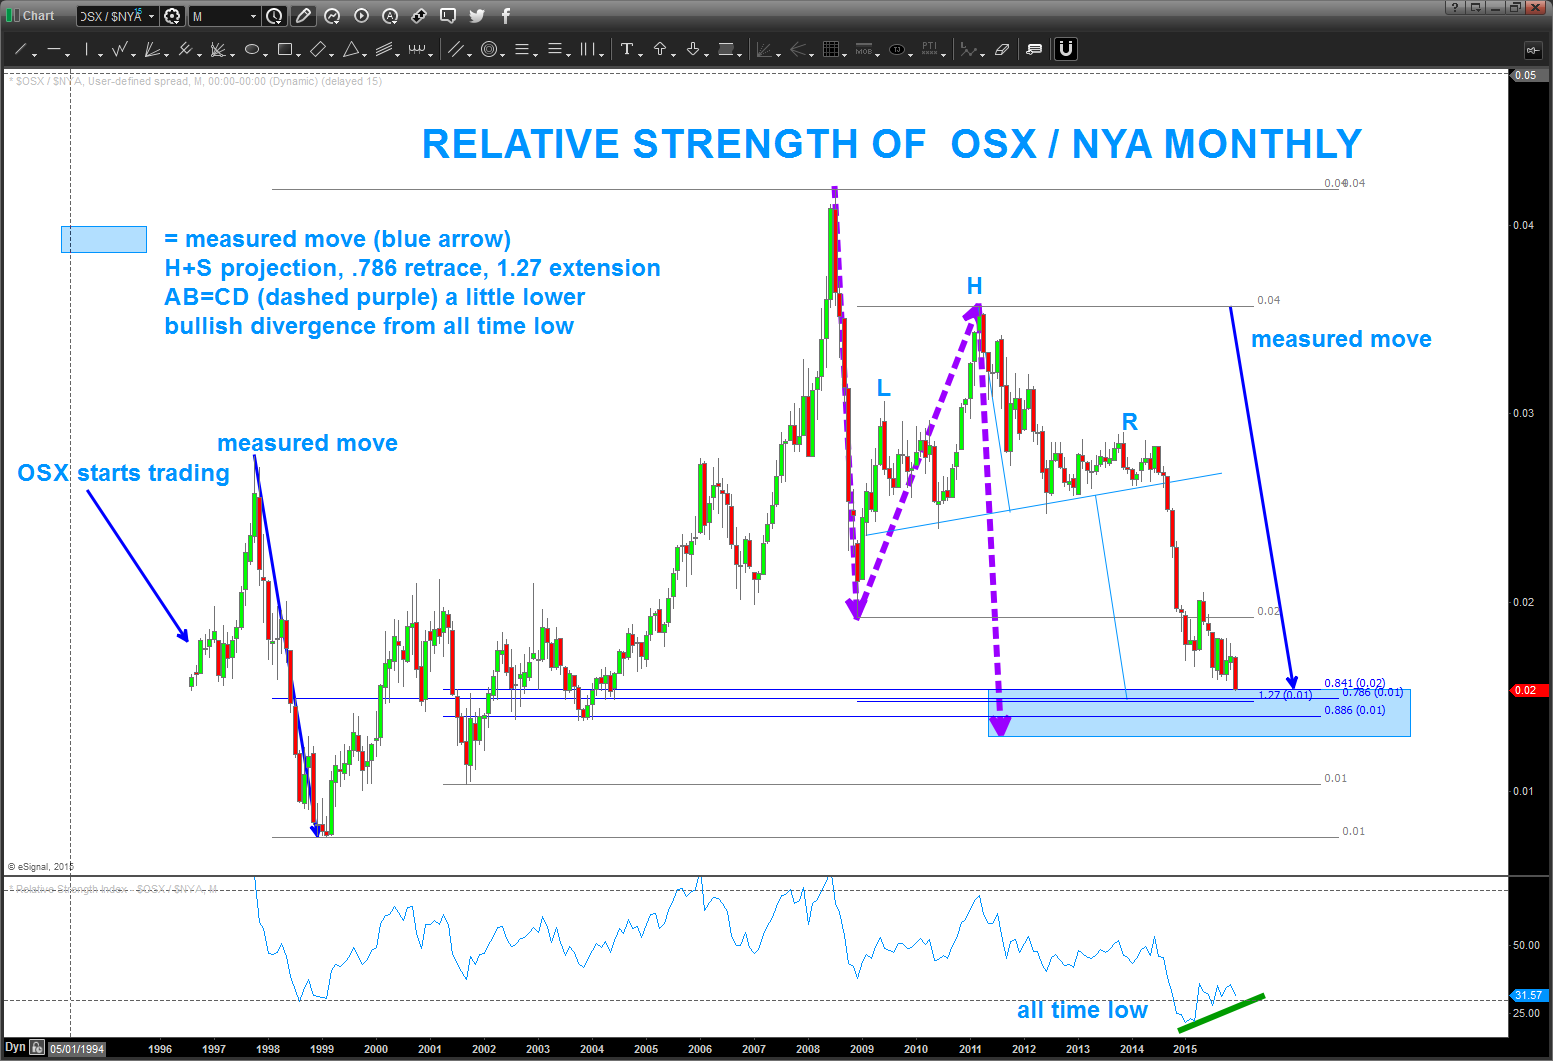
CHART 4: Relative Strength of the OSX/NYA w/ the USD vs LOONIE (INVERTED) to show strong correlation.
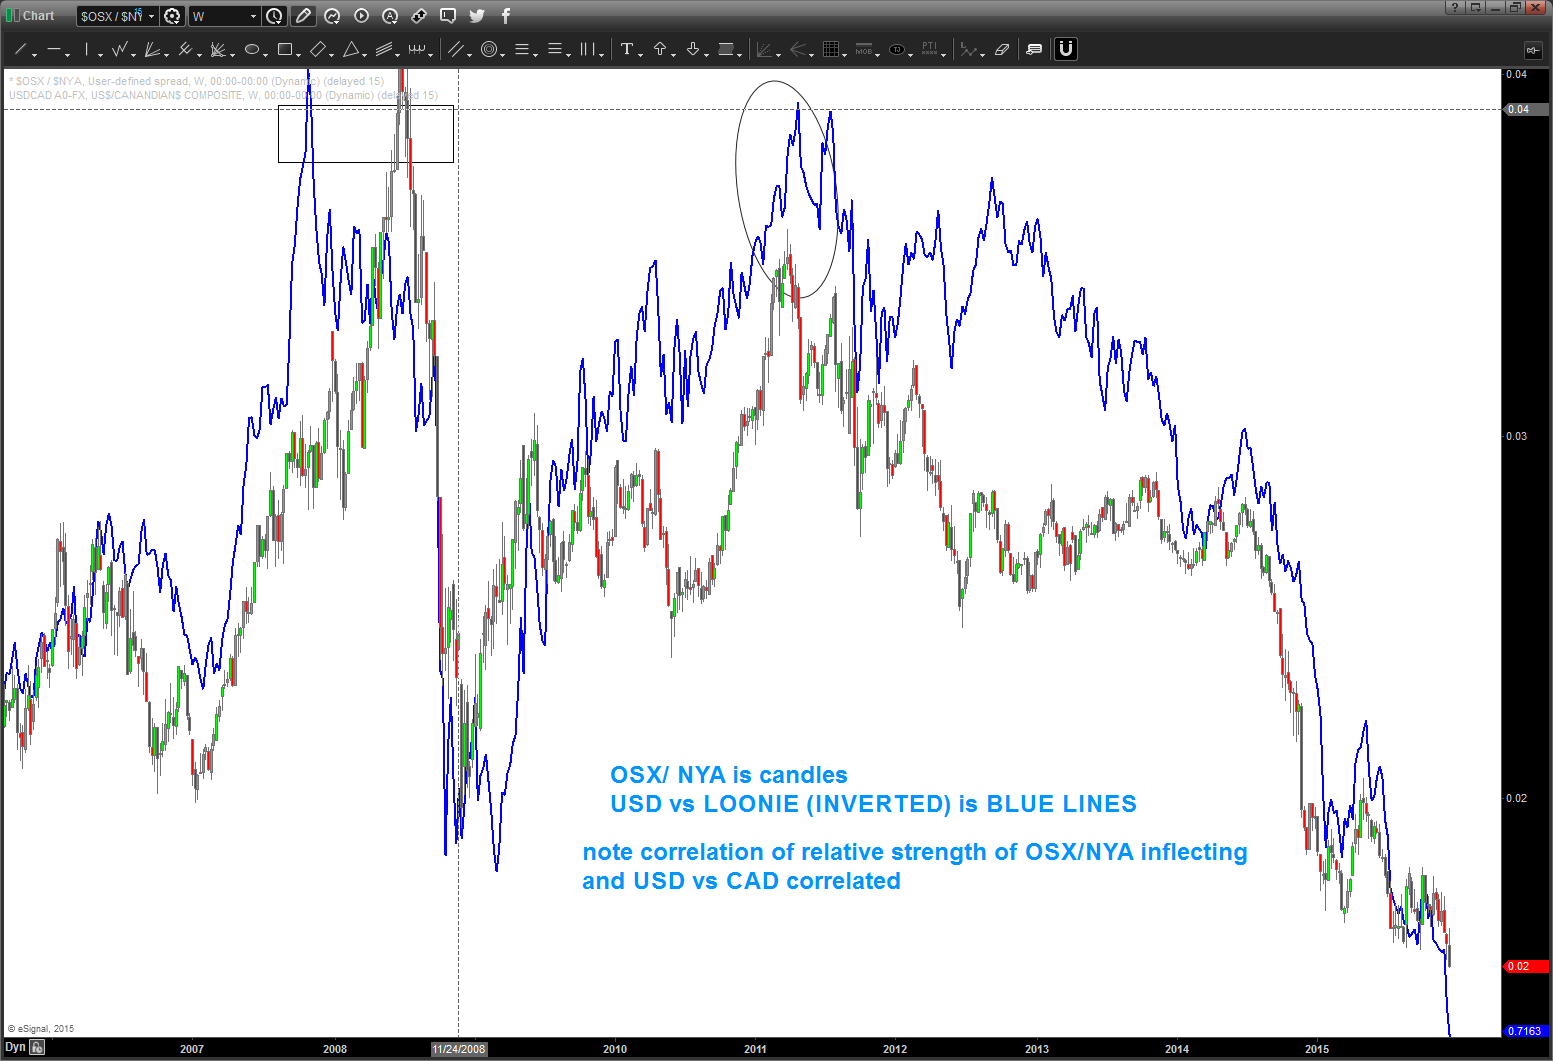
so, were entering a ZONE for Crude, Loonie and Oil Services Index to all pivot … stay tuned.
have a great weekend.
Bart
