Part IV: S&P and Energy
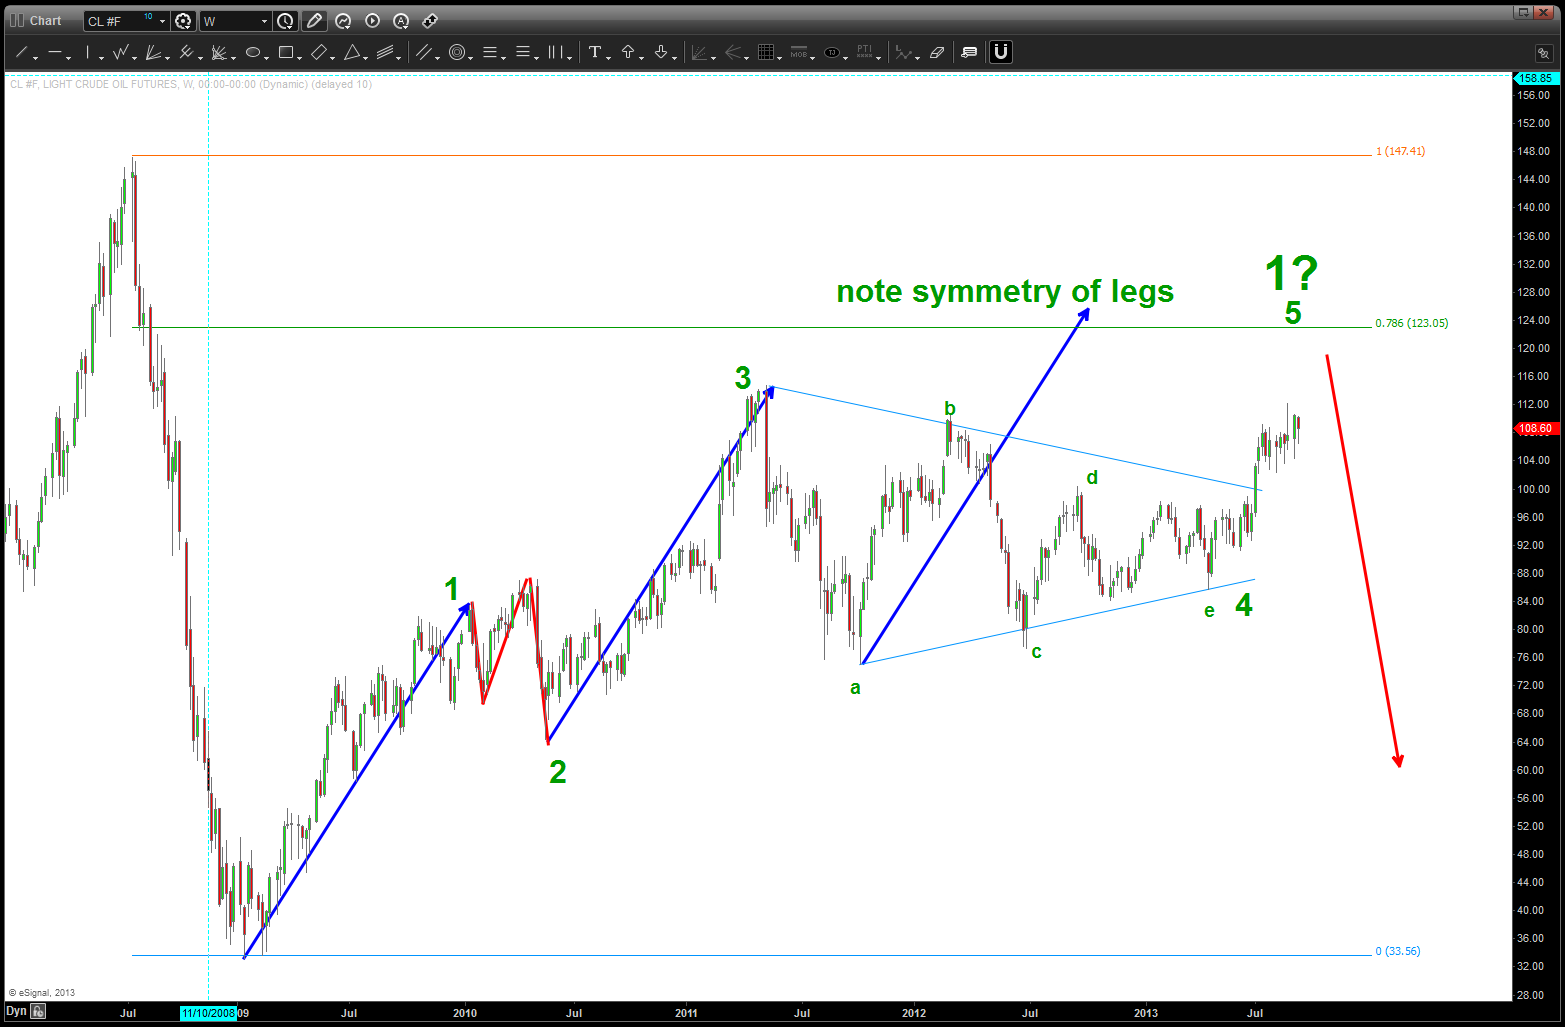
Below is one of my all time favorite charts … it’s a real time chart of the EXACT top in Crude Oil using a bunch of geometry, music and numbers.
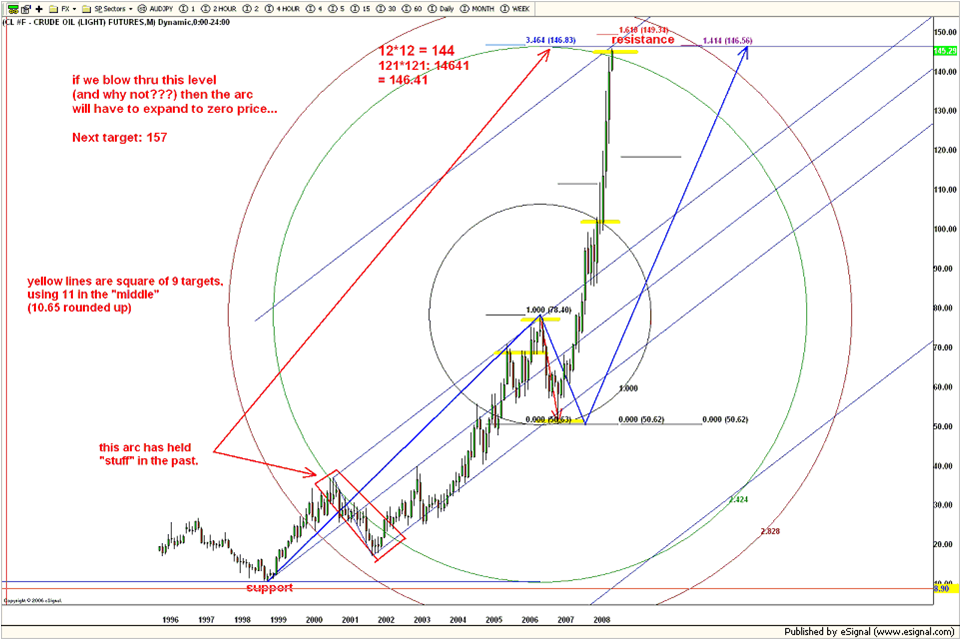
Exact high on crude oil …
in this chart we see the square root of 12 (3.464), natural squares 121*121, geometrical arcs, 2.424 (12*2/12*2), square of nine targets, square root of 2 (1.4142) and an Adams Pitchfork expansion. Even w/ all of the math coming out, you can still see by commentary that it still could have blown thru …remember it was parabolic.
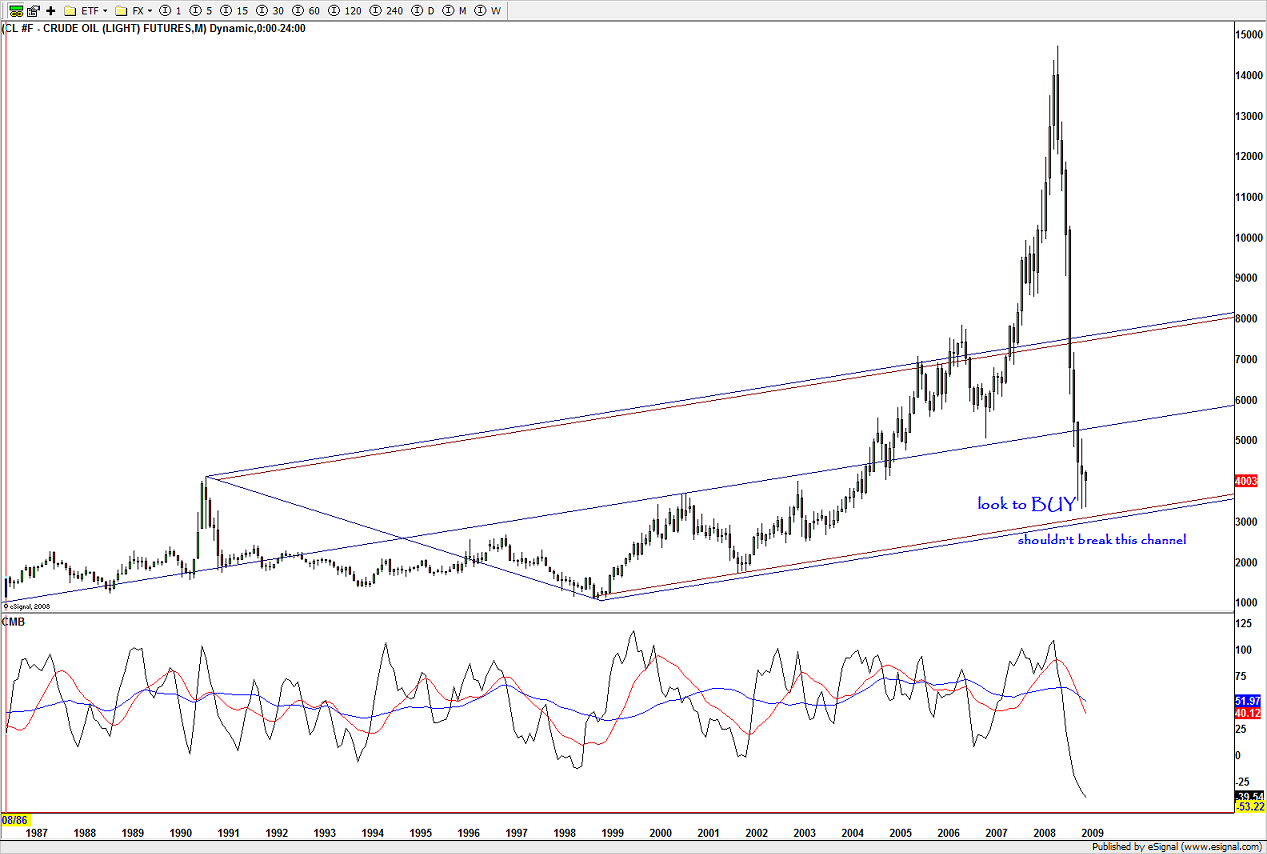
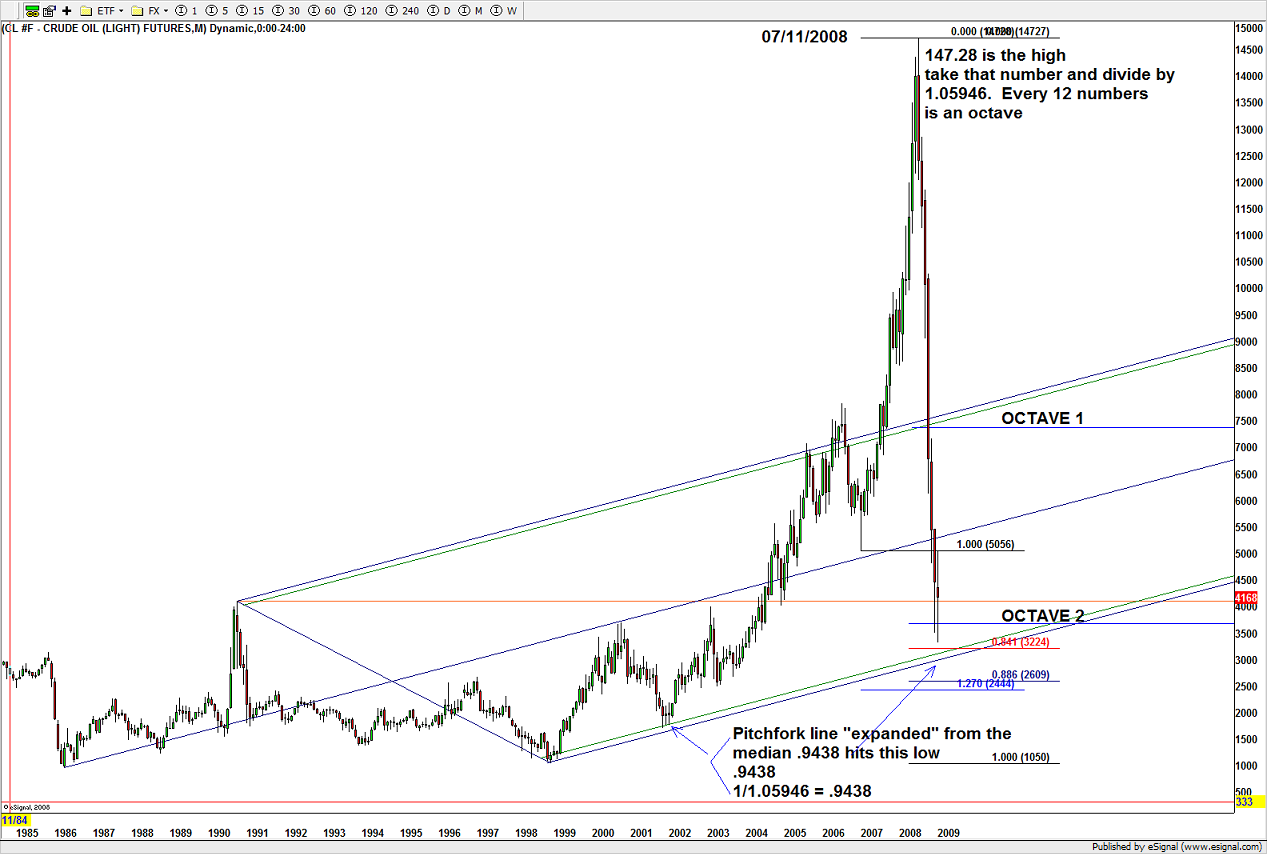
after the high was in place it fell like a stone to this level:
here’s the possible count and notice the 36 area was being targeted. that was basically since it had gone parabolic it would “probably” go down to the beginning of wave 1. Also, talk about cool and synchronicity – the exact high was on my birthday. How ’bout them apples?
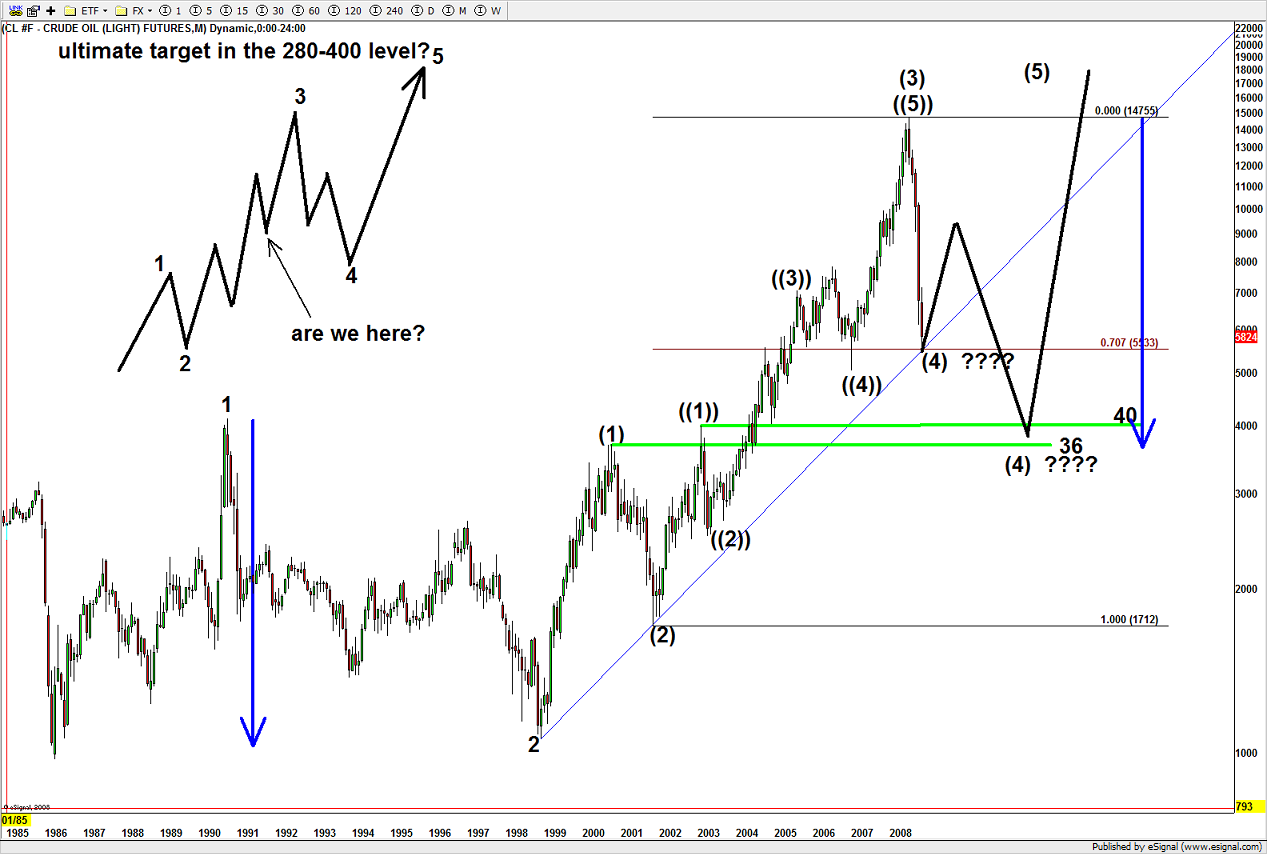
I still like this count and believe it’s valid. Note, the pullback never came — fell like a stone to expected level
take a look at the above – note, it is a log chart and the two blue arrows will show the same correction in terms of percentage …hence, this is a very powerful way to look for targets as the move is working …just an fyi. try it, you might like it ….Mikey sure did!
below is the Oil Services Index and note the last wave (e) forecasted to complete and then higher.
Oil Services Index Before …
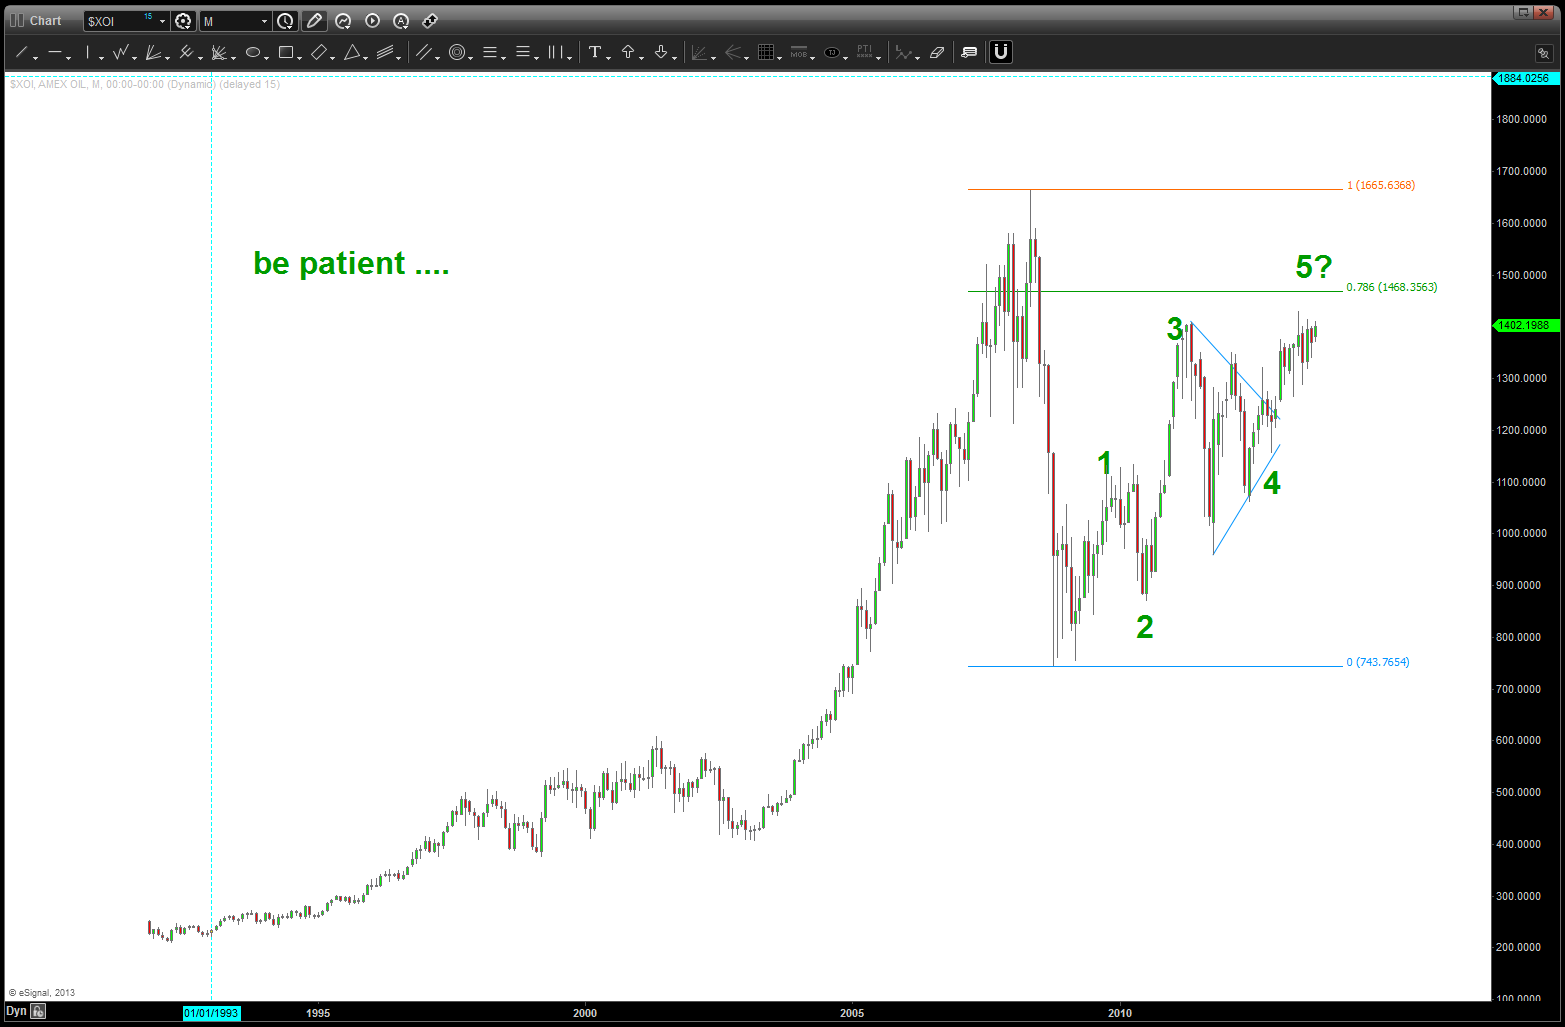
AMEX OIL index after …
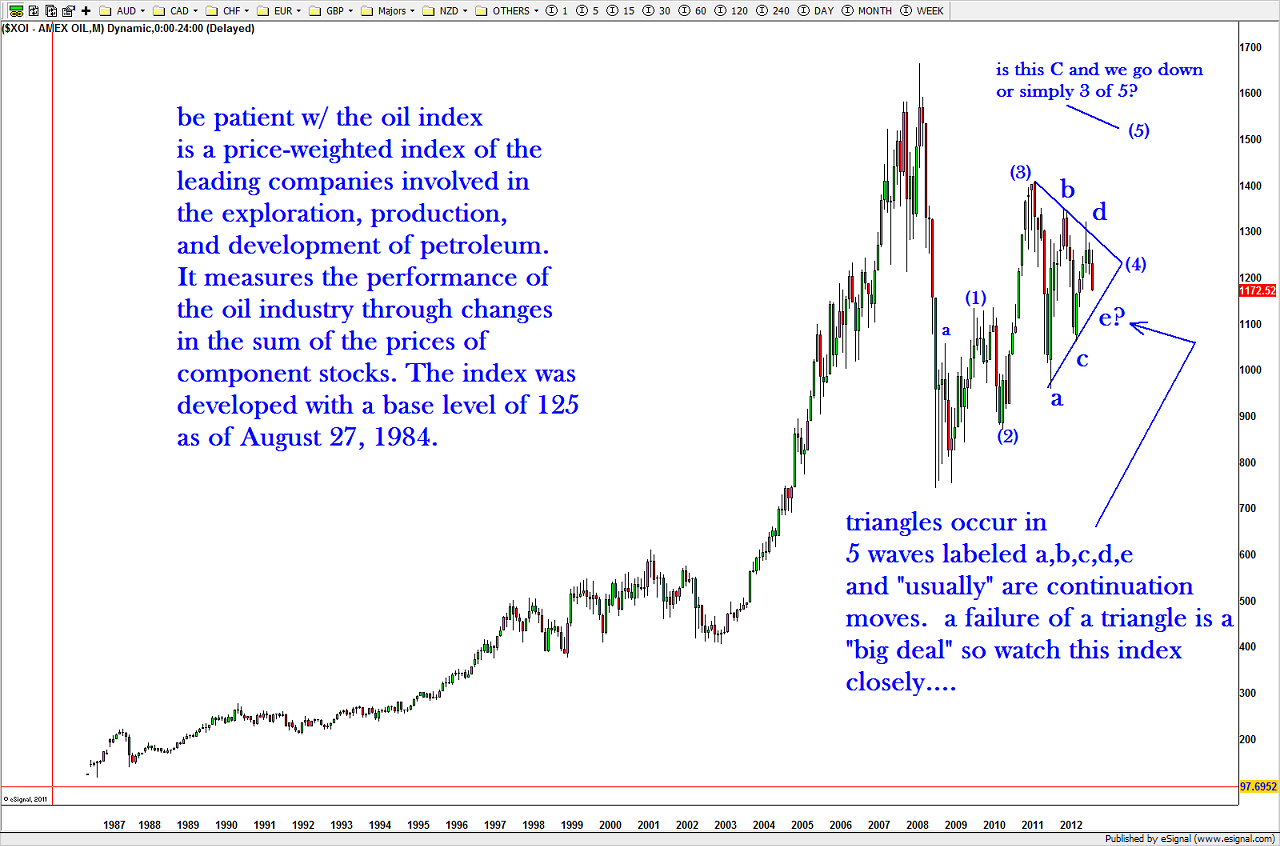
remember the AMEX OIL INDEX ($XOI) is is a price-weighted index of the leading companies involved in the exploration, production, and development of petroleum. It measures the performance of the oil industry.
here’s the Oil Services index ($OSX)
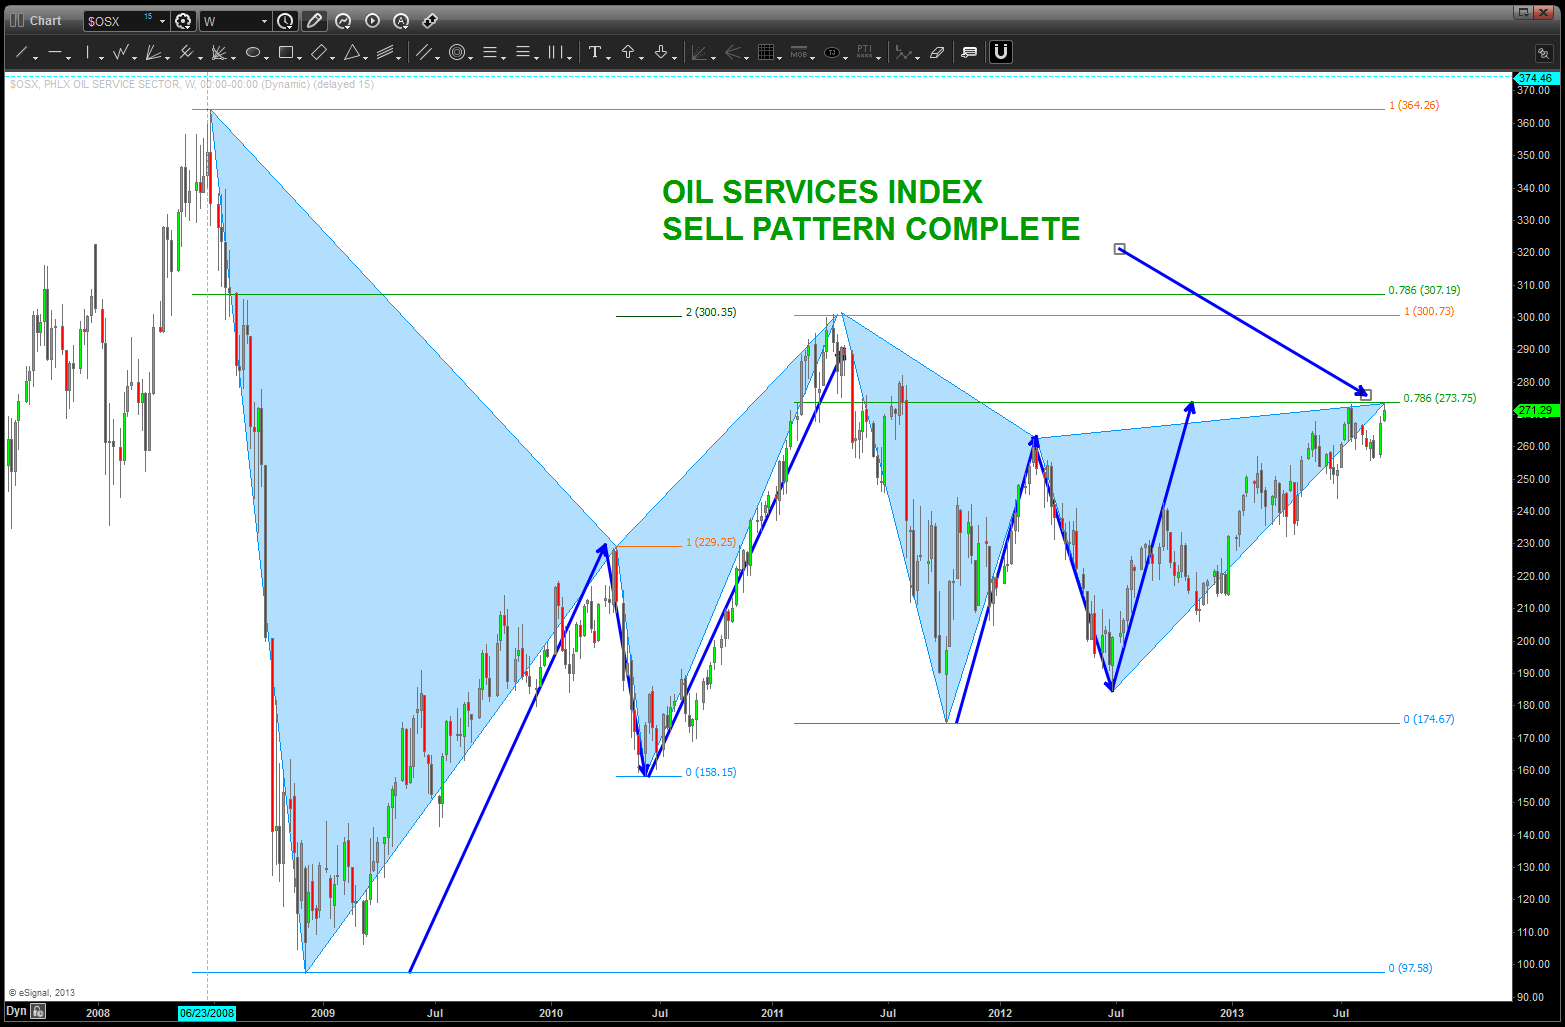
note the pattern that has completed and is being tested, again. this will be key, IMHO
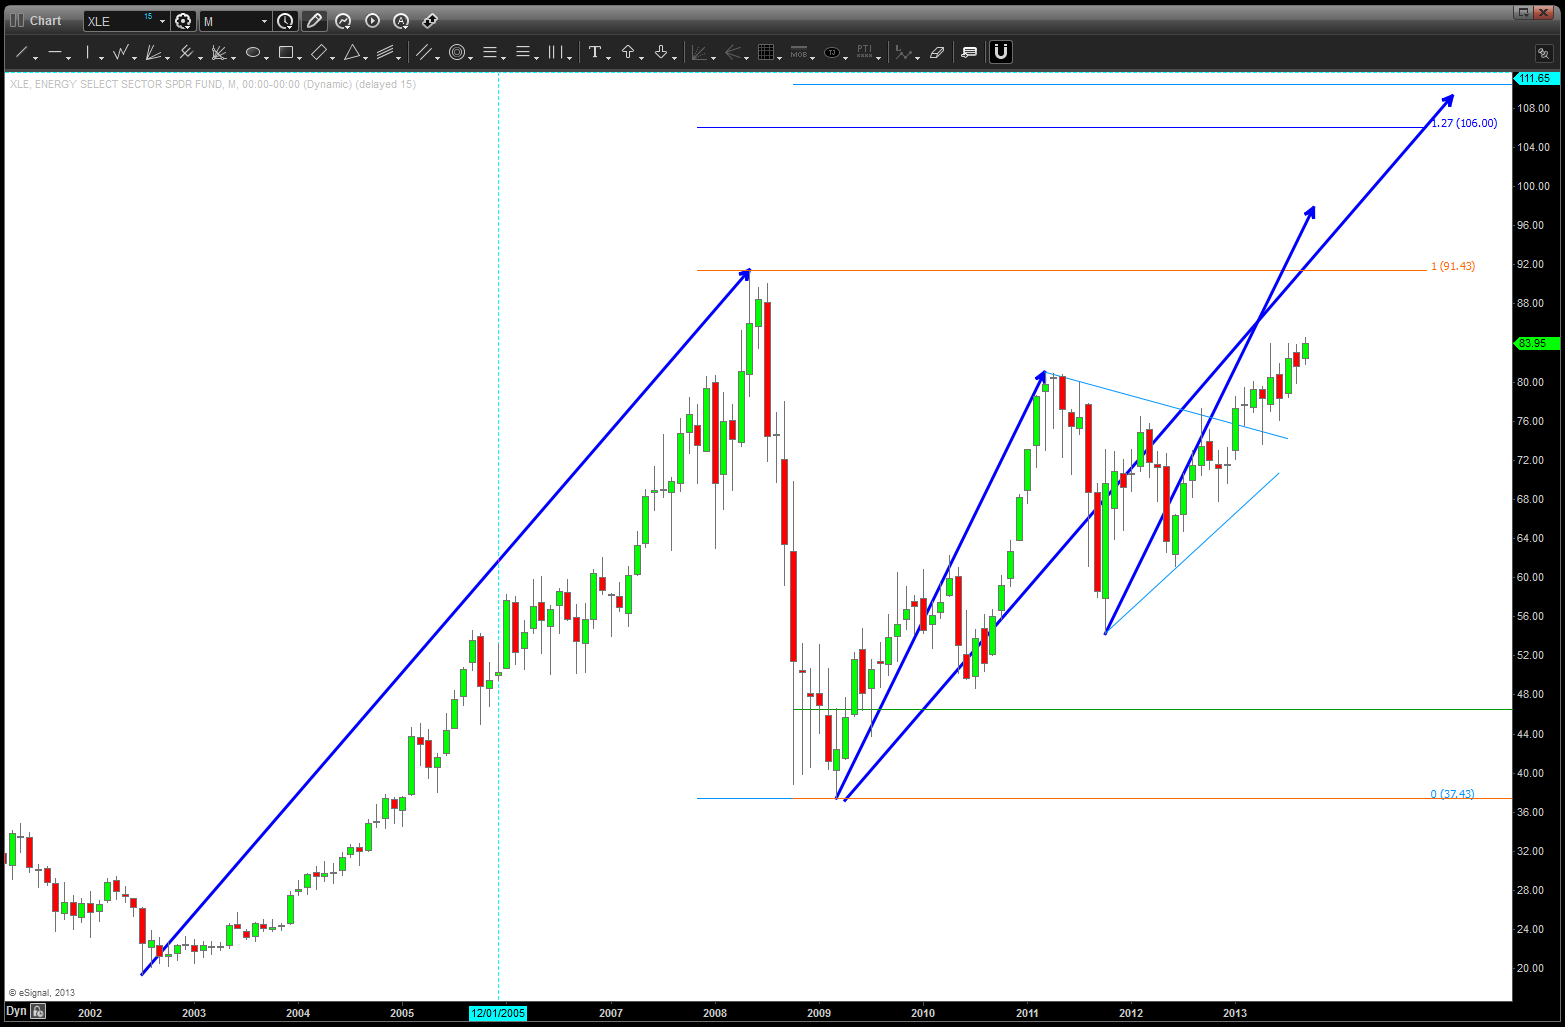
and, finally, a picture of crude oil and the XLE (energy sector ETF)
Crude sure looks like it wants to go to the .786 to complete our pattern and the XLE should attack the highs and targets depicted
So, in summary, looks like we have “another” piece of the S&P 500 jig saw puzzle that wants to go a little higher before major patterns should be complete. Stay tuned ….
BART

Pingback: Part 2 of Part 1-V on the S&P | Bart's Charts
Pingback: Part IV and “your time is gonna come” | Bart's Charts