Part 2 of Part 1-V on the S&P
Part 1 was a look around the world at different equity indices based on ETF’s:
https://bartscharts.com/2013/09/14/part-1-the-sp-500-but-first-we-need-to-go-around-the-world/
of note is the Global Equity ETF (ACWI) and the SELL pattern that is appearing as we showed in our last “around the world” update shown below. Overall, nothing to crazy but the analysis appears to have been correct. Summary: NONE of the “around the world” indices have come even close to making new highs from the 2007-2008 time frame.
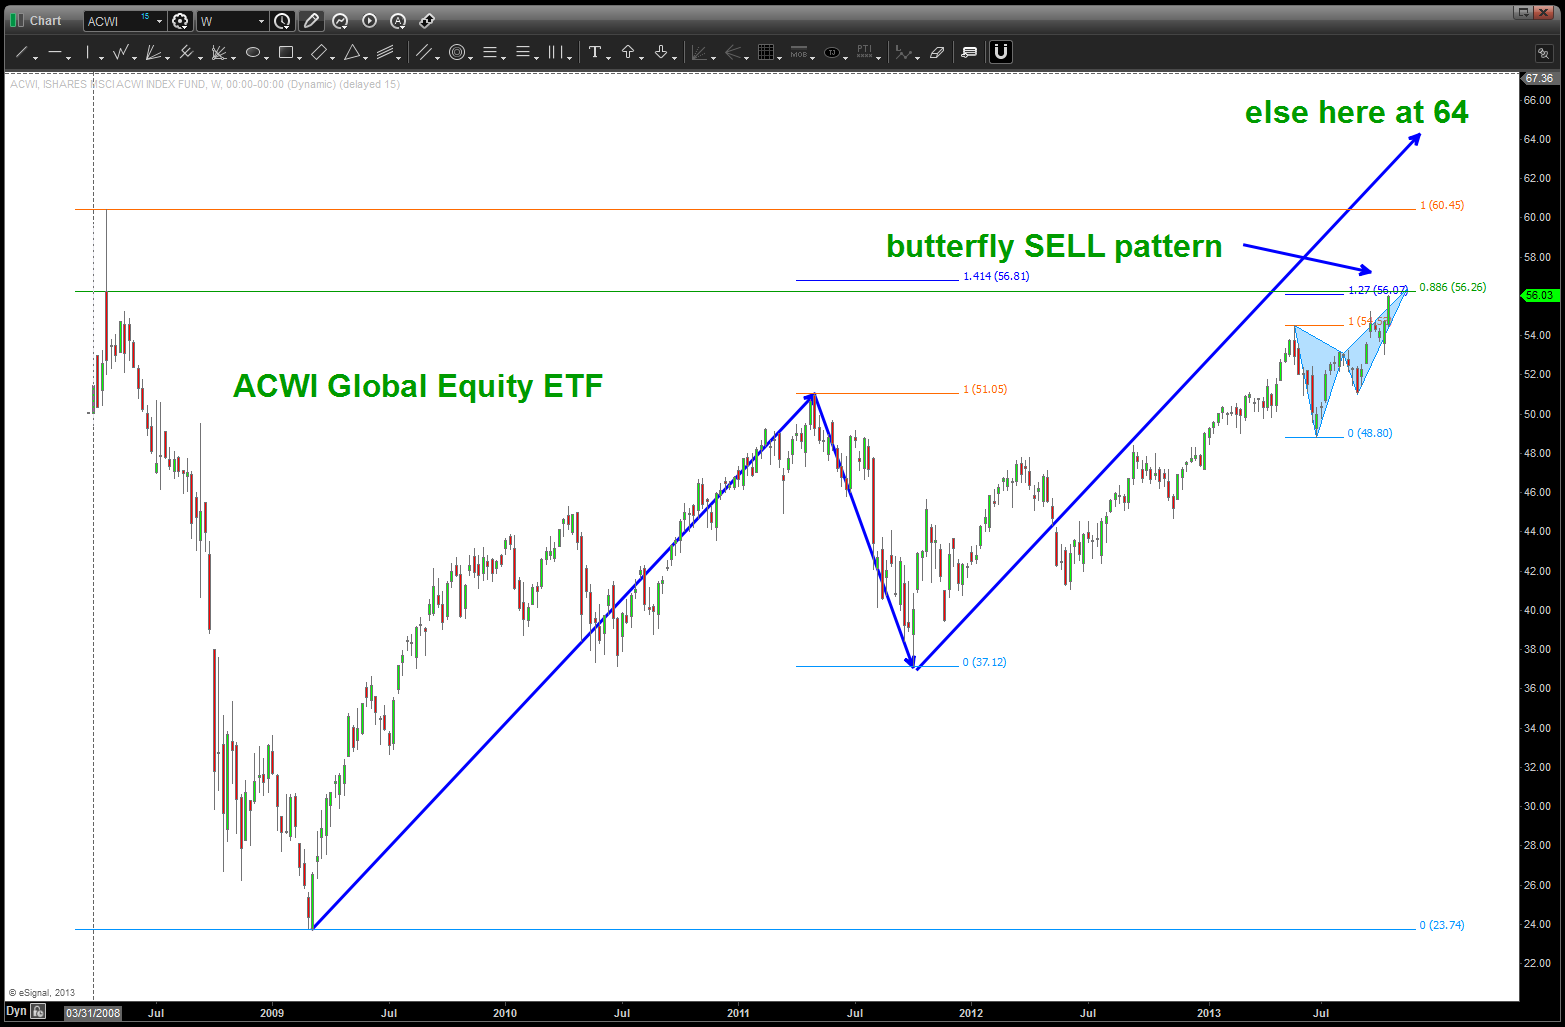
ACWI Butterfly Sell Pattern
Part 2 was the banks and too big to fail:
https://bartscharts.com/2013/09/14/part-ii-the-sp-500-and-too-big-to-fail/
The targets w/in the 21-22 area are approaching … the XLF is close to being a sell if not already one.
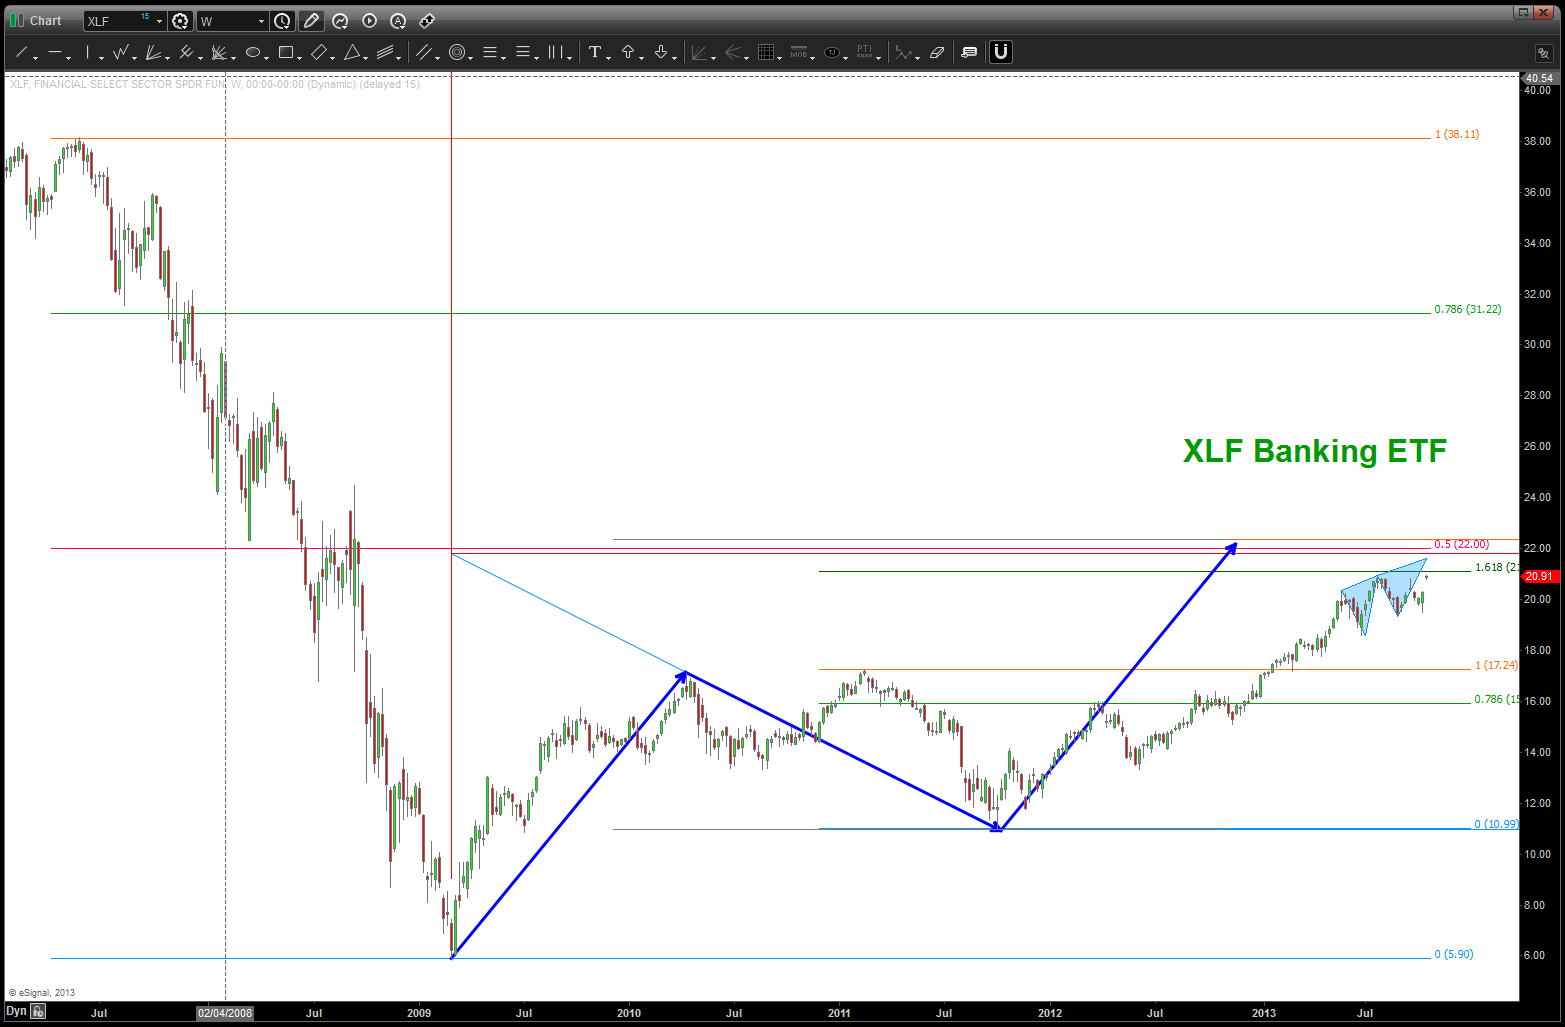
XLF update
Part 3 took a look at technology:
https://bartscharts.com/2013/09/14/part-iii-the-sp-500-and-the-influence-of-technology/
Palladium has an extremely nice sell pattern and multiple patterns were hit or are about to hit …NASDAQ futures have an extremely strong target and sell pattern coming in right here, right now
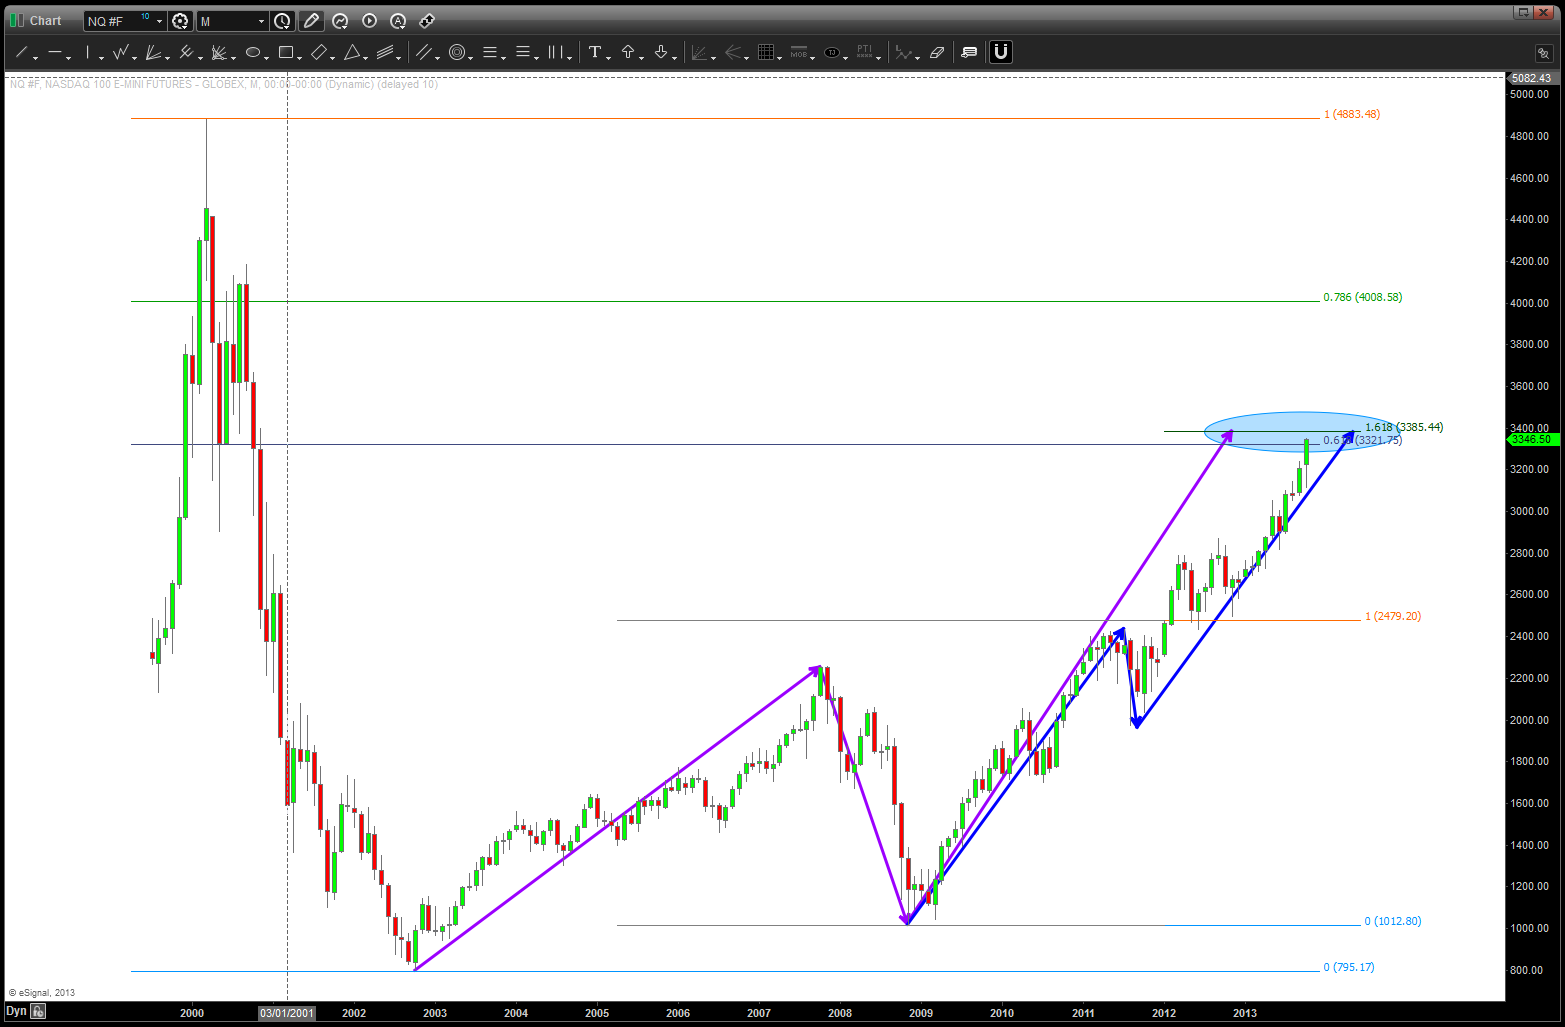
NAZZIE Futures Continuous Contract
Part IV was energy
https://bartscharts.com/2013/09/15/part-iv-sp-and-energy/
this is the one sector that isn’t showing a clear SELL signal – yet. As you can see below w/ the XLE a case can be made for another 10% higher or it needs to start down now…energy could be the one sector that holds this puppy up for now.
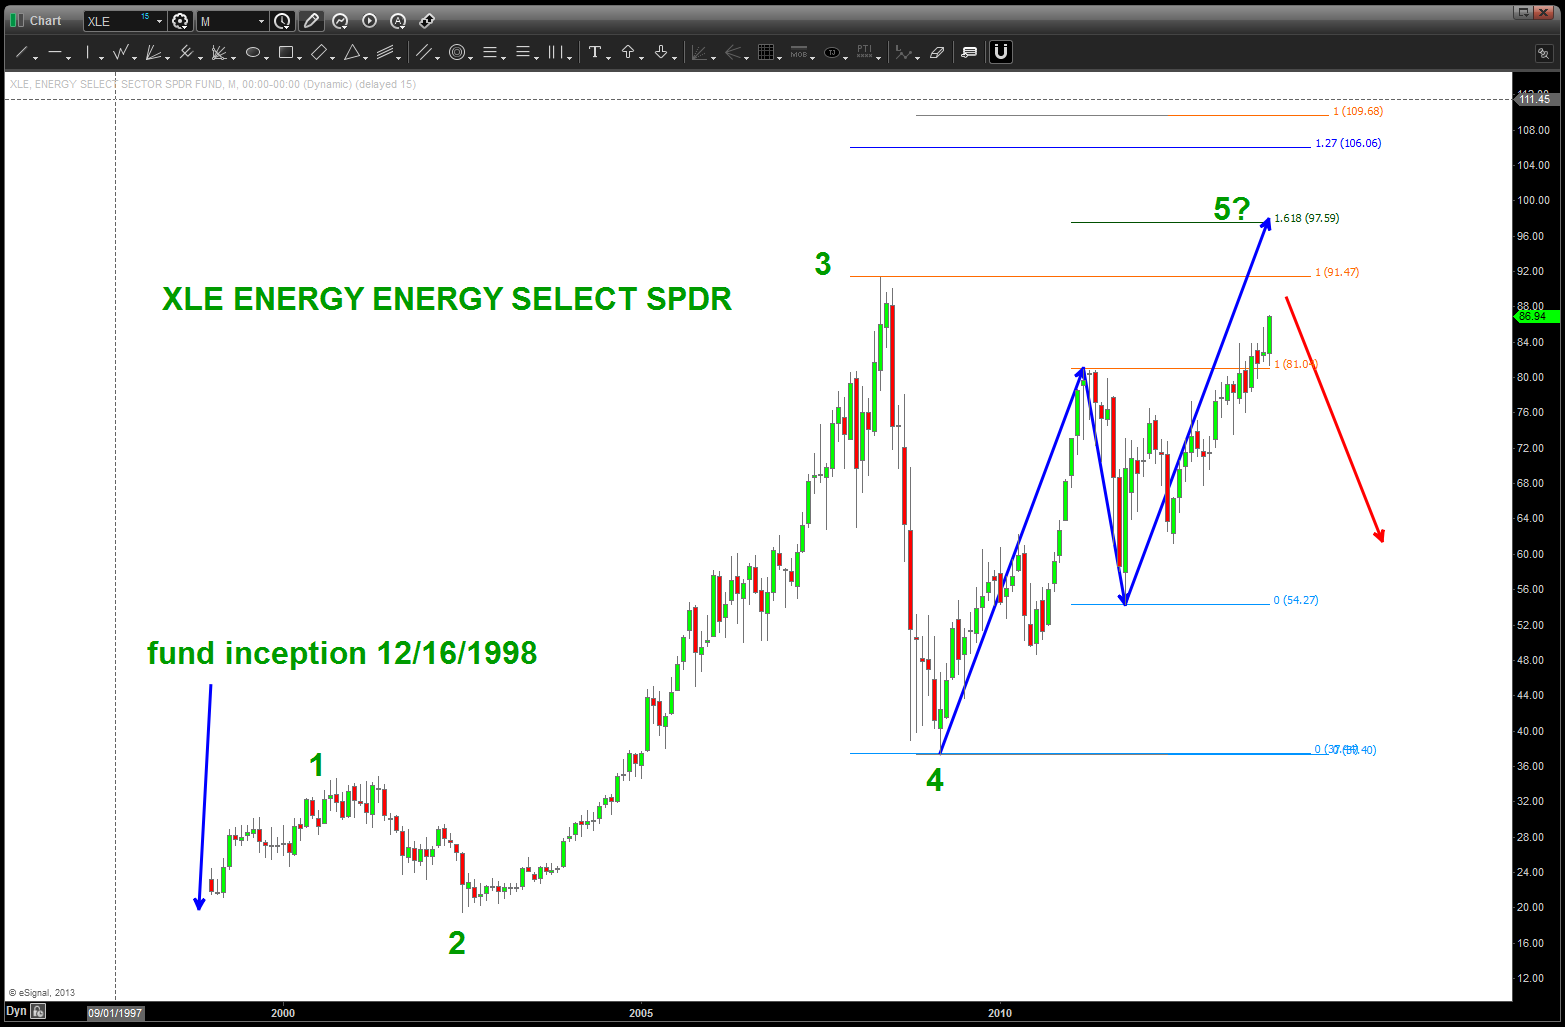
Energy, a case could be made for continued strength thereby delaying the move down in the S&P
and finally, part V was the look at ratio’s and sector rotation:
https://bartscharts.com/2013/09/16/part-v-sp-and-sector-rotation/
the pattern has completed perfectly and even w/ the S&P making new highs, this pattern has held …. this is bearish for the overall equity market.
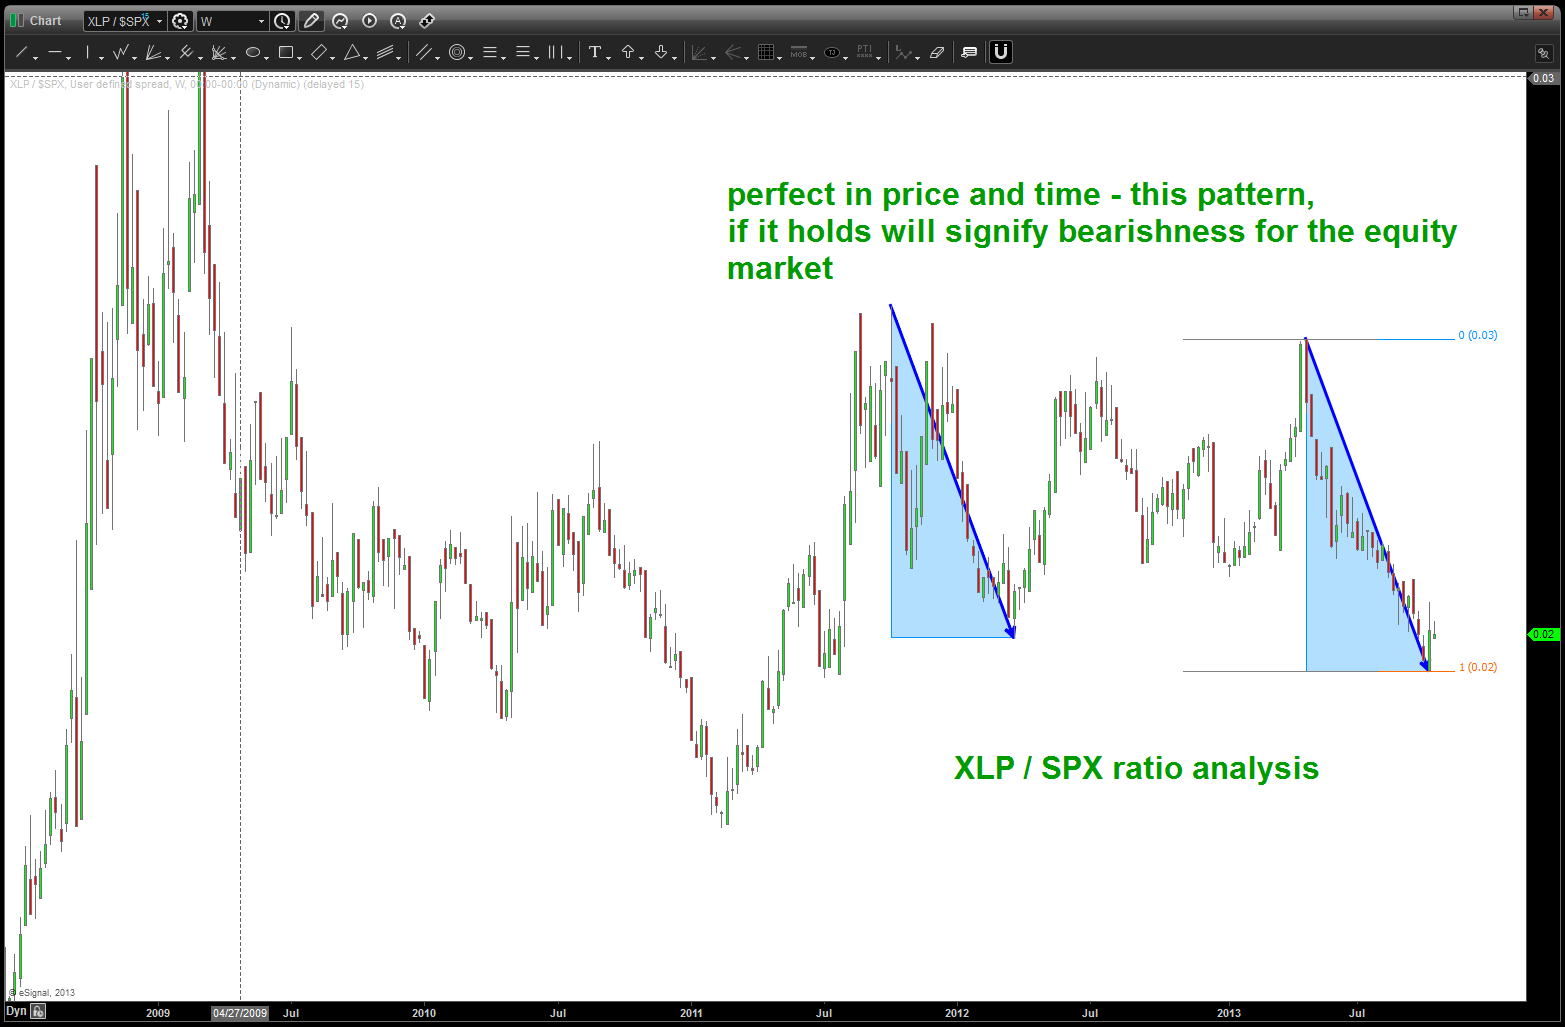
a turn in this ratio has been present at EVERY major inflection point since 2000. a BUY in the ratio is a SELL in equities
CONCLUSION:
ACWI, XLF, NAZZIE, SELL pattern complete/completing.
XLP/SPX ratio showing a beautiful BUY (SELL equities) pattern …
US DOLLAR low in here or perhaps a little lower
ENERGY needs to be watched like a hawk….
Do you really want to be long this market? The only way I would stay LONG is if all the above fails and, quite frankly, that could happen. So, watch ENERGY and DOLLAR strength for first clues.
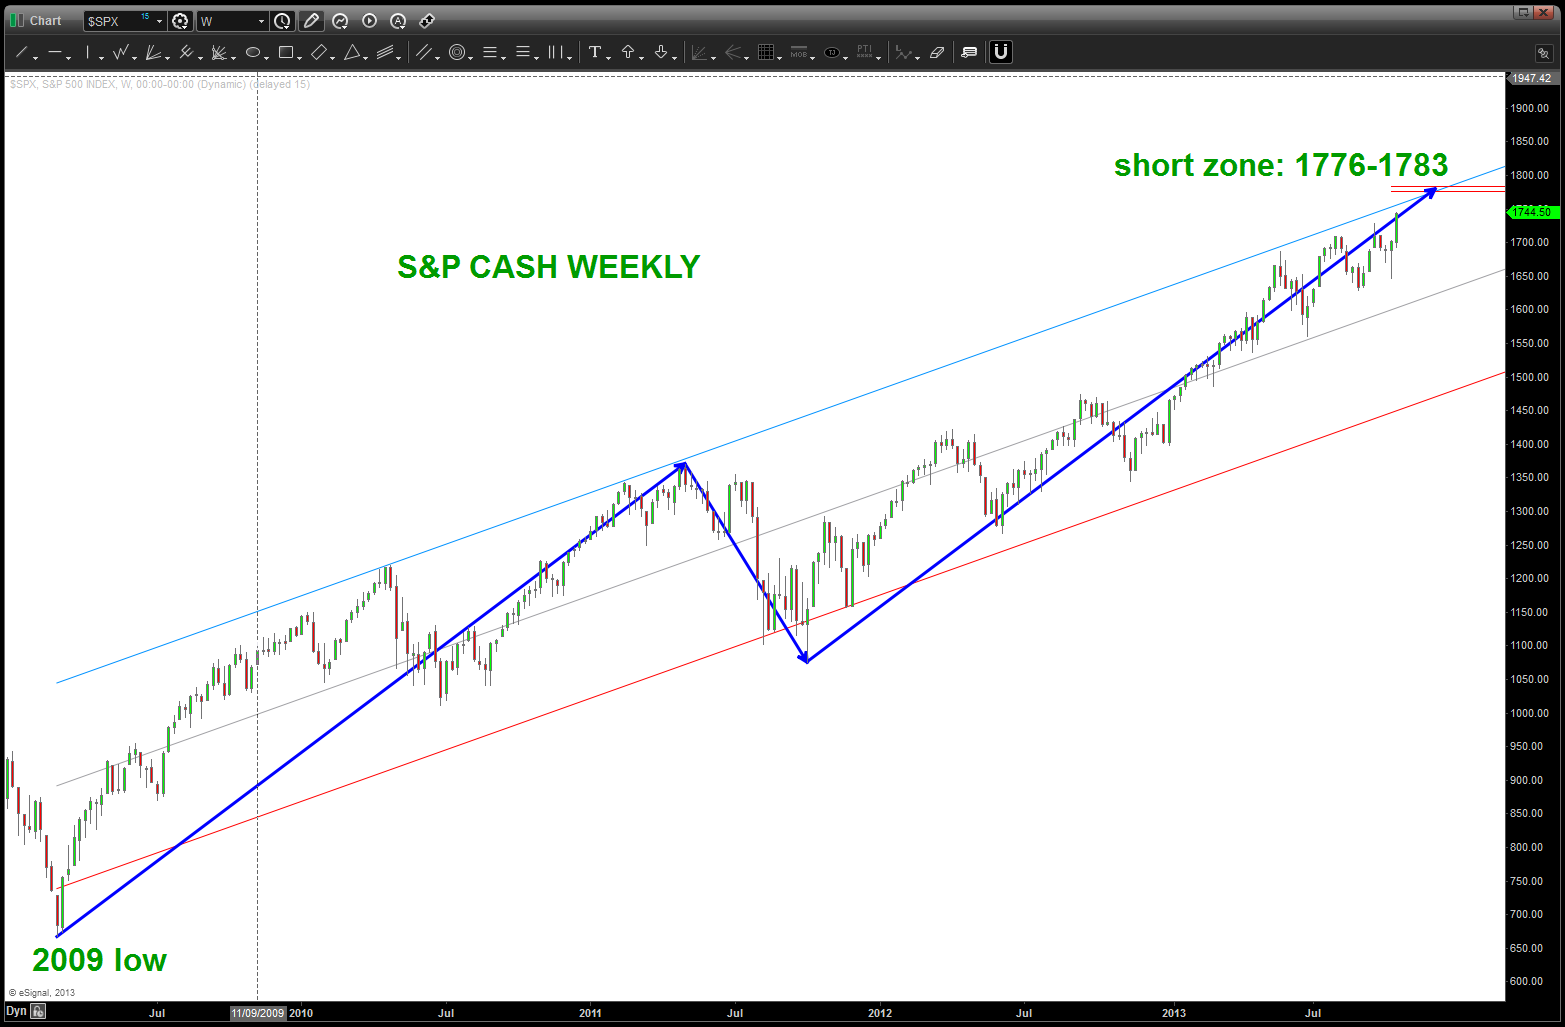
WEEKLY S&P CASH SELL TARGETS
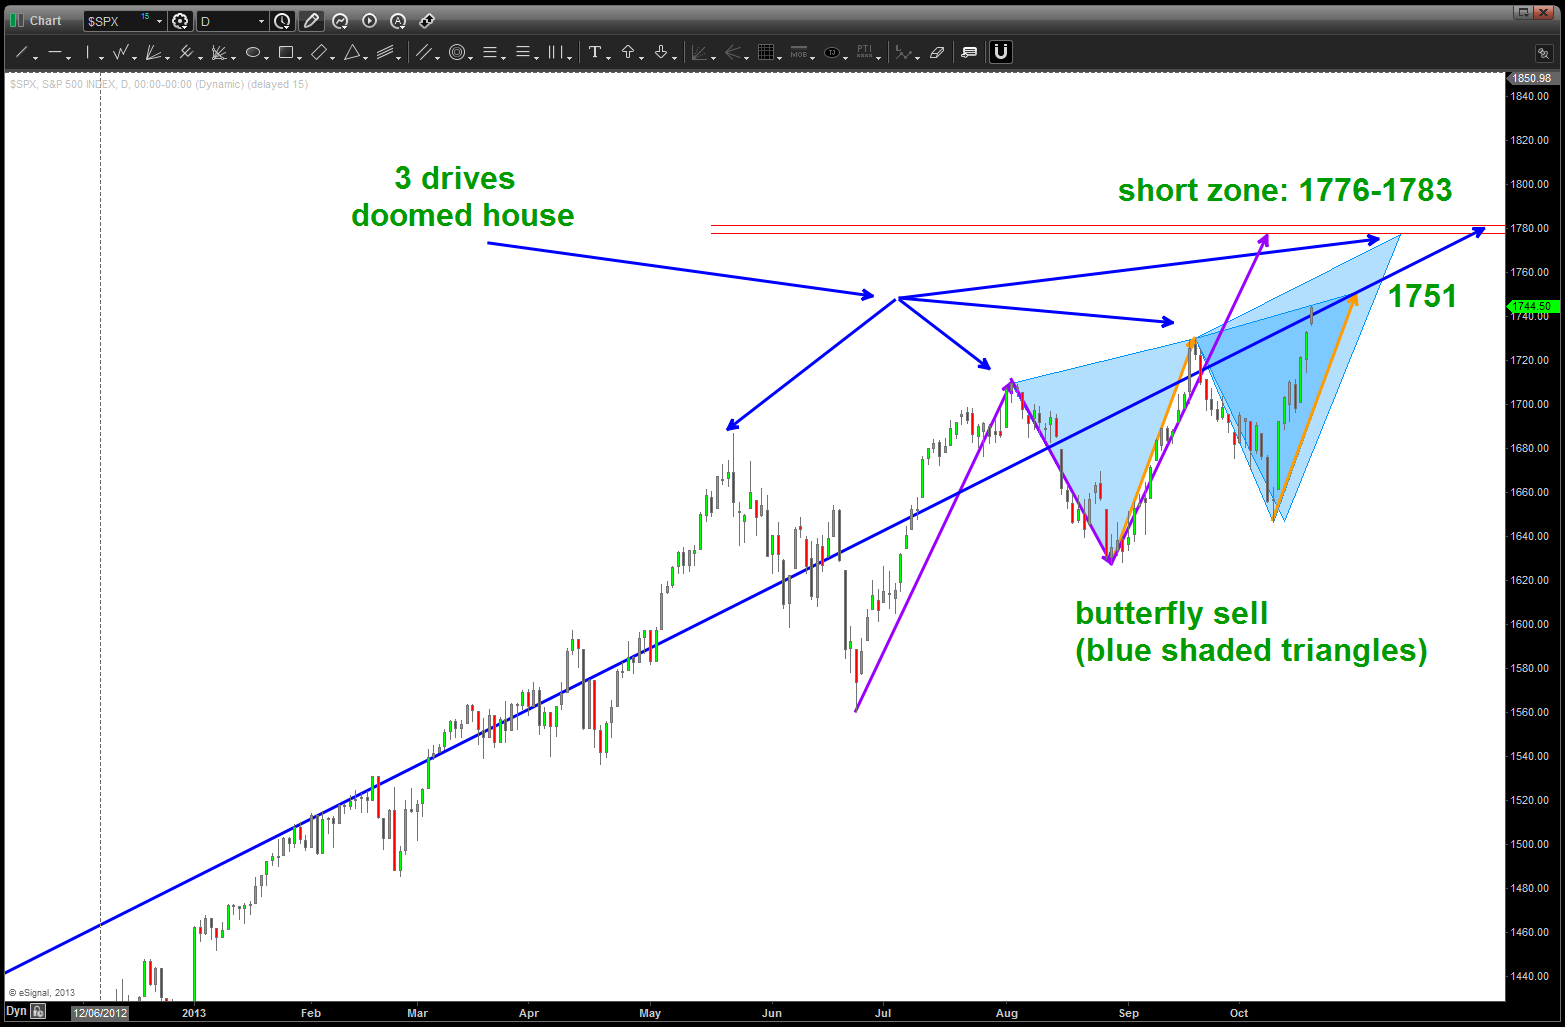
DAILY S&P CASH sell patterns appearing
