Part II: the S&P 500 and “too big to fail”
Just like rotation w/in the circle of life (fixed income, FX, commodities and equities) it also occurs w/in the context of our markets. The S&P 500 has different weights given to different sectors. Take for instance, the financials (and of course the topic of this post) – in 2009 they made up only 8% of the index. Now, in 2013 they are almost 17% of the index. Technology, is the largest component of the index at 17-18% and it has stayed that way from 2009-2013. So, the banks have, essentially, doubled their exposure w/in this index and are, pretty much, the largest portion of the S&P. So … what have we been following w/ this sector over the past years ….?
in 2007, as the market was exploding higher, I again started to see some disturbing signs. The parabolic move in housing, the corresponding parabolic move in oil (which as the time made up 15% of the index and is now around 10) all showed that the sector rotation playbook was in full affect. That is, the banks will, historically lead us UP and start us DOWN – BUT – ENERGY will be the last to go. So, our first chart shows the sell pattern completing in the banks as the we came into the historical 2007 time frame. Couple things to take away — 1) the sell pattern worked but in the context of the S&P, which continued to go higher, we had to shift our focus to energy and look for that top to come in before the general market would start down. I presented this analysis to the multiple institutions that I was working w/ and for at the time and nobody wanted to hear it or pay attention to it.
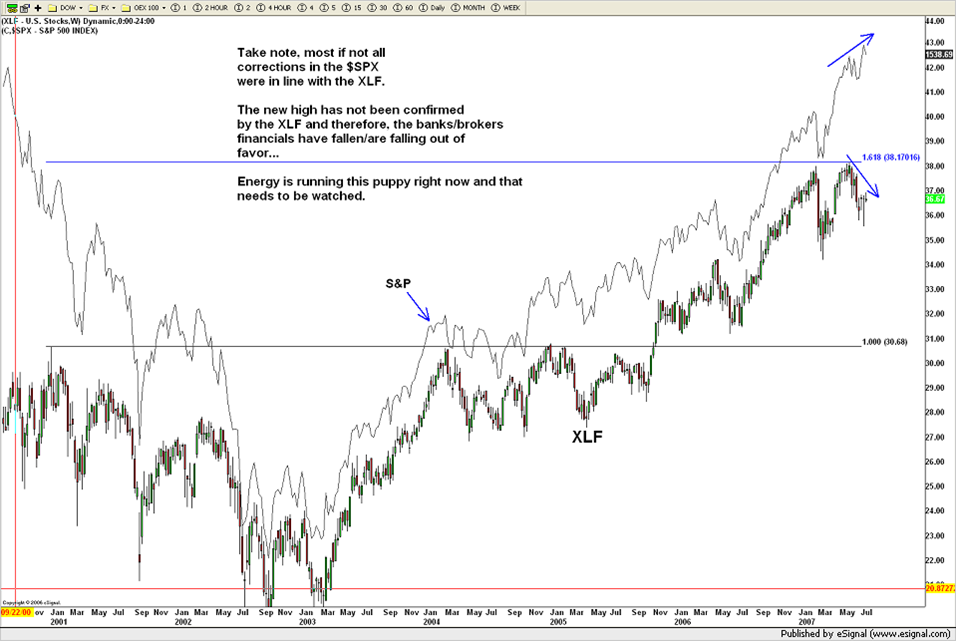
NOTE: banks completed sell pattern and the market kept going higher — according to the sector rotation script…
The rest is, of course, history ….that pattern was extremely powerful and the financial industry collapsed.
One of my favorite gigs was working w/ the When2Trade Group and putting out institutional ideas around potential investments. We did it really really simply — as you can see below we gave a ticker, a price and a risk and some targets. So, mind you, at the “height” of the crisis I said “well, it’s time to BUY the BANKS.” And according to the now defunct, CNBC segment “trading blind” put out the following across the wires (went out to 100’s if not 1000’s of institutional desks)
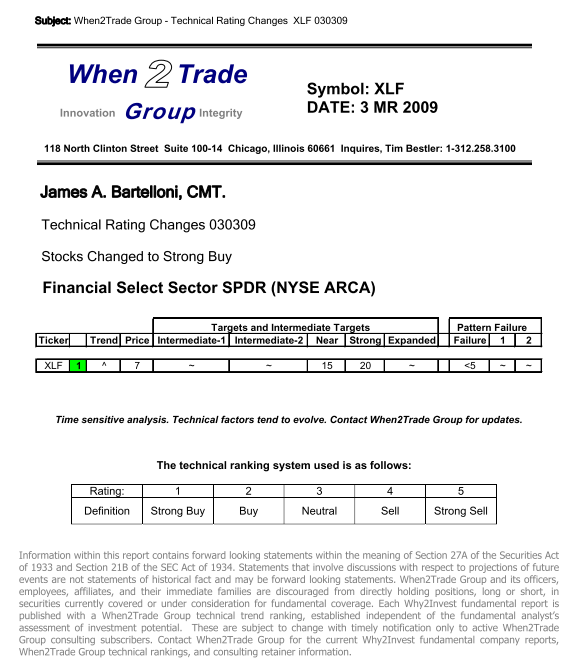
Note the date – March 03 2009. “Trading Blind” correct?
Looks like a “blind squirrel found an acorn” again ….well, here’s what I saw and why the BUY PATTERN was so powerful. Spend some time studying if you want, or not, but the pattern was there and as a pattern recognition trader — what the heck, had to give it a shot.
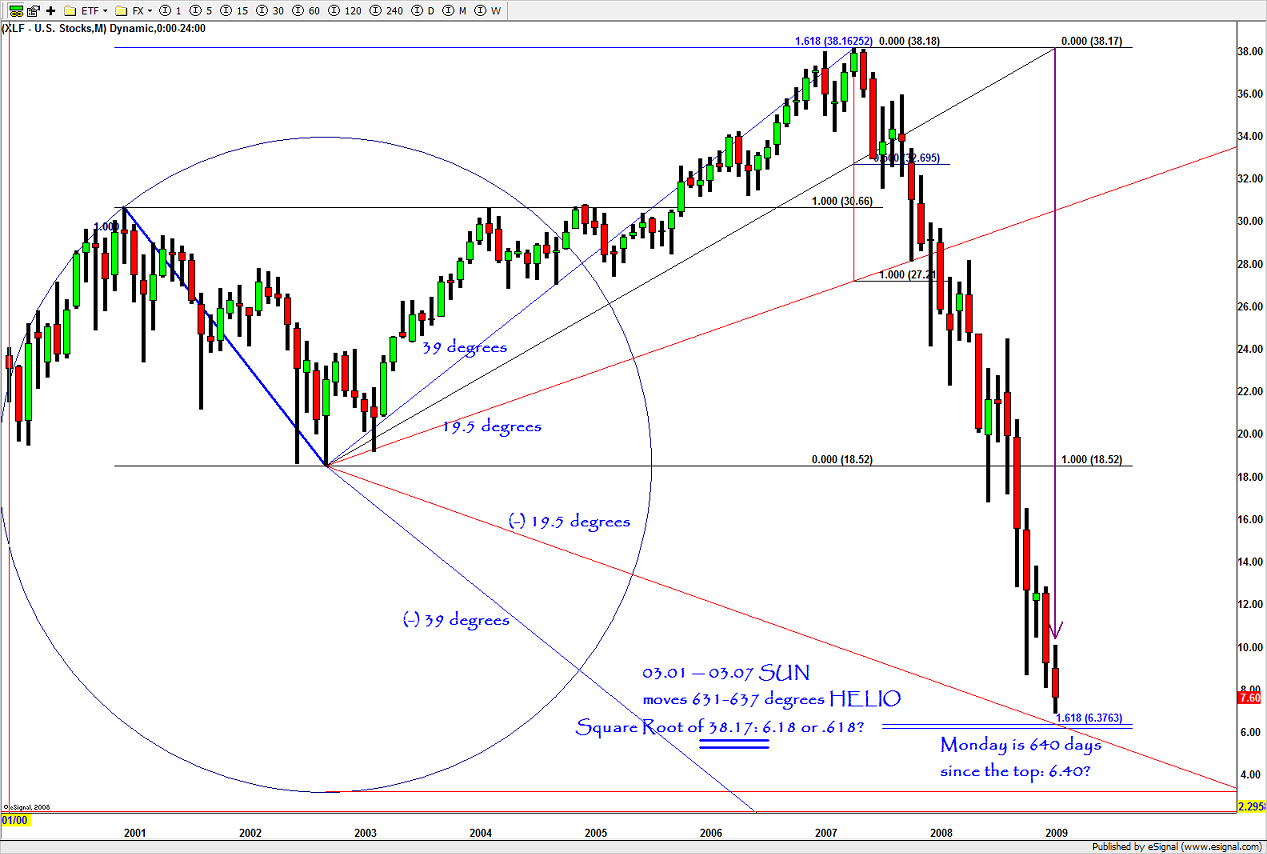
XLF at the lows in 2009. (OBTW the closing low price was 6.18 or .618 but that was just a coincidence, I think)
Fast forward to the present and we can see a couple things: 1) a major sell pattern is close w/ in the 20-22 range AND the banking index isn’t even CLOSE to new highs. Hmmmmm
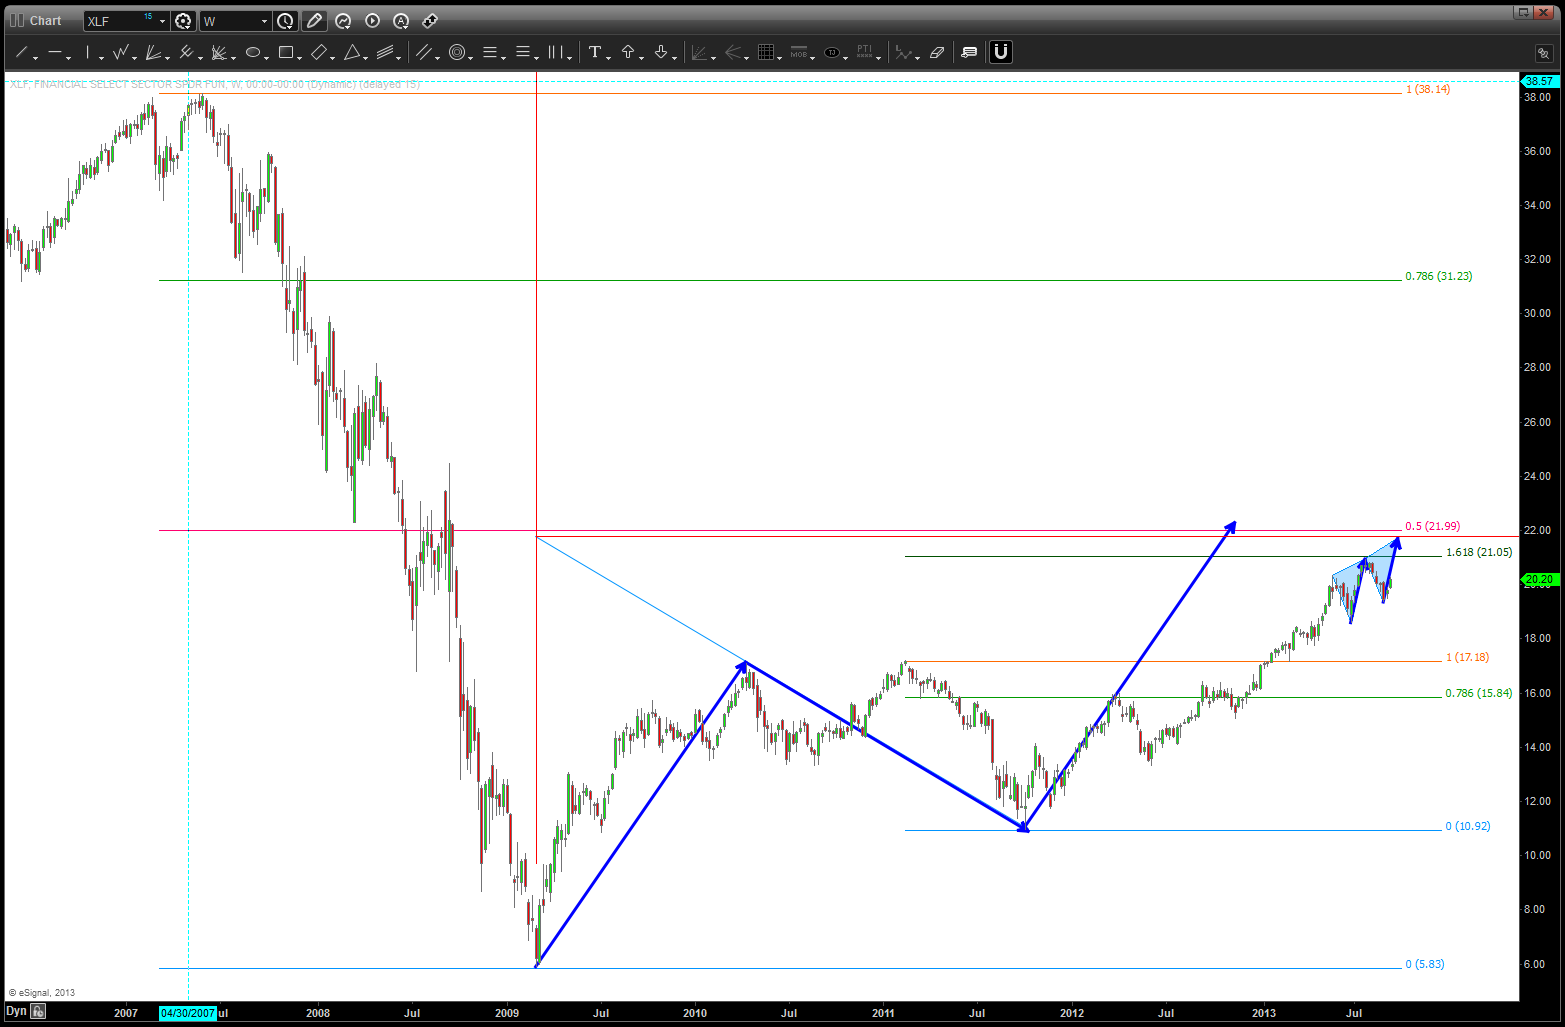
Banks present day completing/completed (?) a major sell pattern
more to follow …
B

Excellent article. I will be experiencing a few of these
issues as well..
Pingback: Part 2 of Part 1-V on the S&P | Bart's Charts
Pingback: follow up to Part II w/ Led Zeppelin “your time is going to come” | Bart's Charts