Part III: the S&P 500 and the influence of technology
As we discussed in our last post, technology has the biggest weight in the S&P 500, coming in around 17%. So, naturally, a quick look at the NASDAQ will give us a good feel of the technology sector and it’s importance to the S&P 500.
In the world of retracement work/theory we like to look for overlapping or confluence levels to give us a higher probability of potential resistance/support and/or major inflections. Additionally, the longer the time frame, the more serious we need to take levels when they all add up. One of my favorite confluence levels is when .618 and .786 retracements come together. W/in the context of the NASDAQ this level was at 3600 and is where a short was attempted. I was stopped out.
The strength of the NASDAQ is real and still running. However,once we enter the 3850-4100 level we will have another test of this strength. Again, refer back to Part II banks — it certainly would tell us a TON if the banks could go up a little more and complete their pattern while the NASDAQ goes up into the 3850-4100 level.
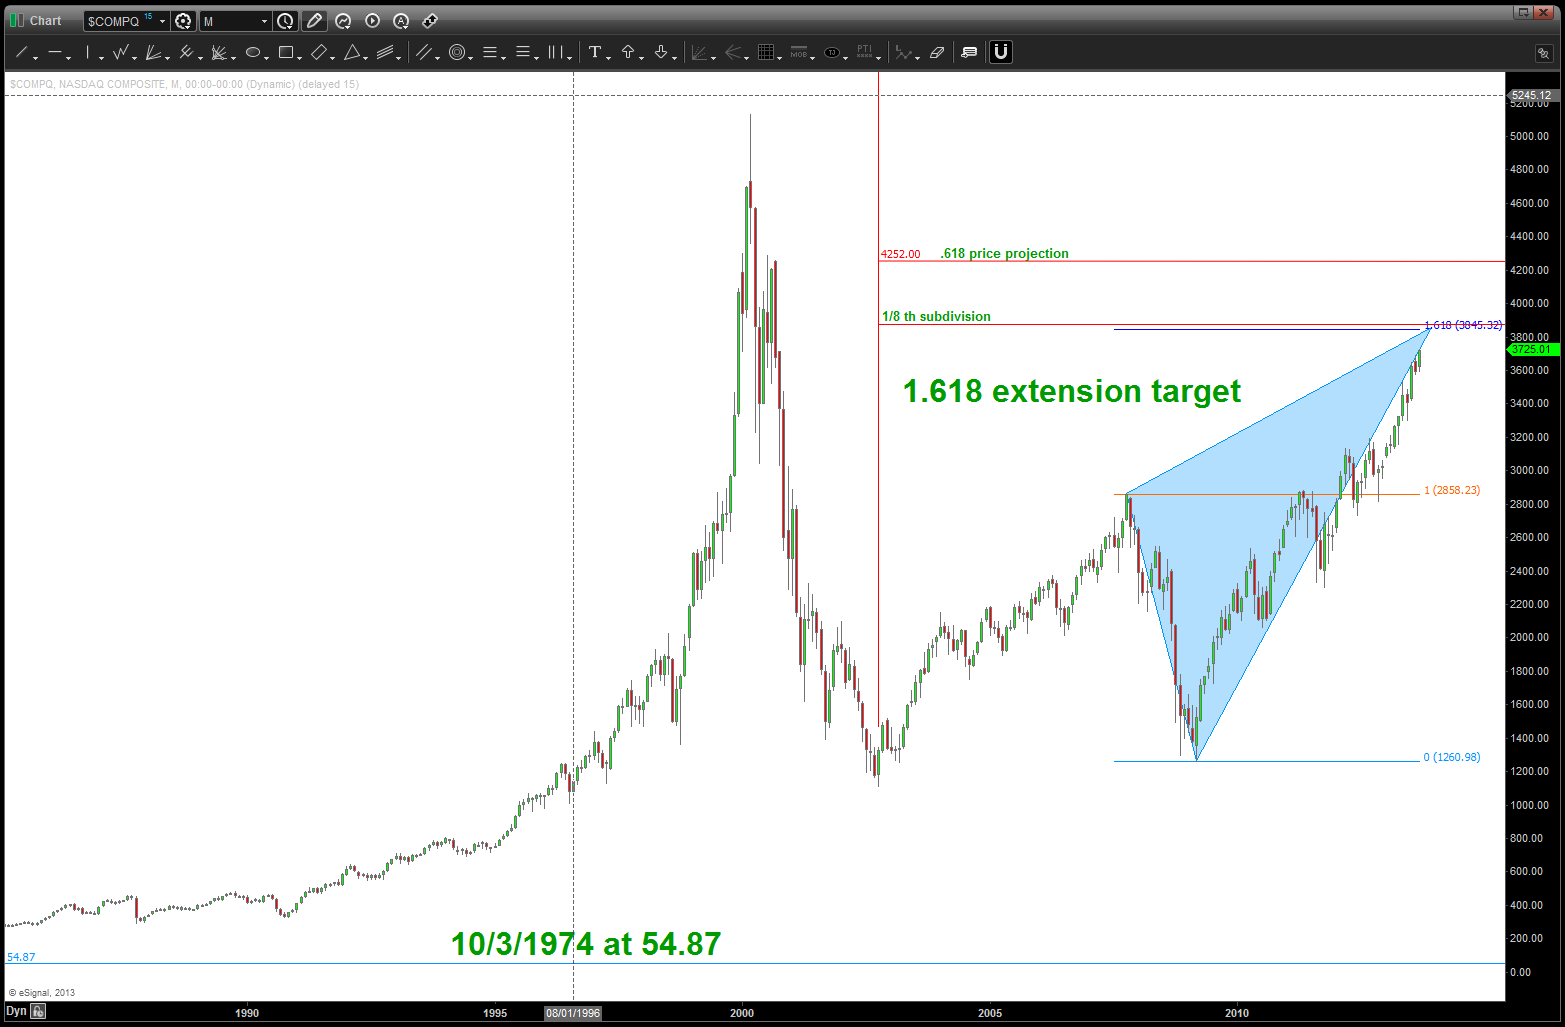
If you study the charts below, you’ll see that a minor pattern is completing around current levels so we could find some resistance, but higher levels certainly look achievable.
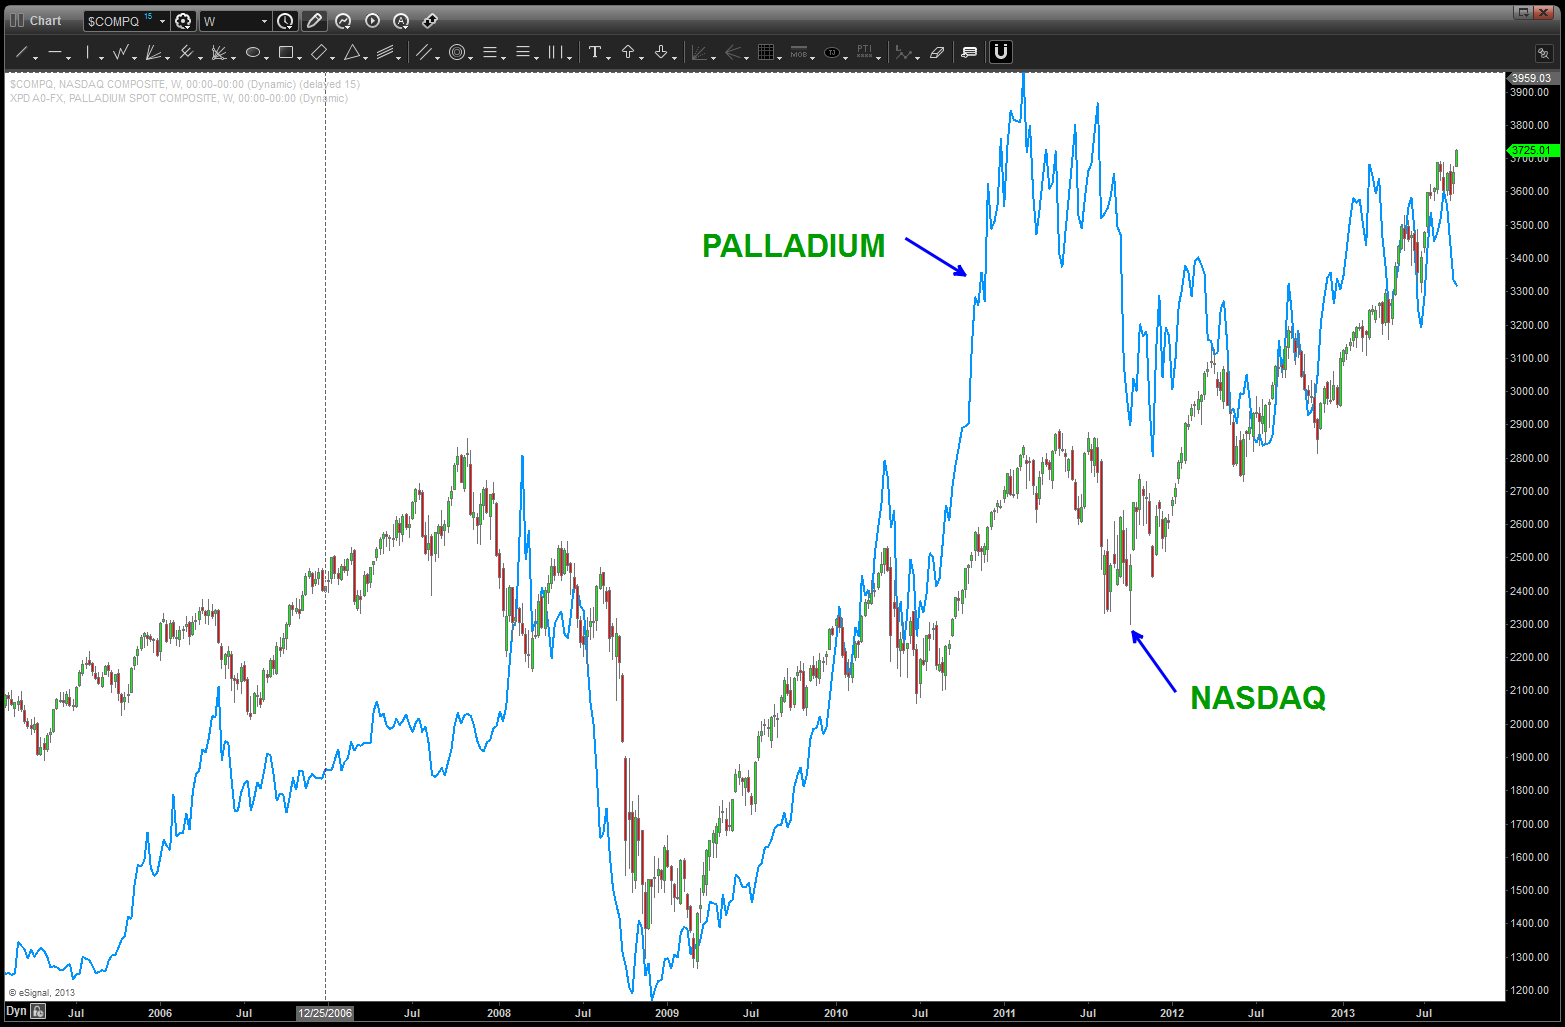
The other thing I want to point out is the very real correlation of Palladium to the NASDAQ and how a very important divergence is appearing between the price of Palladium and the strength of the NASDAQ. Pay attention … if you think about our smart phones and tablets, the Palladium metals is in almost all of them. It’s an interesting way to look at the market and also look for synergies that others might not be paying attention to ….
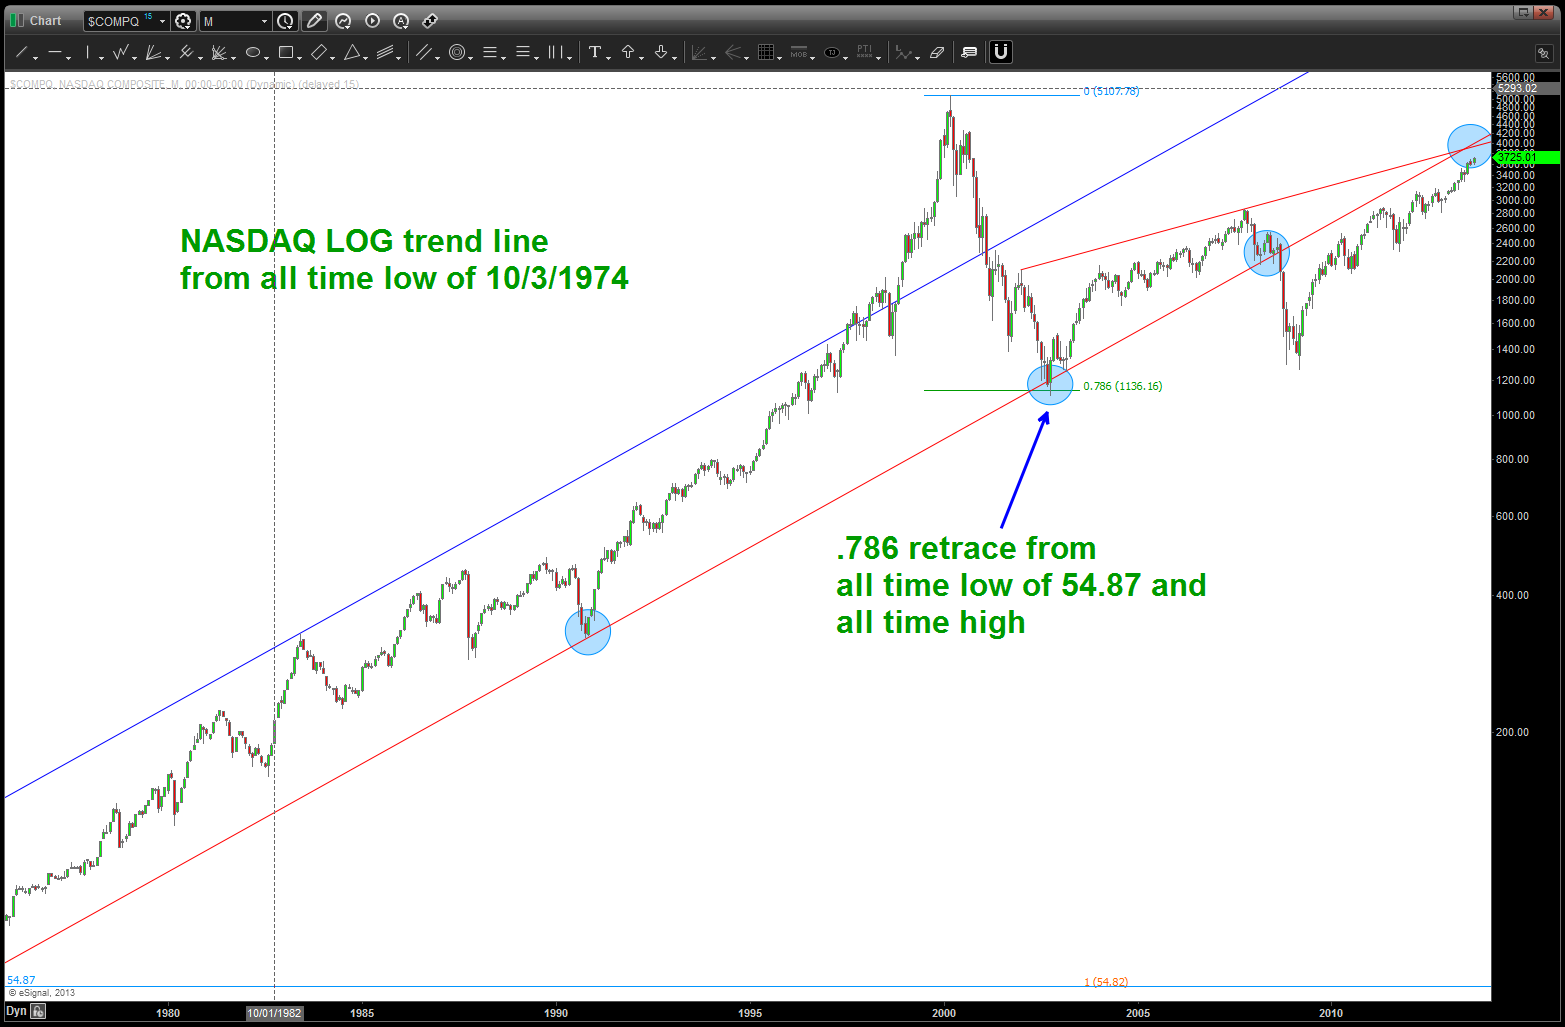
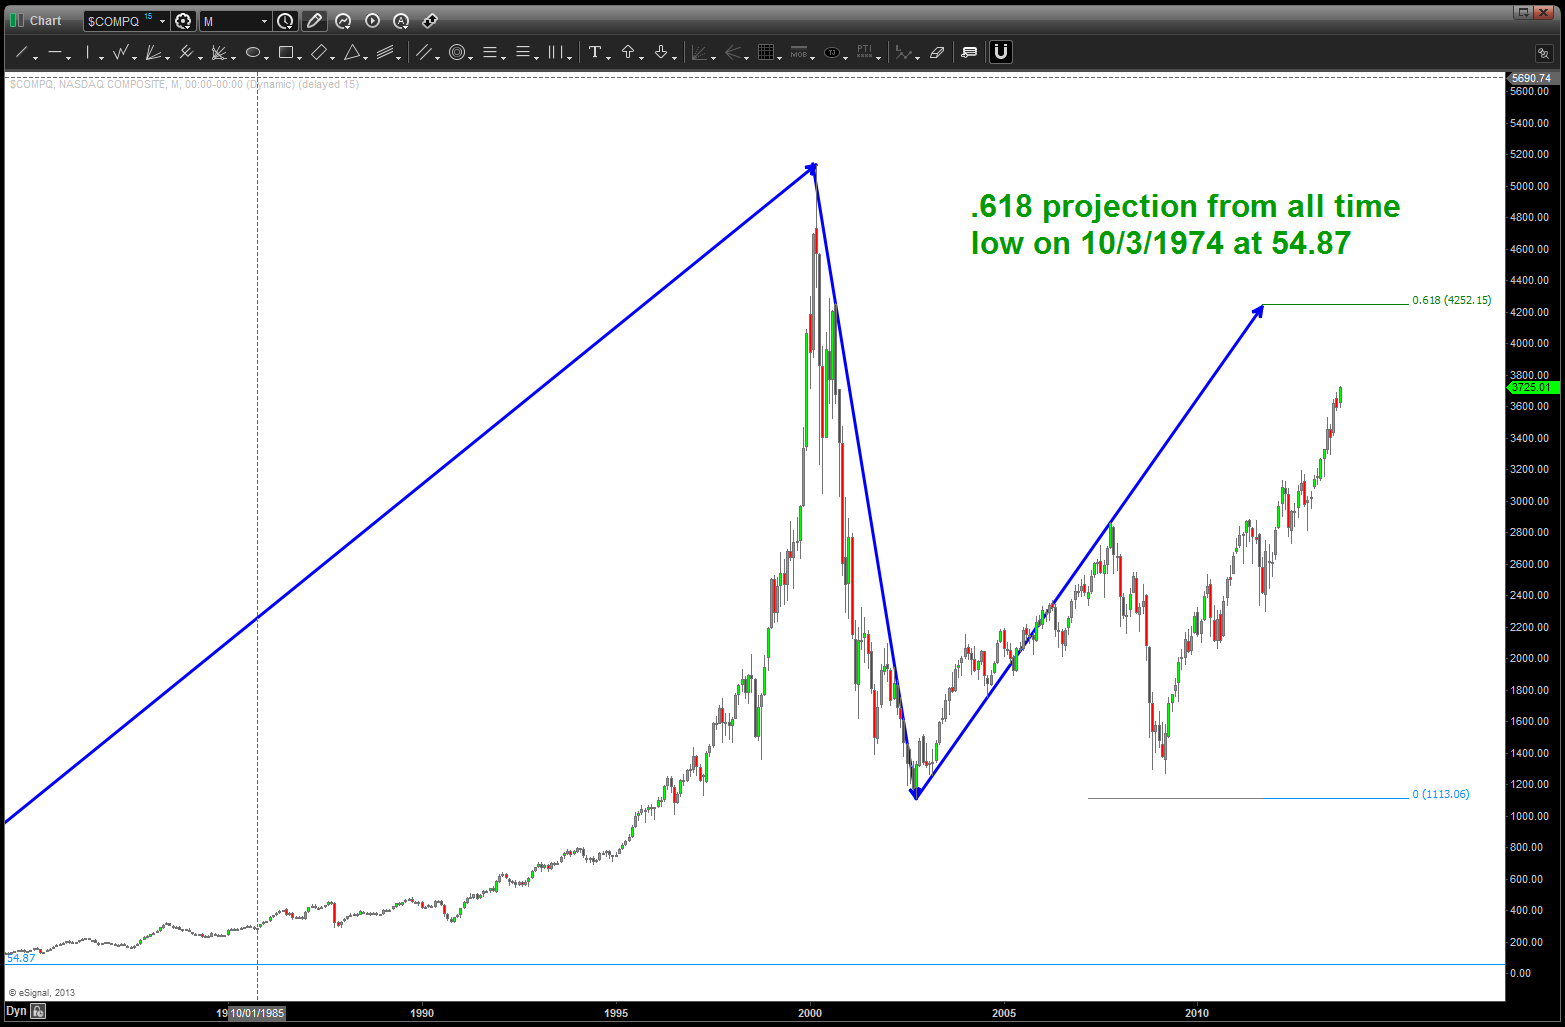
Additionally, you’ll see a logarithmic look at the NASDAQ from it’s all time low of 54 (yes, 54) and how these long term trend lines are important when they are placed on a log scale. While geometric lines are straight lines that bisect shapes, logs are able to show the power of trend and also a good way to measure accelerating rates of increase and emotional manias. Long term log trend lines need to be reckoned with and, as you can see below, we are coming right into the bottom half of the trend line from 54. Again, stay tuned.
Lastly, I’ve tried to break up the NASDAQ into multiple charts to show the work being done instead of one chart w/ a bunch of lines. Hope it helps …
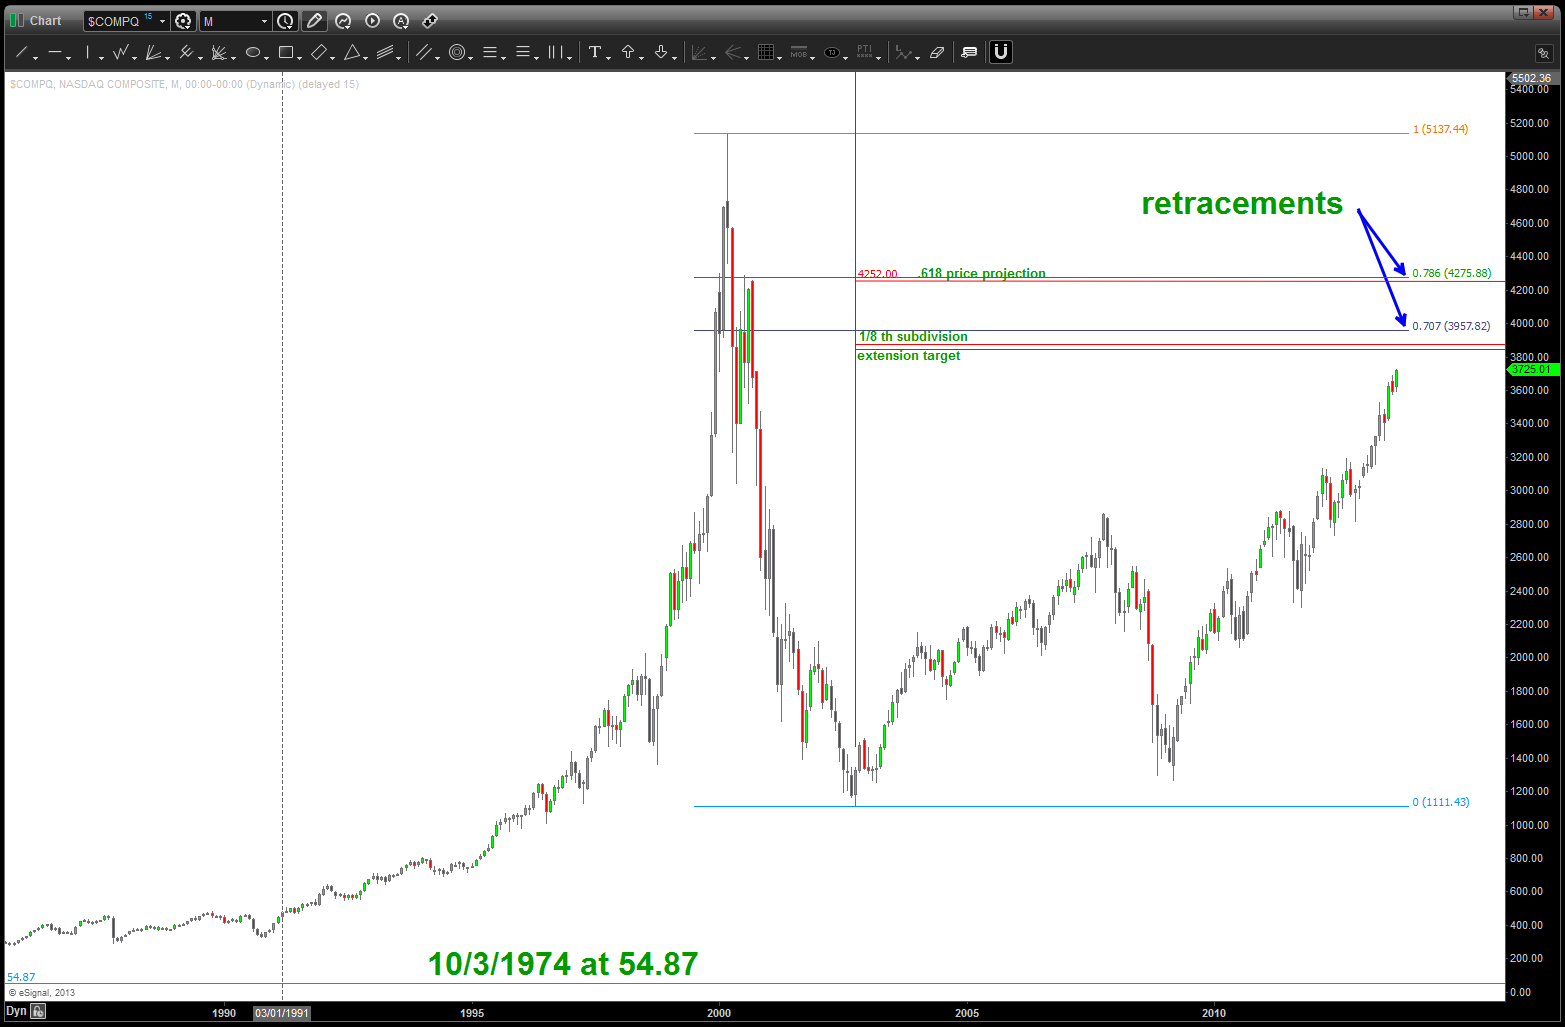
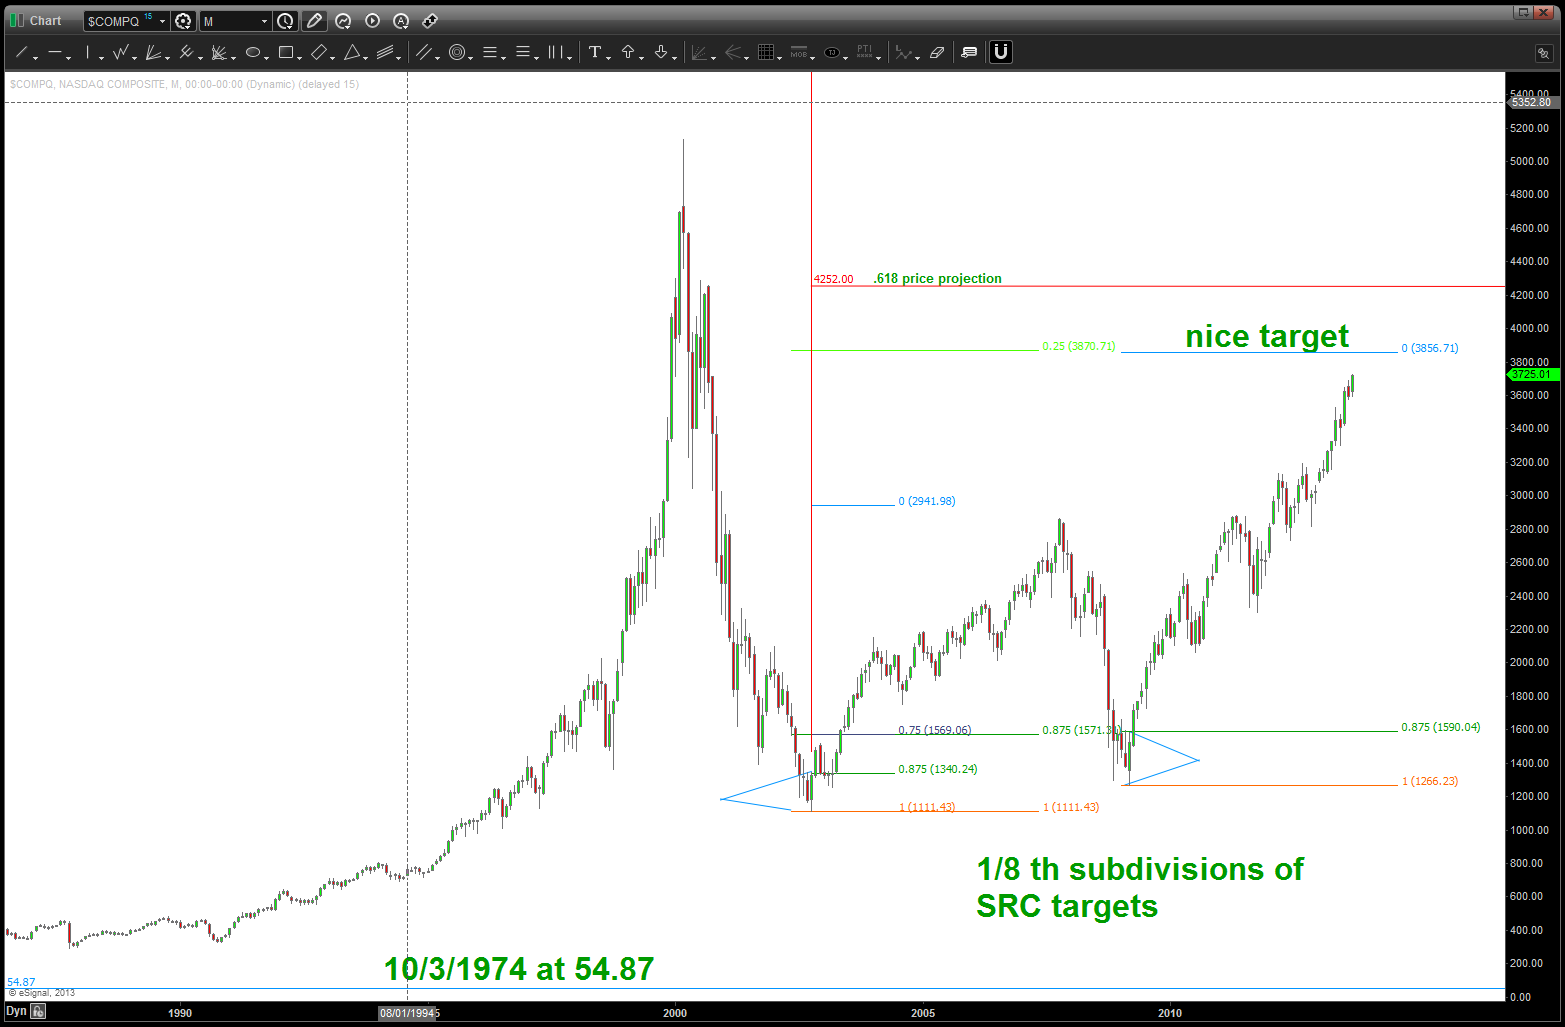
Conclusion: the move above 3600 broke thru, with very little effort, a major retracement confluence. I’m expecting a little higher on the NASDAQ and therefore I expect this largest sector of the S&P 500 will continue to provide some pressure up or sideways on the overall S&P 500.
Hope you are enjoying … Bart

I love it!
Pingback: Part 2 of Part 1-V on the S&P | Bart's Charts
Pingback: Follow up to Part III and “When the Levee Breaks” | Bart's Charts