remove bias, trade what you SEE – JP Morgan
does ANYONE remember the EMOTIONS of March 2009? do you think ANYONE in their right mind would recommend a BUY on the XLF in MAR 2009? well, just as a reminder here it is …
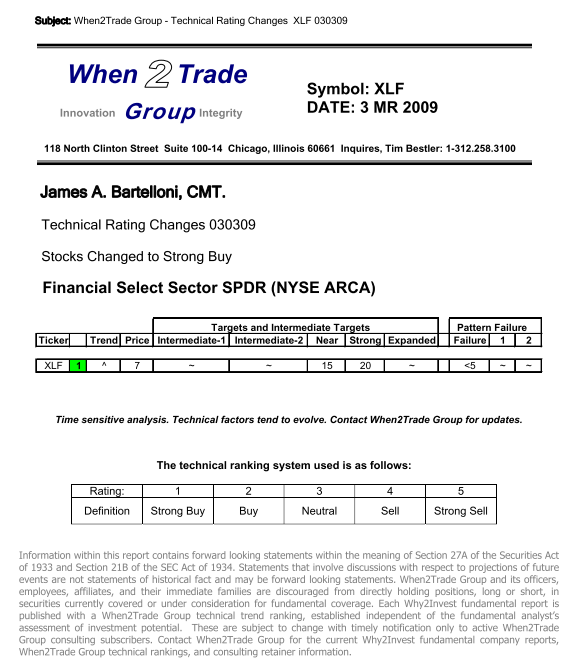
XLF at the LOW
why am I pulling this thread right now? well, the past couple days I have received some very convincing emails around how WRONG I am w/ regard to the PATTERNS that are appearing in the US Equity Market. Here’s the dirty little secret .. I am NOT wrong because I just look for PATTERNS. the PATTERN will work or it won’t. Over time, this EDGE will show profitability IF I manage the RISK.
a couple years ago I had the amazing opportunity to present to the entire MTA (www.mta.org) on PATTERN recognition as an “emerging CMT.” I presented a bunch of charts showing some GREAT set-ups based on PATTERNS. No moving averages, bollinger bands, MACD, stochastics or any of that “stuff.” Frankly, I believe they work but, honestly, I don’t understand them that well. I like numbers, music and geometry.
here’s the chart that I presented on the BUY of JPM. If you want me to go over the details of the chart, let me know by email and I will explain. The PATTERN that was present was a BUY at 15 dollars. BUY JPM at 15 …
I am presenting this, again, because at the HEIGHT of BEARISHNESS I was a BULL!
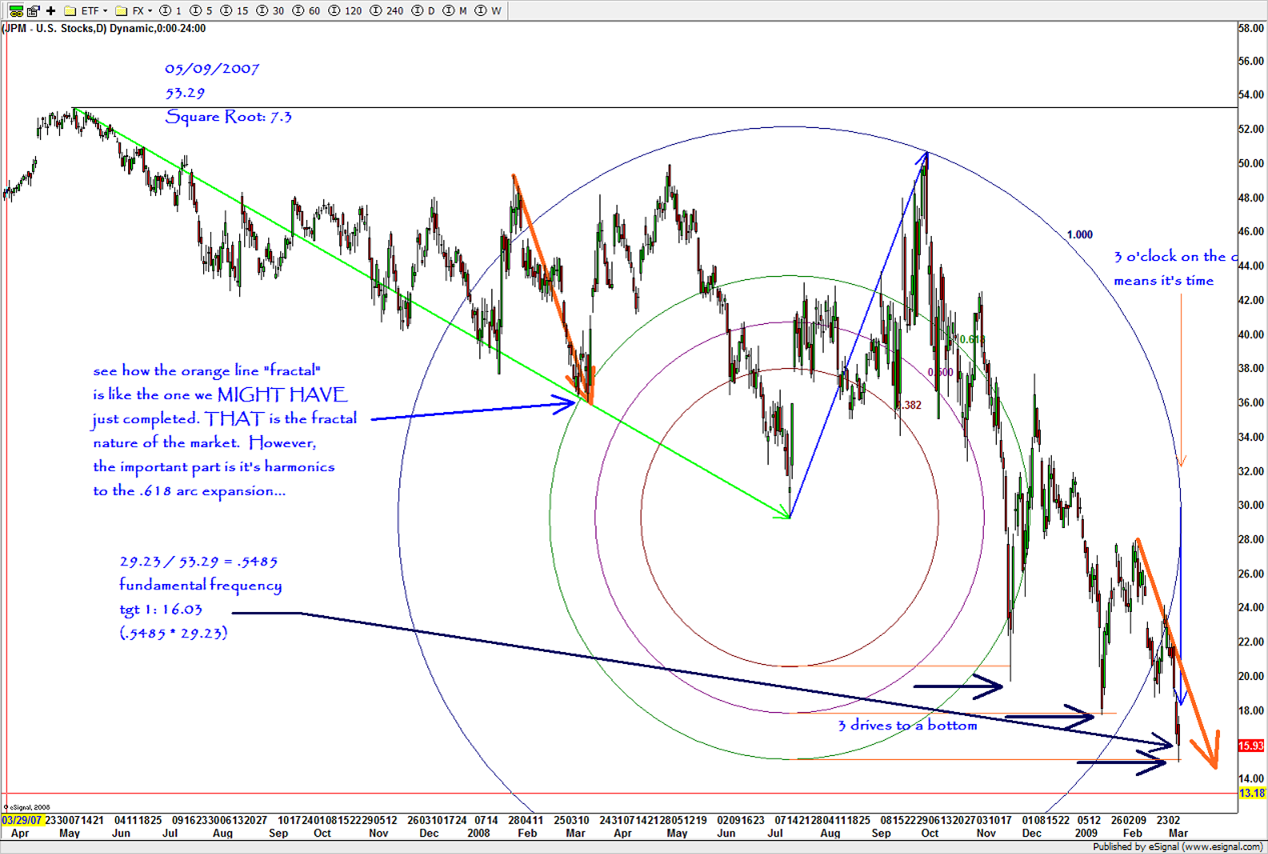
JPM 2009 LOW
here’s the AMAZING SELL PATTERN appearing on JPM:
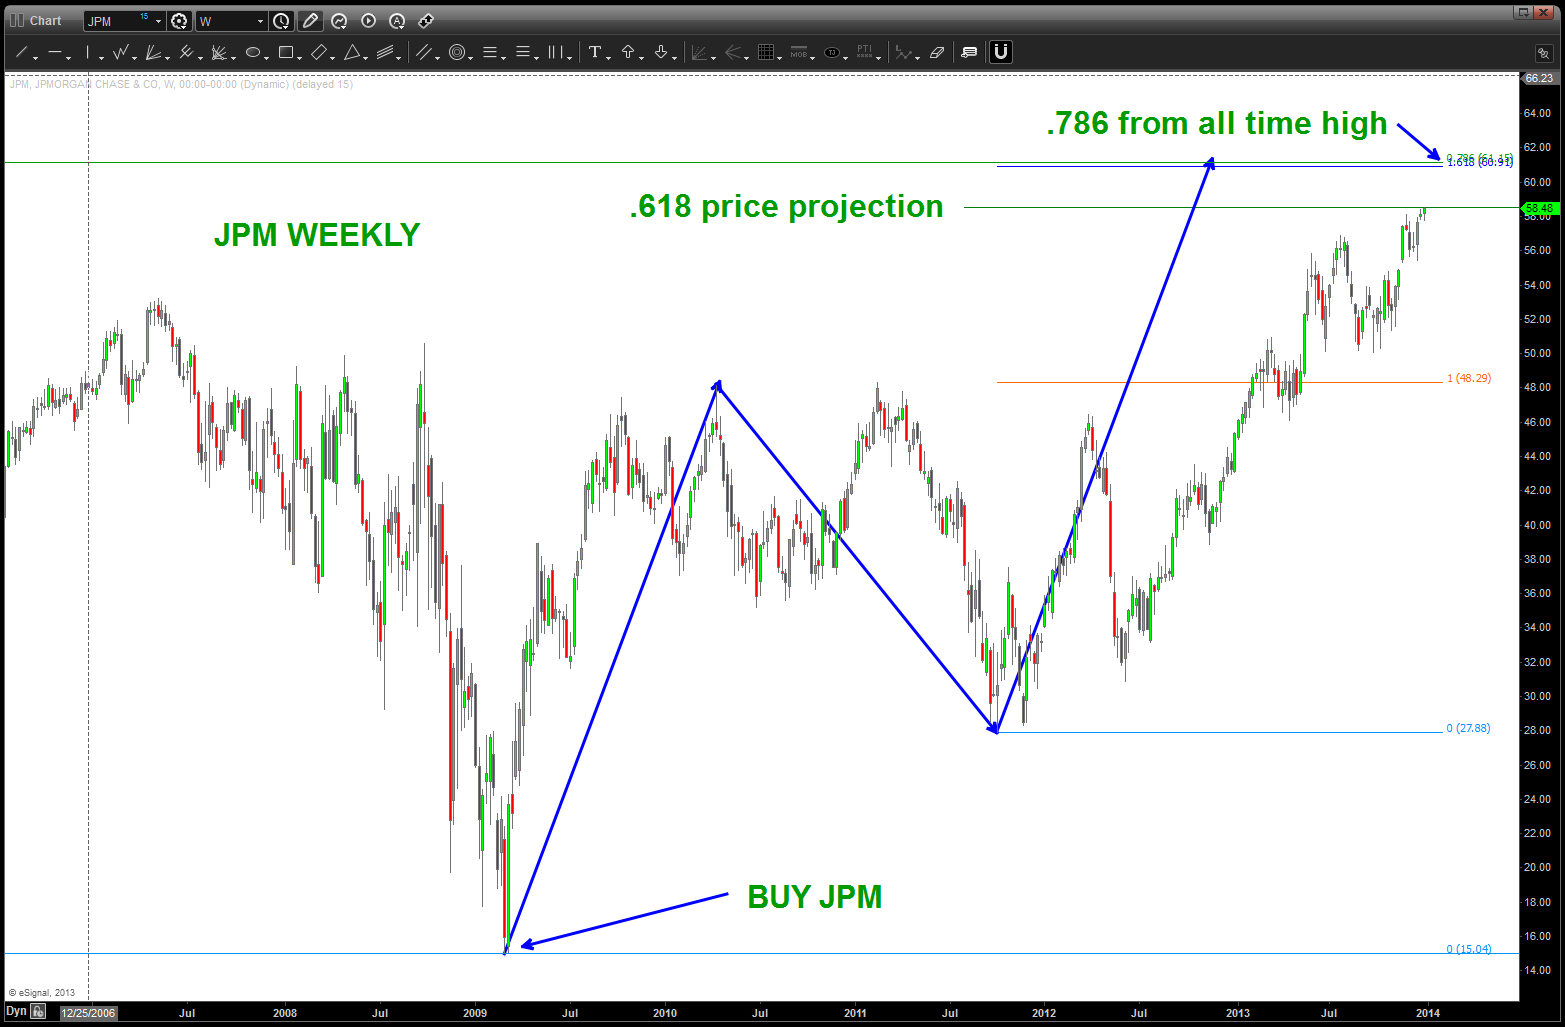
JPM SELL Pattern …
So … the SHORT PATTERN that has appeared on JPM is AWESOME! Why AWESOME? Because … the tightness of the 60-61 level has all the RATIO’s to create a pattern coming together. It’s that SIMPLE. When the “ratio’s” come together so tightly we can MANAGE RISK BETTER ….
one last, the .618 price projection (from the all time low-all time high-2009 low) was hit, exactly, today. So, 58.48 could do it.
if we get above, say, 64 this puppy could “cook off” higher and the band will play on and I’ll continue to eat my “bearish pumpkin soup.”
make it a GREAT 2014!
BART
