great explanation on the importance of the Yuan vs USD
Posted on March 14, 2014 Leave a Comment
my wife tells me I am a geek and so do a lot of other people so …if my lines, charts, music, vibrations and square roots don’t make sense perhaps this might:
keep calling me a geek, I’m thick skinned.
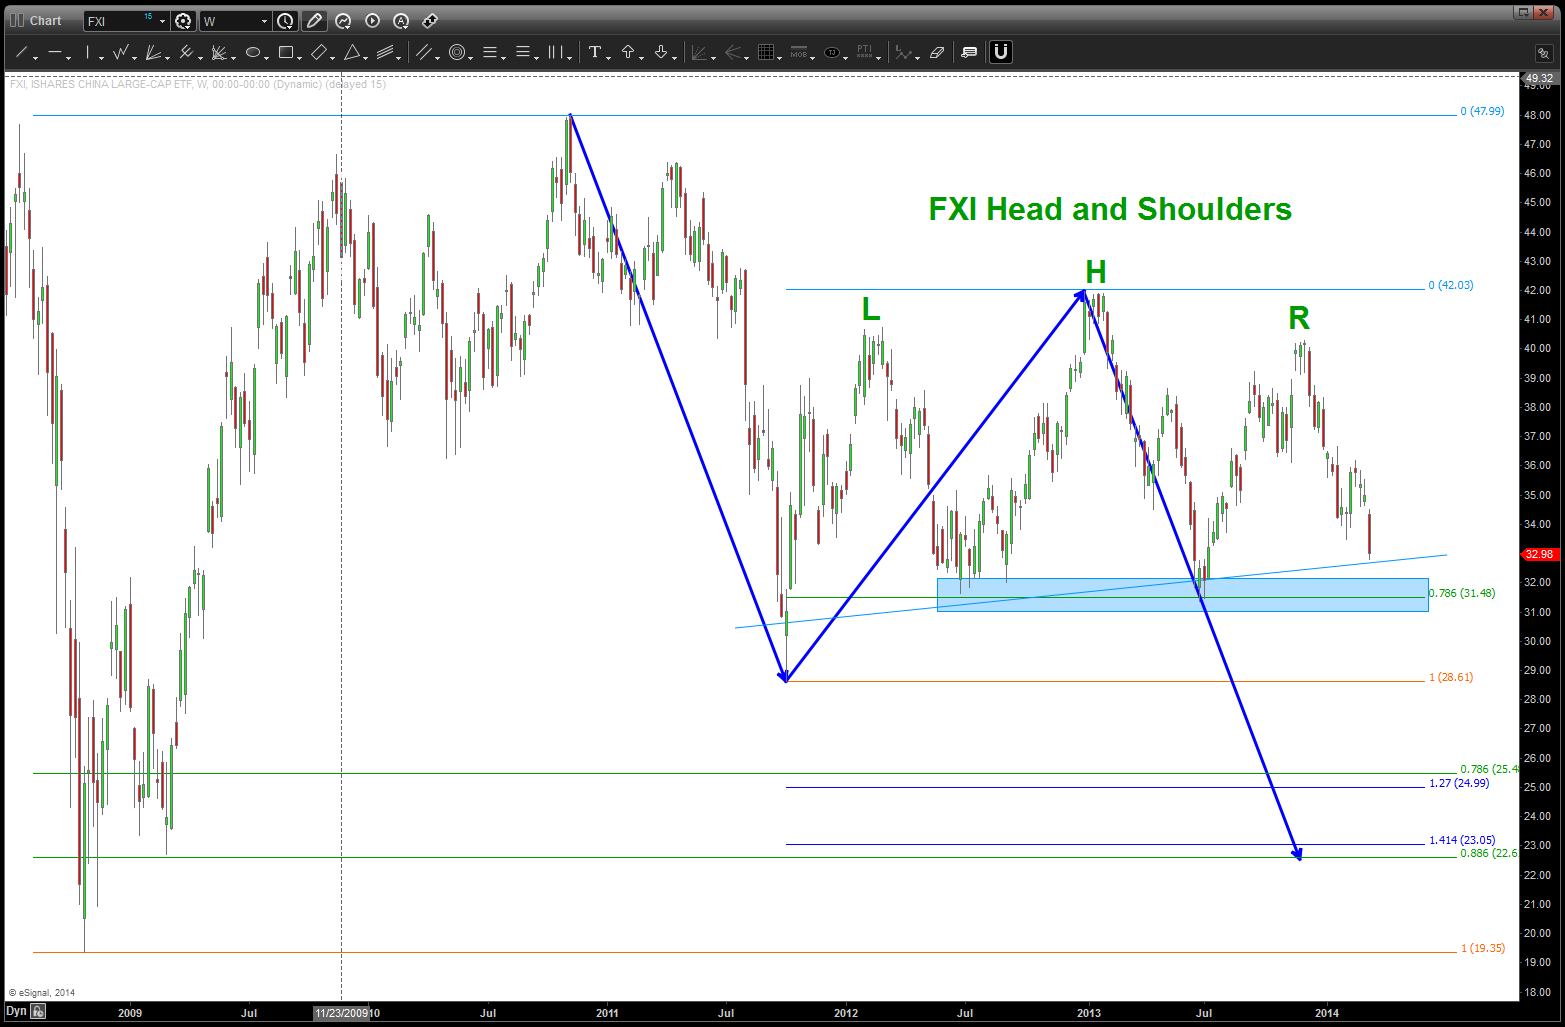
also, I read the last paragraph … the patterns say DO NOT buy FXI, yet.
ROCK ON! OK?
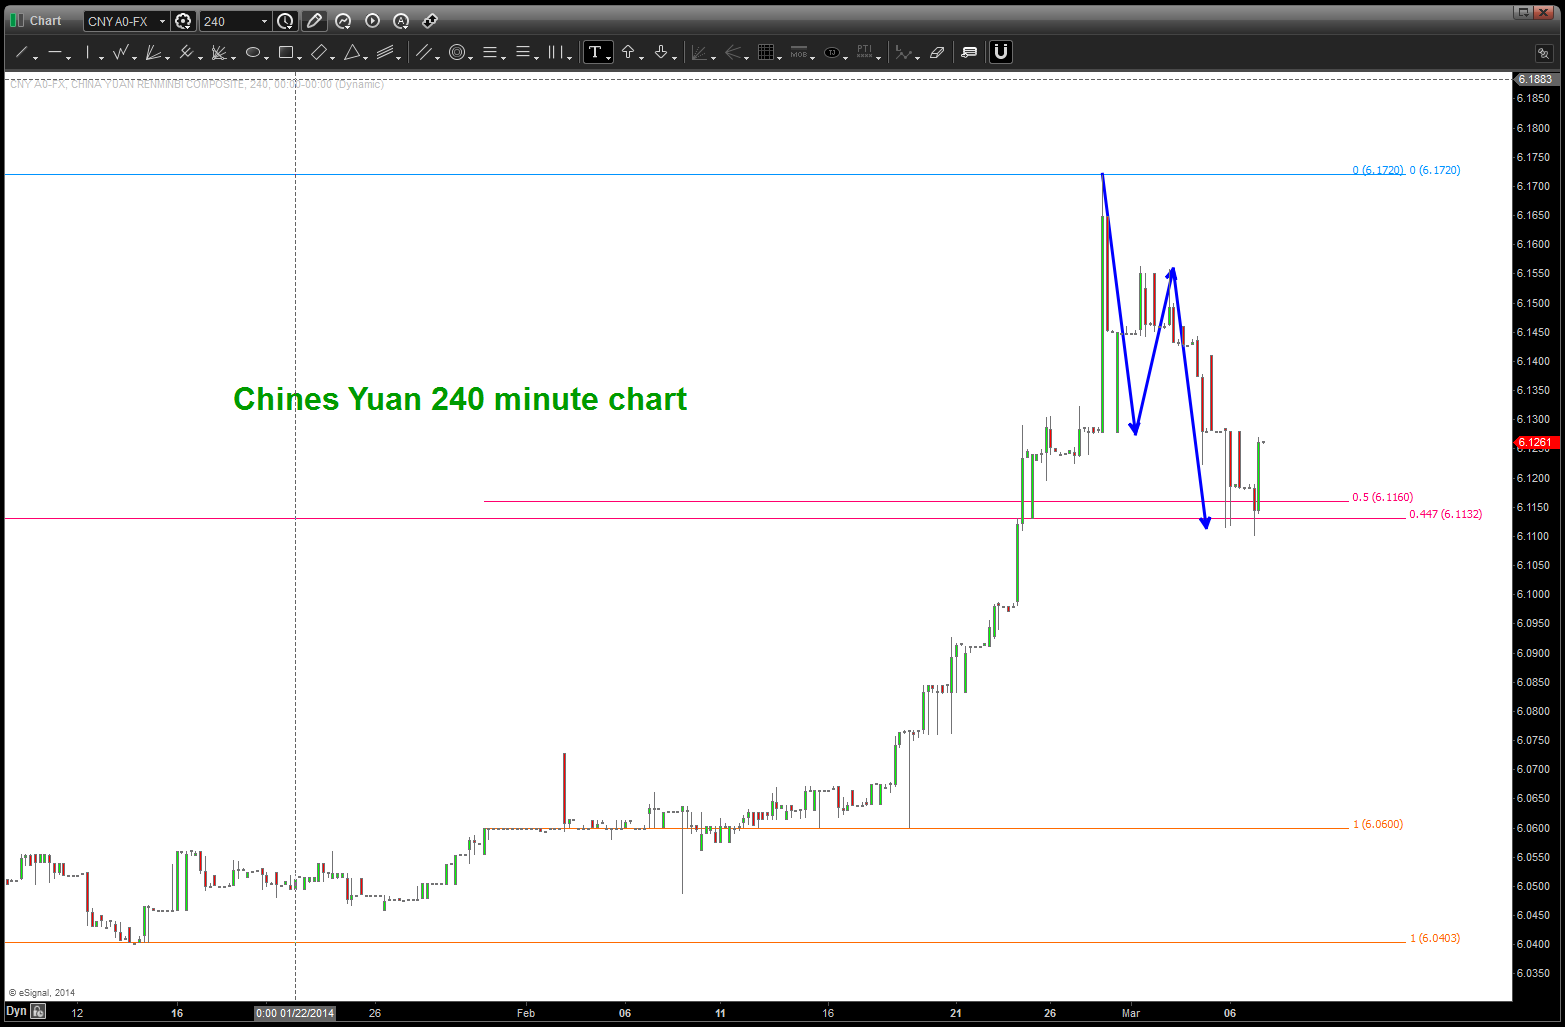
Chinese Yuan weakening … not what we wanted to see
Posted on March 14, 2014 Leave a Comment
From a pattern perspective there are two scenarios:
- recent up move is a B wave that will complete in/around here and then fall into area located and then up (orange sequence of arrows)
- recent down move (blue arrows) completed the a-b-c correction and the dollar is going UP against the Yuan.
- note: when the candles go UP it’s Chinese Yuan weakness and when the candles go DOWN it’s Yuan strength
- summary: we spent some time last night showing the FXI (China) and Copper correlation .. any chance that the PBOC has a crystal ball w/ regards to their stock market, horrific credit and real estate bubbles?
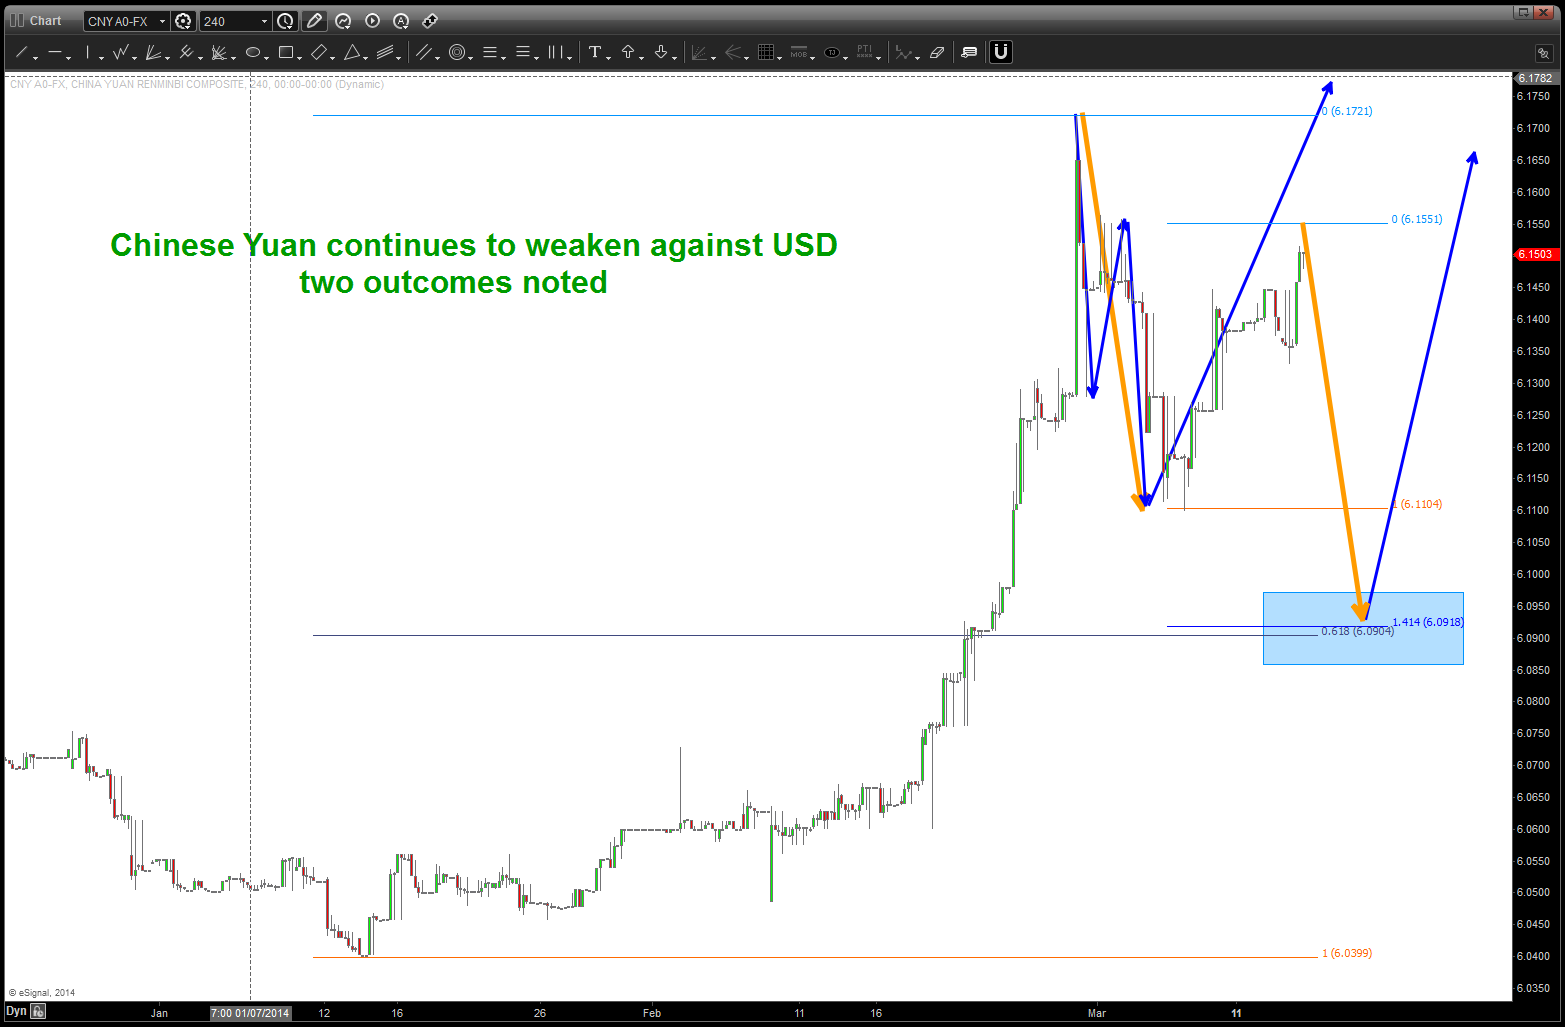
Chinese Yuan continuing to strengthen? two possible scenarios shown
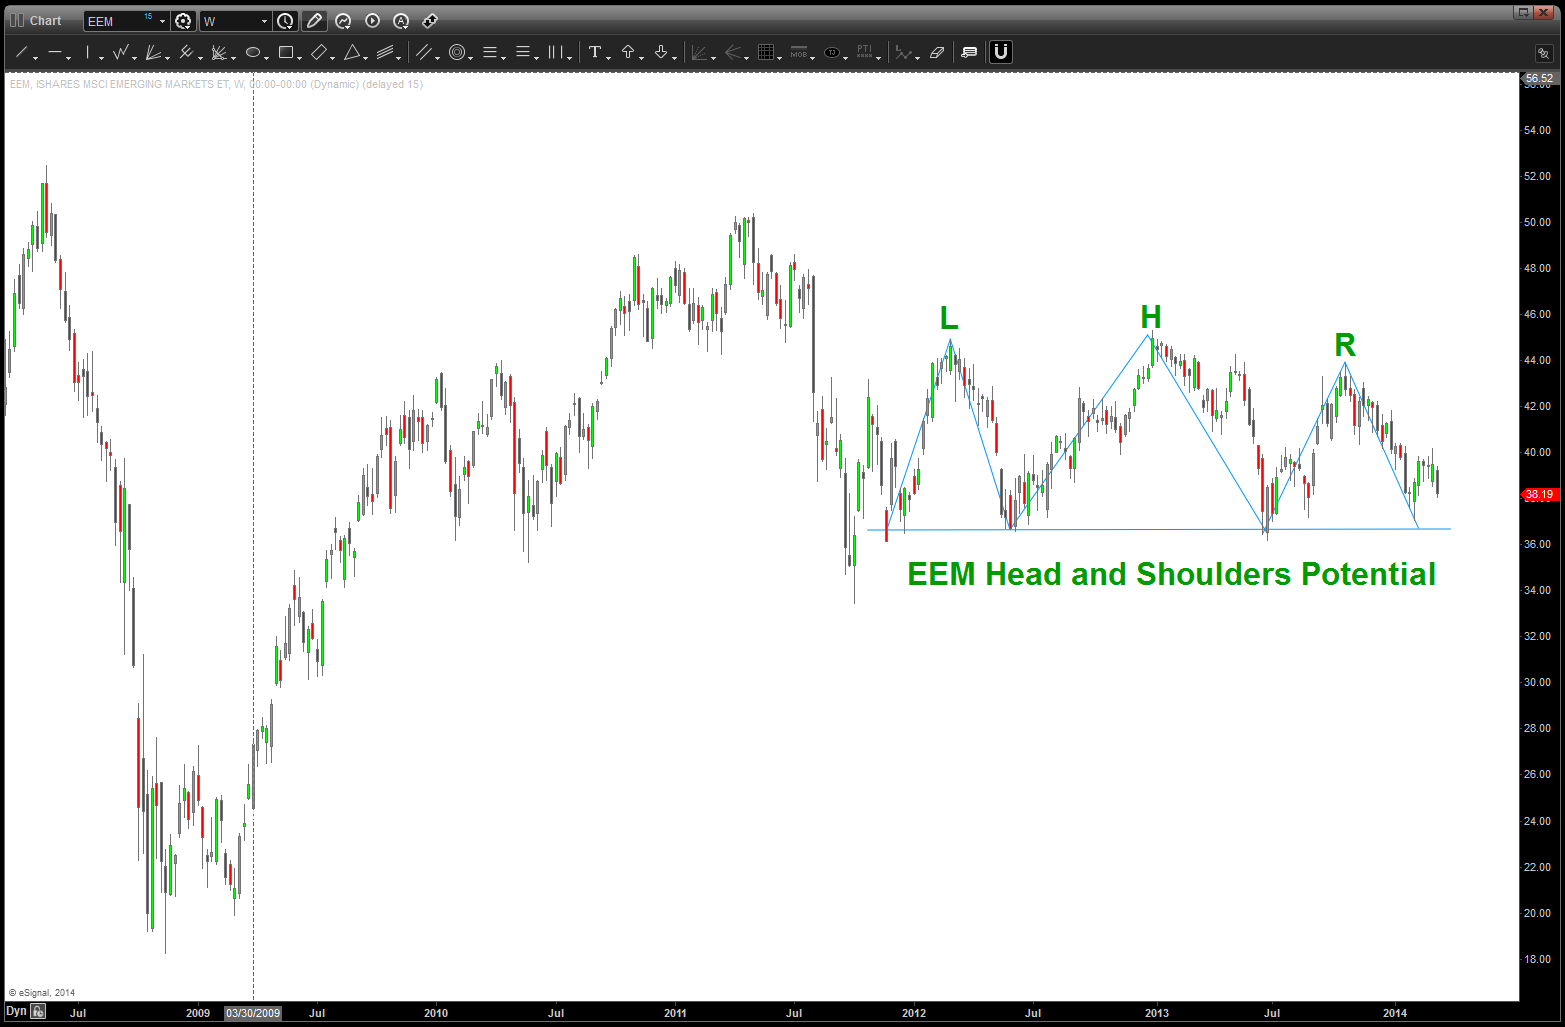
Update on Copper, Emerging Markets and China
Posted on March 13, 2014 Leave a Comment
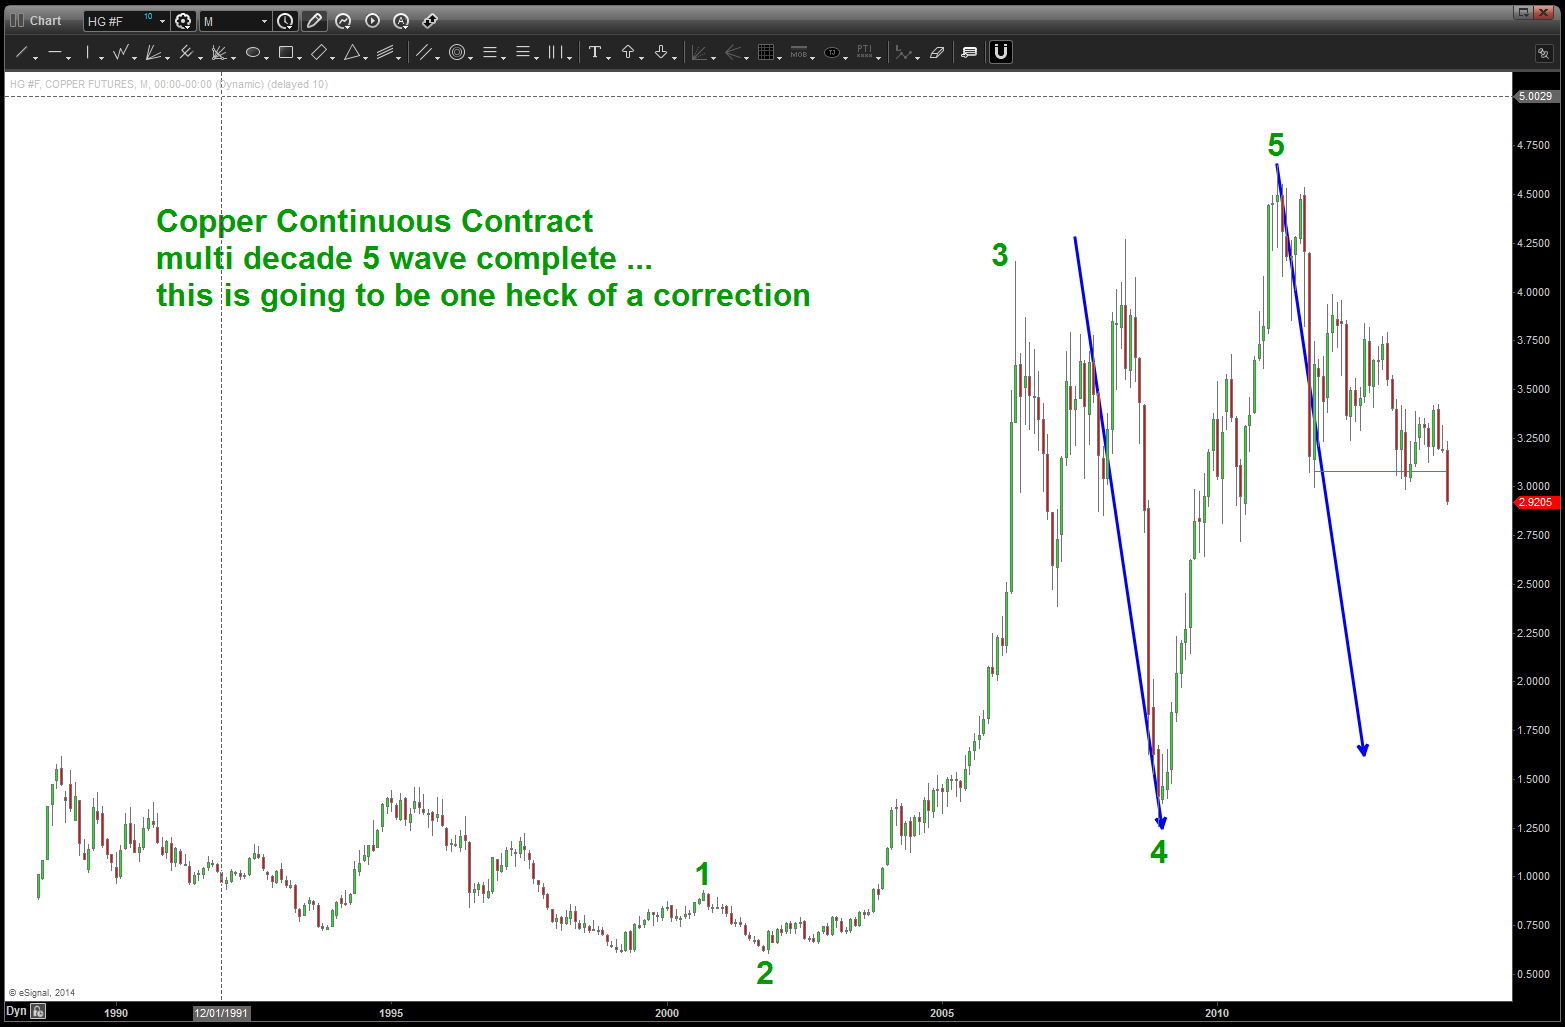
CLIFF NOTES: the move in copper should not be suprising // we are correcting a multi-decade 5 waves up complete. This has shown to put pressure on emerging markets and china. All according to the script.
if you would like to search for “copper” on this blog you will see that we have had a bearish stance for a good couple of years. A strong case can be made that Copper finished a multi-year 5 waves UP and is now undergoing a potentially very violent correction. if you also click on this link you will see the correlation between FXI (chinese ETF) and EEM (emerging markets ETF) and Copper : https://bartscharts.com/2014/02/01/copper-and-the-emerging-markets-eem-etf/ also here are the highs and lows in Copper: https://bartscharts.com/2013/12/20/the-copper-script/
The most recent breakdown in copper does not play well for FXI or EEM.
NASDAQ update
Posted on March 10, 2014 Leave a Comment
cliff notes: most all of the targets that I had for the NAZZIE have been defeated. There is one more target (shown) that should cause strong resistance. nothing else has, but it still needs to be respected. also, note the PRICE and TIME correspondence coming into play w/ the all time high in the NASDAQ and the calendar day count. We are close to PRICE equals TIME. Stay tuned …

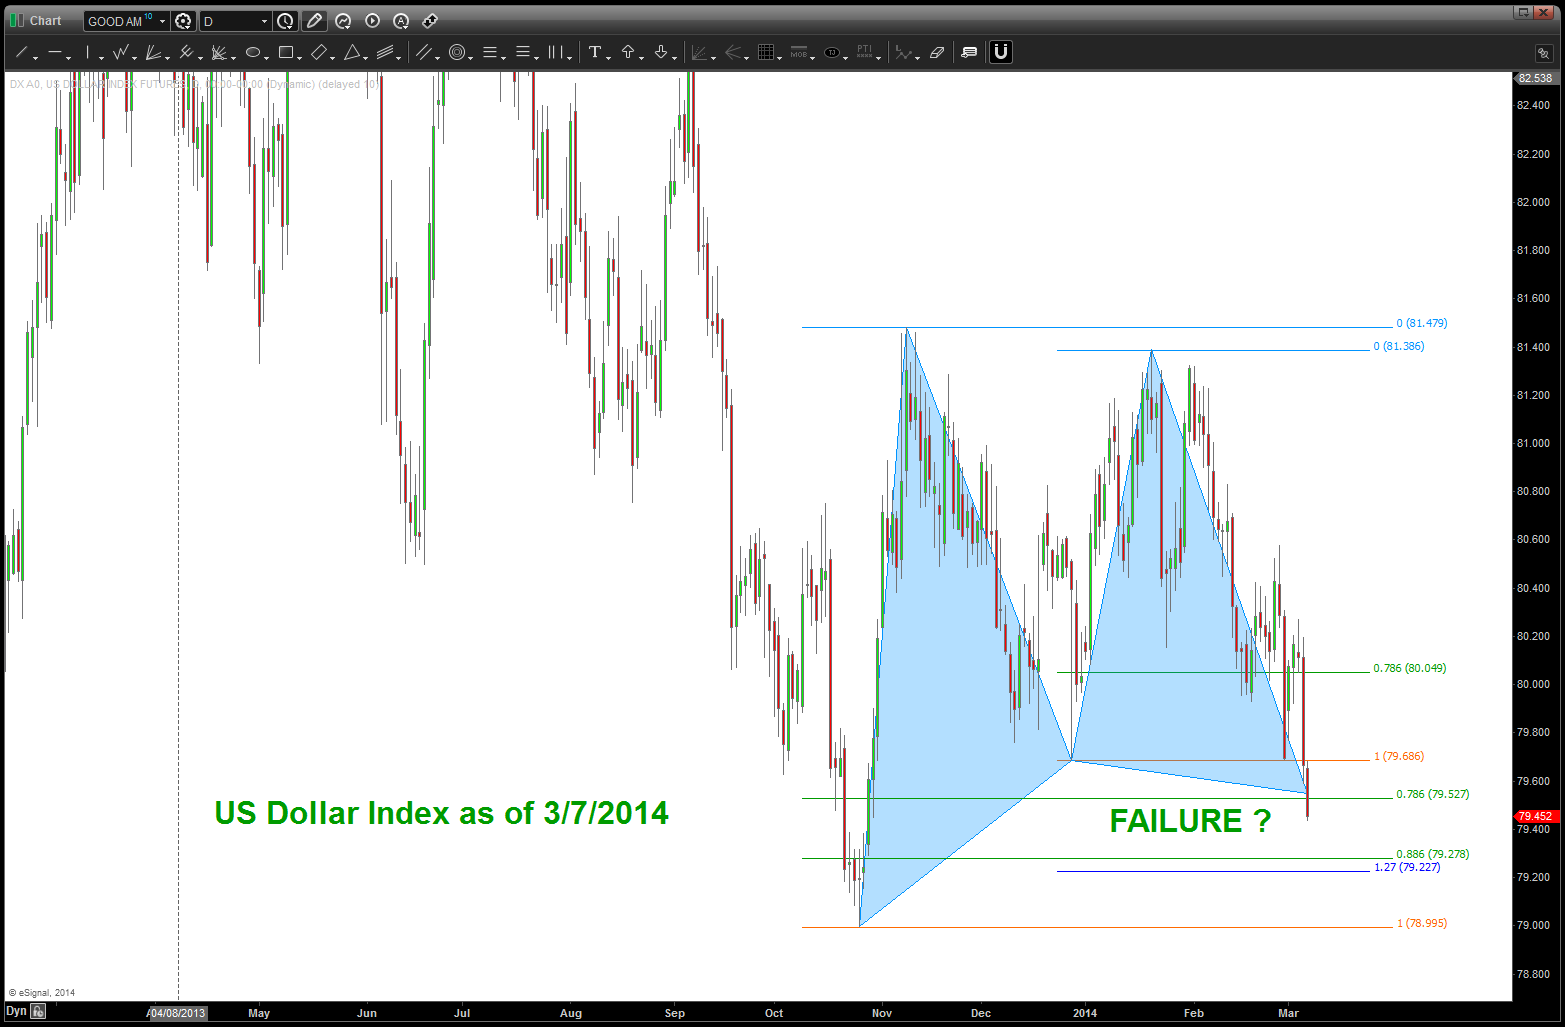
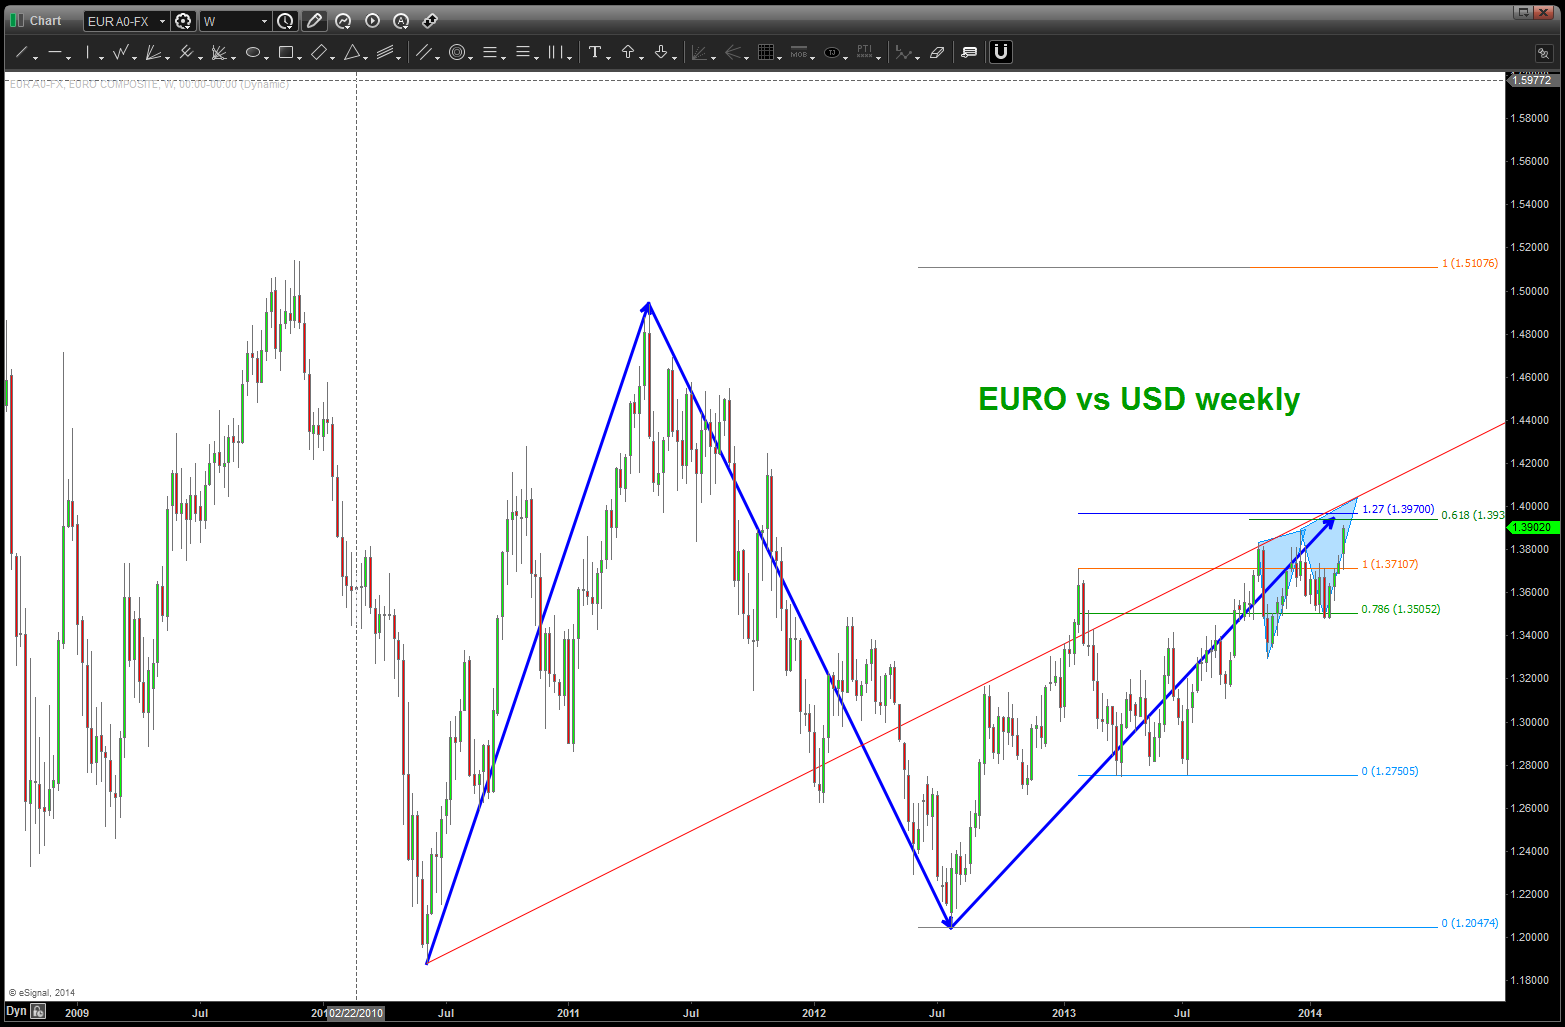
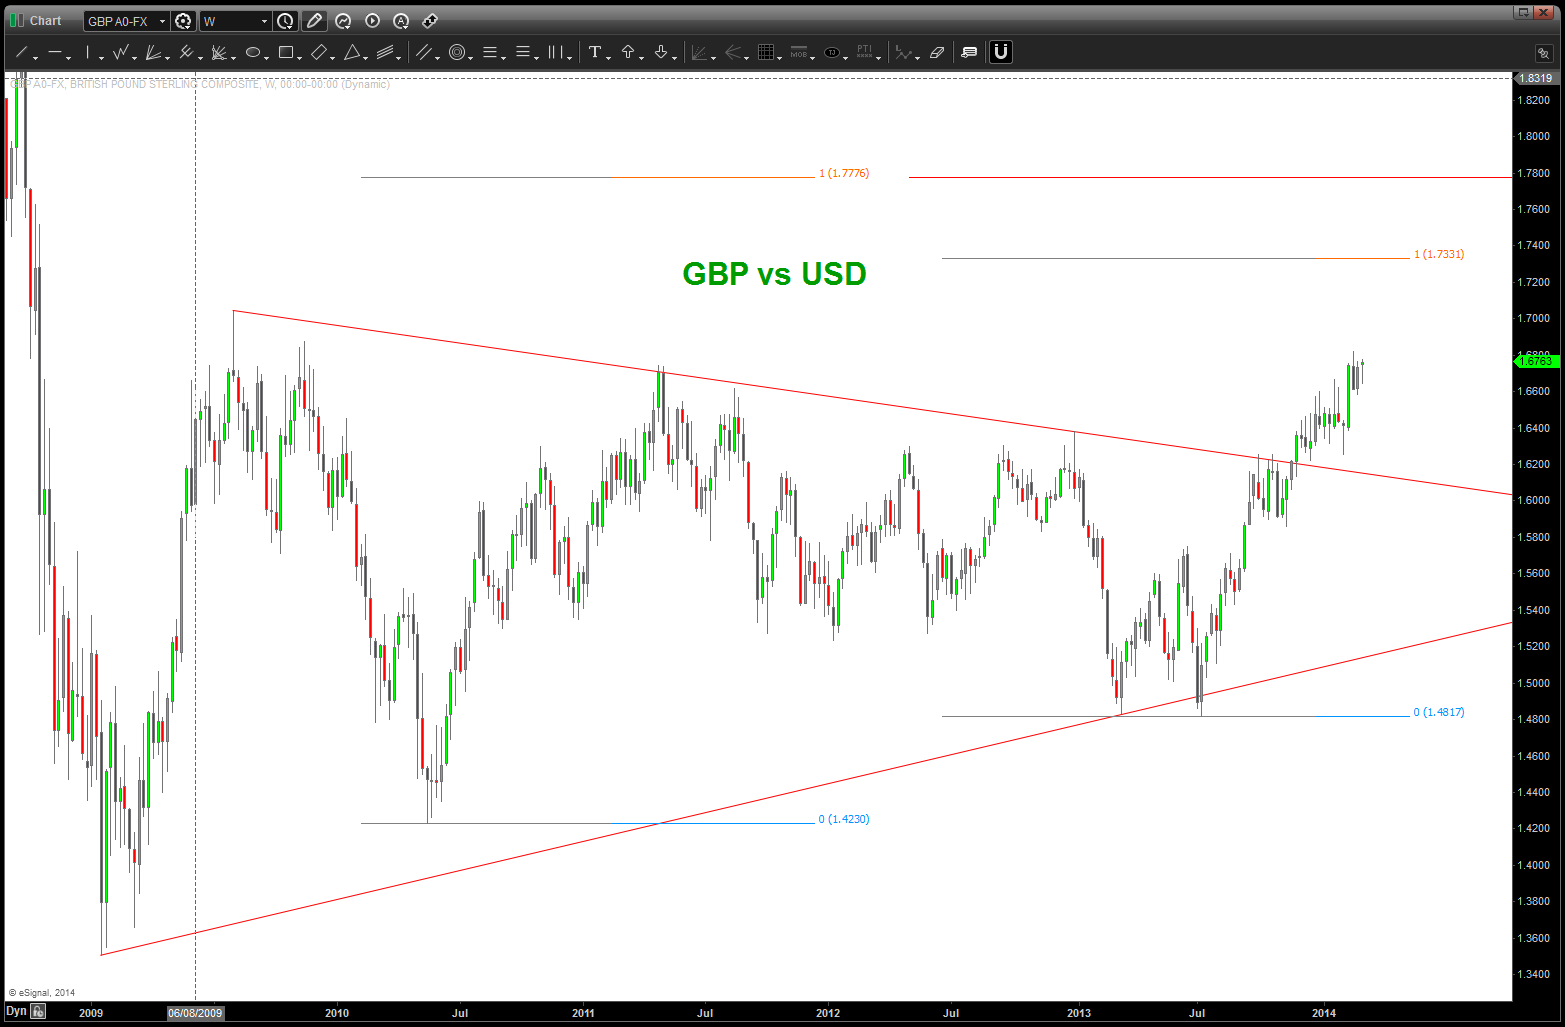
Dollar Index update before NFP
Posted on March 7, 2014 Leave a Comment
Cliff Notes:
- thrust and momentum into the final pattern level at 79.52 is strong // warns of a failure. a BIG deal.
- losing this level will open 79.00 // can’t stress enough the importance of this most recent action w/in the FX world.
- Chinese Yuan completed a perfect pattern and is moving up .. (WATCH THIS CLOSELY)
Chinese Yuan continued
Posted on March 5, 2014 Leave a Comment
in our last post we proposed 3 outcomes:
- the intervention was a shot across the bow … ruffle the feathers, so to speak, of the derivatives and carry trades being worked on this “no brainer” trade…
- it was the normal course of events, and things would return back to normal.
- this was a trend change and it could have global repercussions.
obviously, we don’t want the last one and right now it appears that we are somewhere in between the first two bullets above. that being said, trying to NOT take into account that this isn’t truly a liquid instrument I still “trust” that the patterns will prevail. So, some key levels are noted. Let’s watch the show because the last thing we want is support to hold and then interventions and massive moves up to occur.
right now …everything is normal?
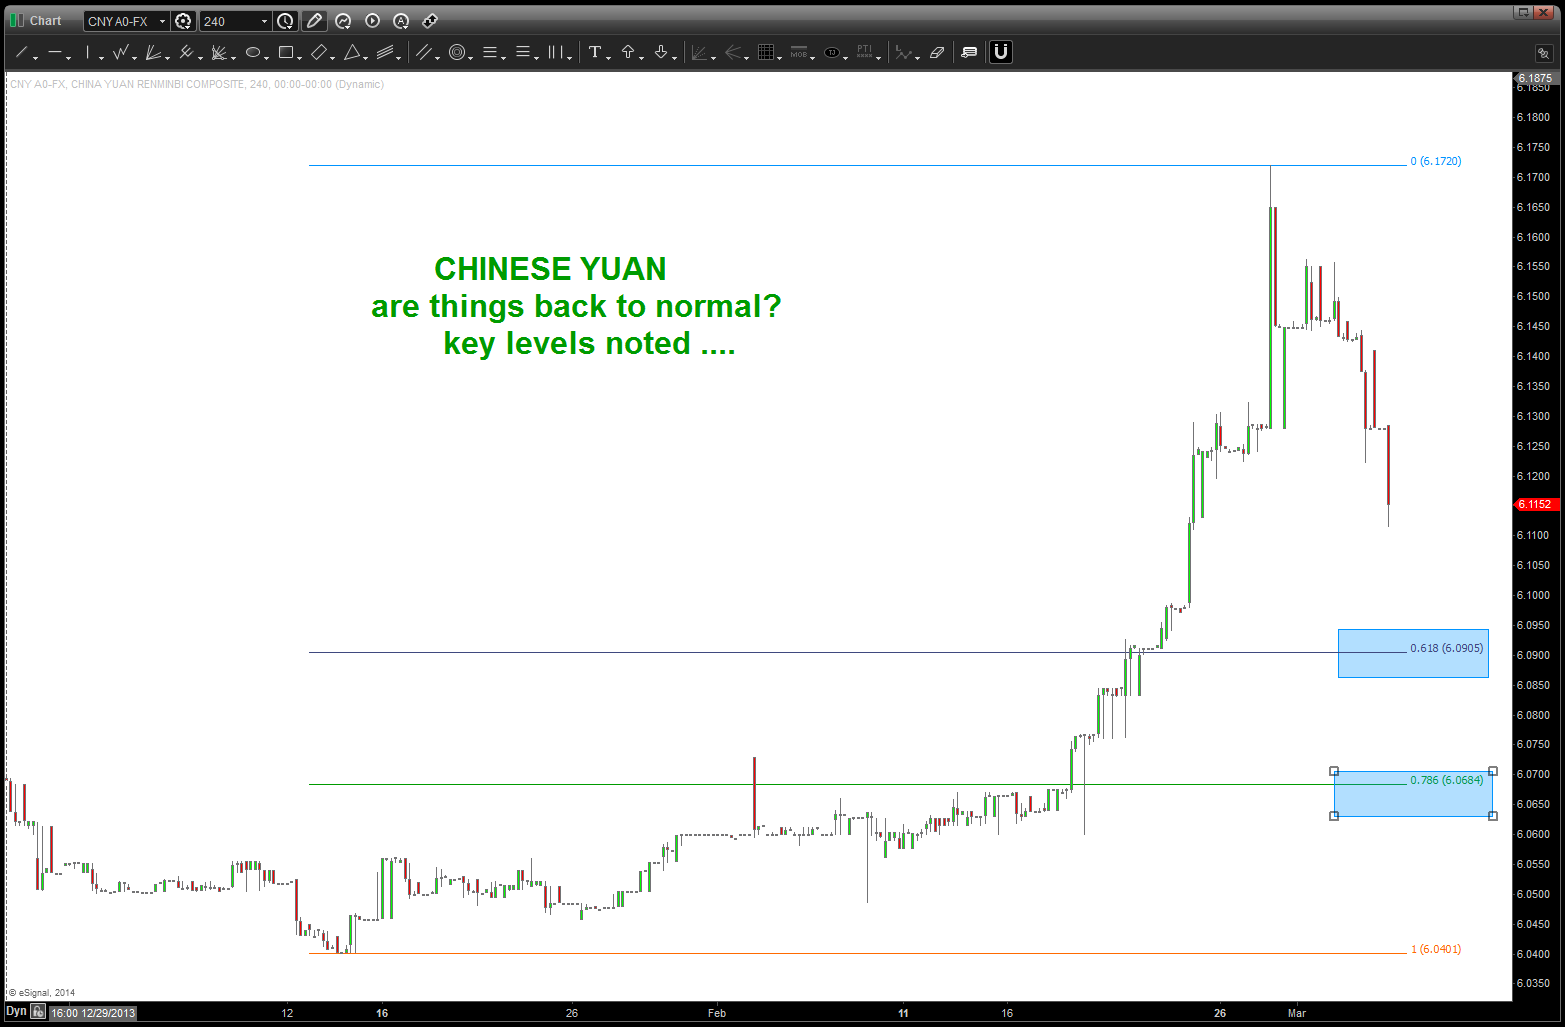
Chart of the Day … the BEARISH PATTERN completing on XLF
Posted on March 5, 2014 Leave a Comment
CLIFF NOTE: the classic AB=CD sell pattern is complete on the XLF.
my last post on XLF depicting this pattern: https://bartscharts.com/2013/09/14/part-ii-the-sp-500-and-too-big-to-fail/
it’s all probability and, quite frankly, the probability certainly appears to be in the favor of the bulls …
so, the financials “broke out” and, as a PURE pattern recognition chartist they broke out right into a bearish sell pattern …


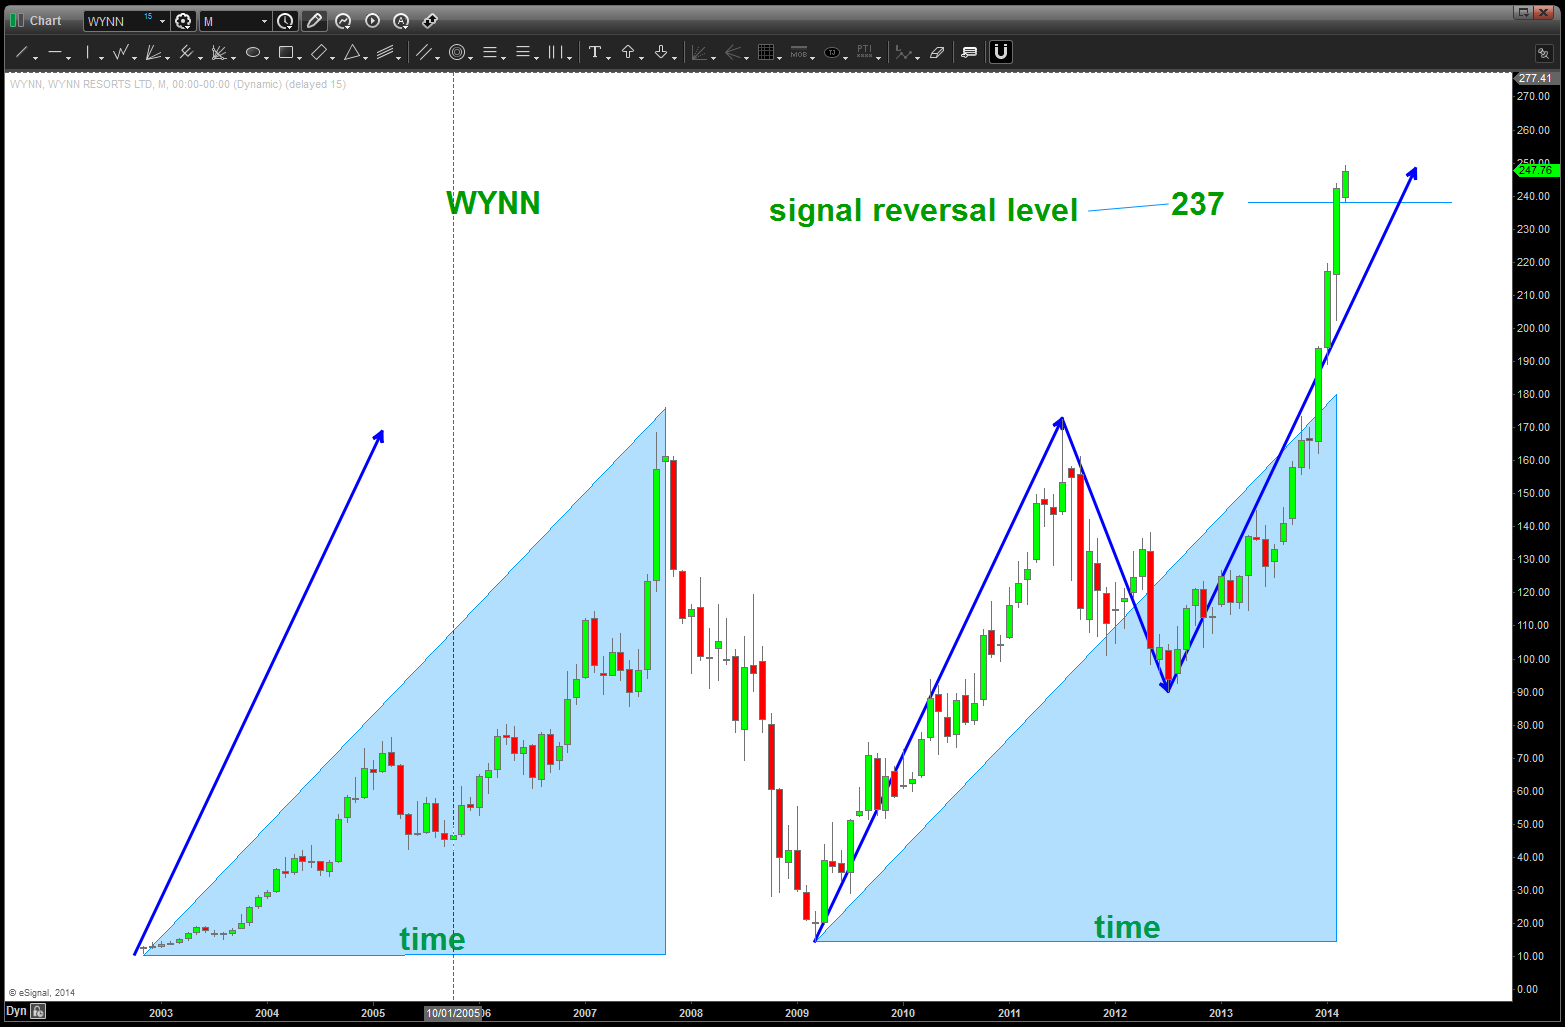
WYNN pattern complete
Posted on March 5, 2014 2 Comments
cliff notes:
- candle strength is still strong but the target that we ID’d has been hit.
- wait for a MONTHLY signal reversal candle to go short.
- the last 4 months of candles are very powerful, so be patient.
- the original sell pattern got steam rolled so … wait for some weakness on this one.
- https://bartscharts.com/2014/02/27/wynn-update/ – was last update
A monster move …
Posted on March 3, 2014 Leave a Comment
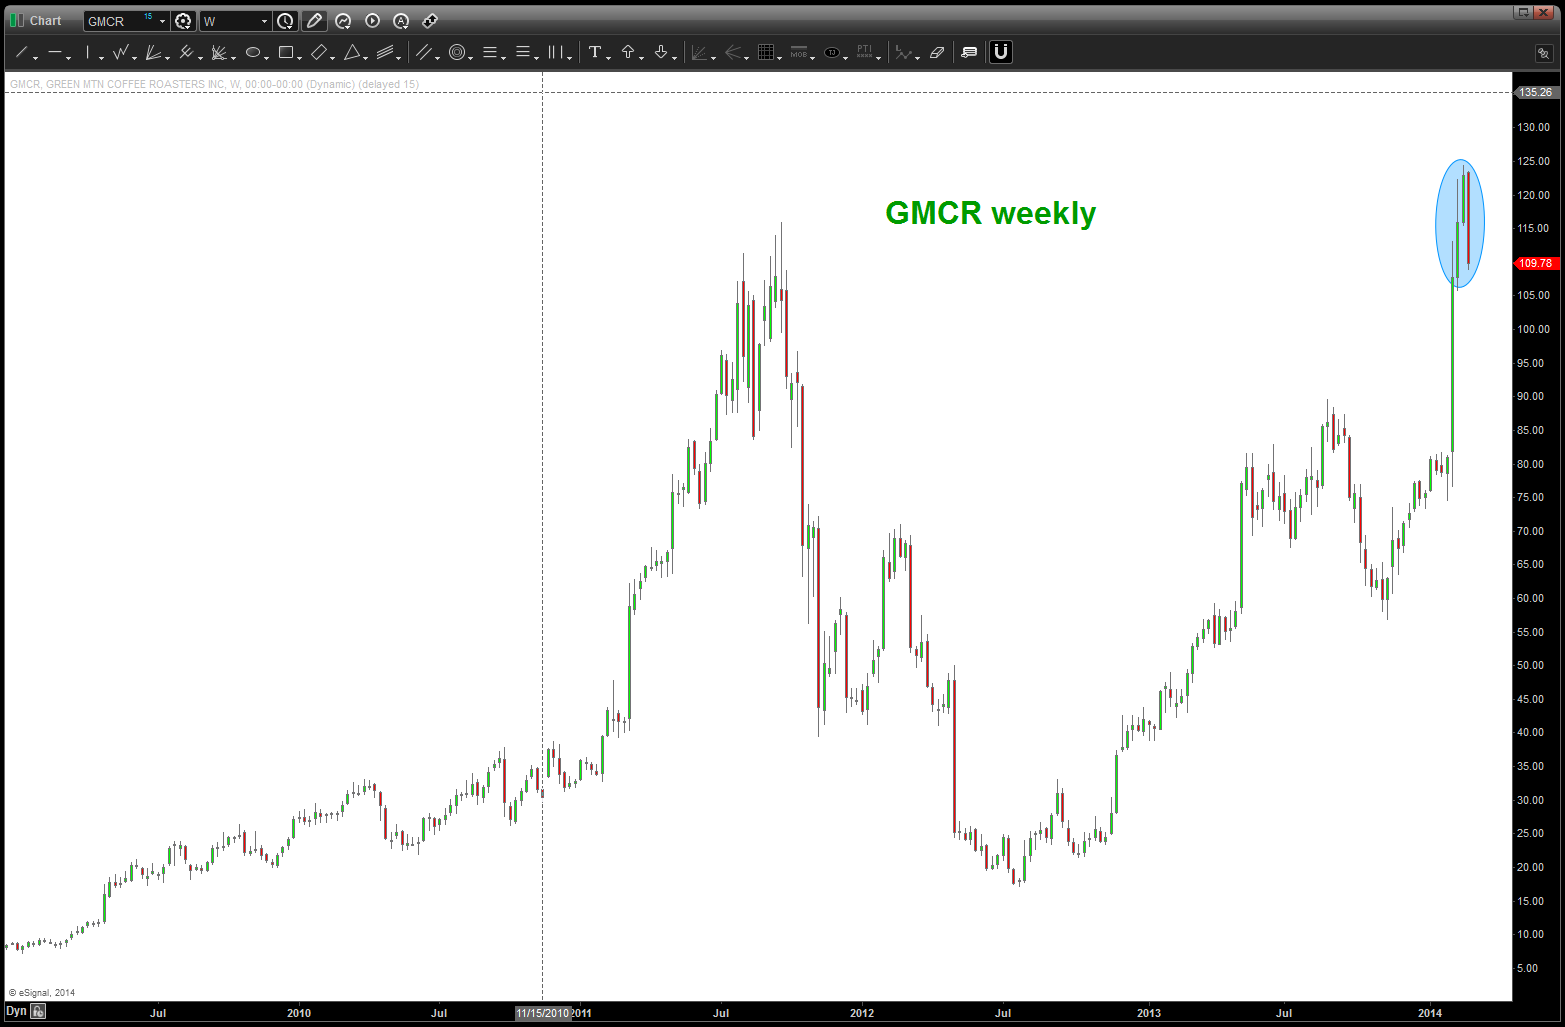
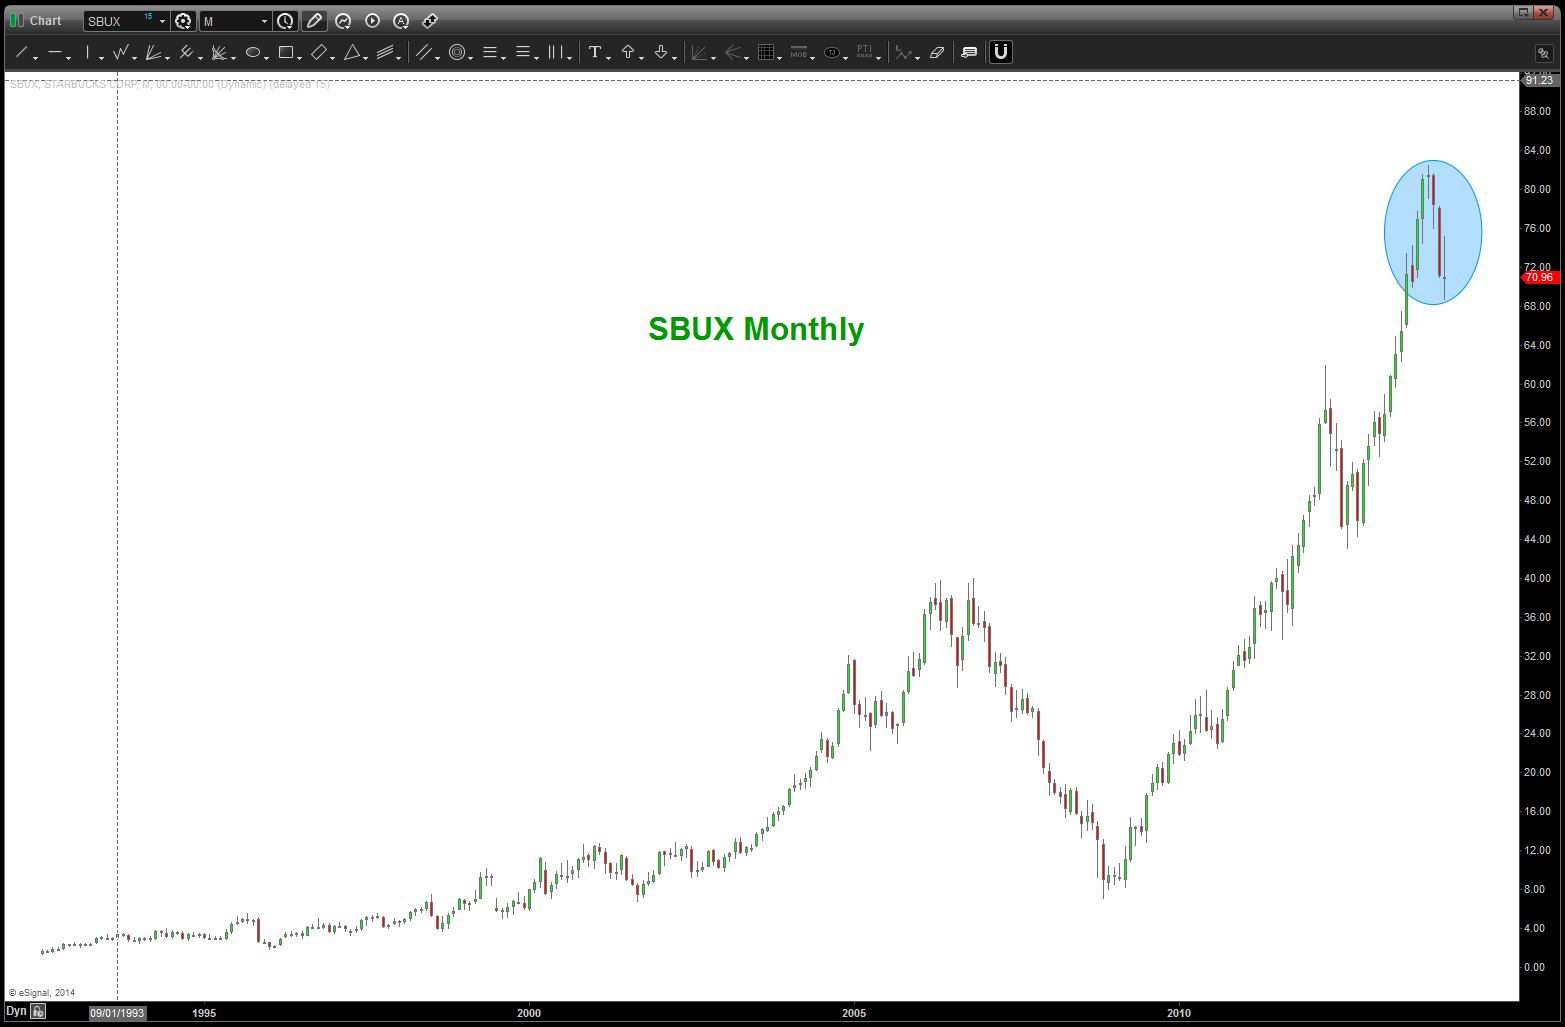
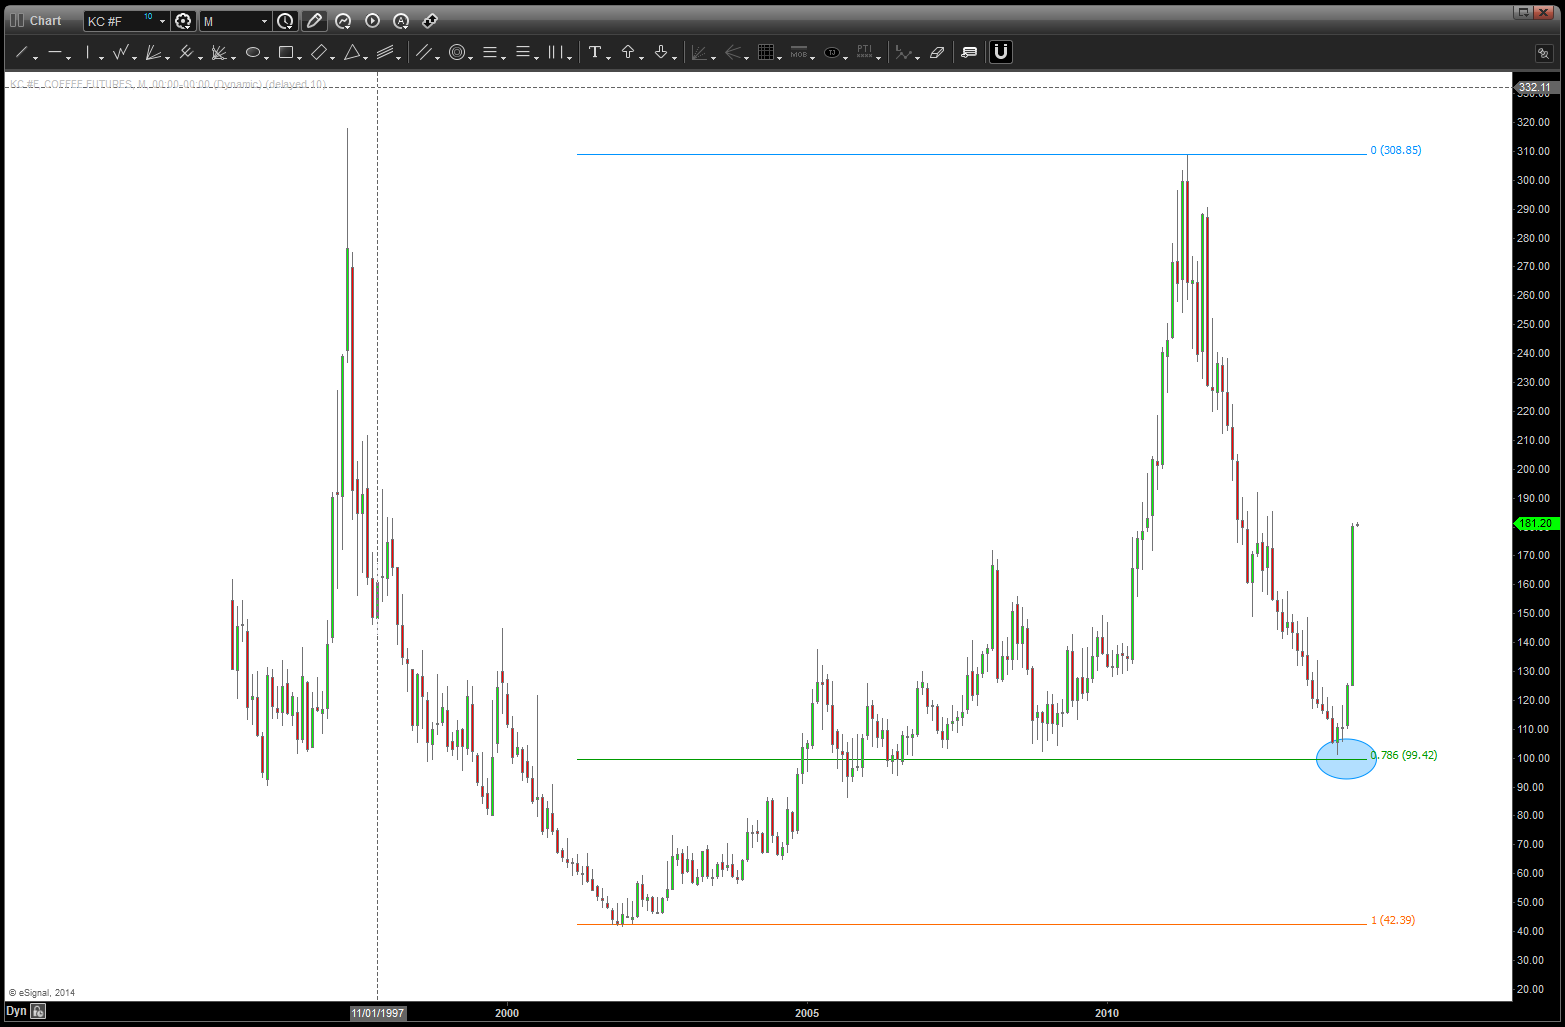
a lot of work goes into finding high probability set-ups … this was our last post on Coffee Futures and SBUX. I had been trying to find an end (not trying to call a top but simply look for a pattern) to the SBUX run. Ratio analysis was finally sealed the deal for me …
the cliff notes was that it wasn’t the price of coffee but the relative strength (COFFEE/SBUX) that had synced nicely.
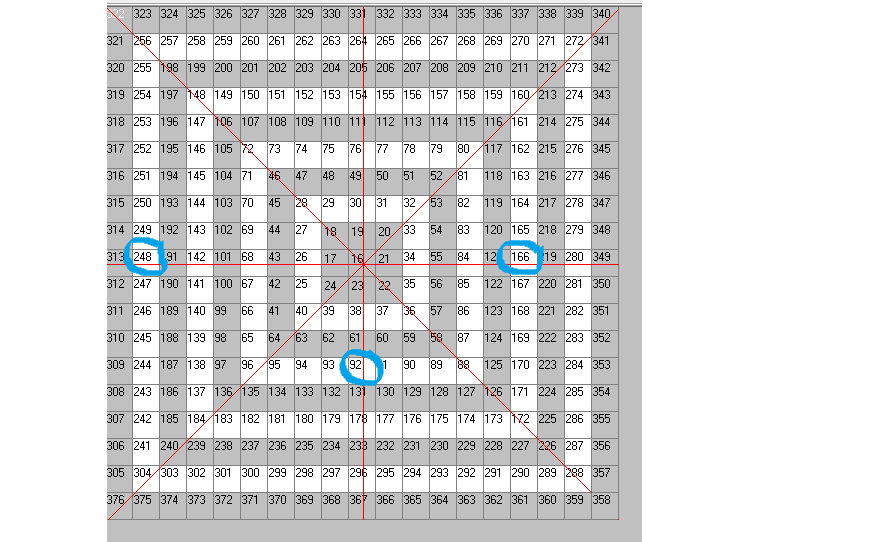
the Coffee futures came down to the monthly node ID’d here:
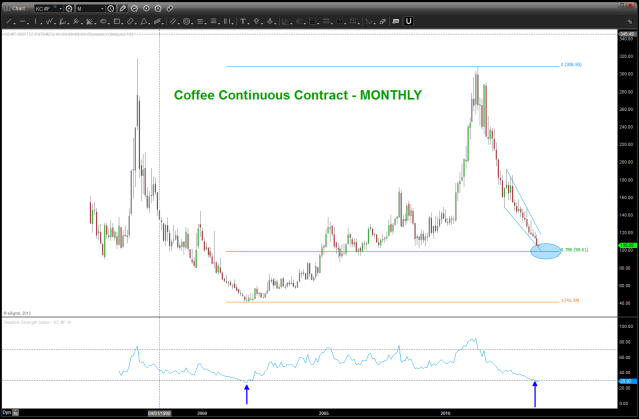 and the result …
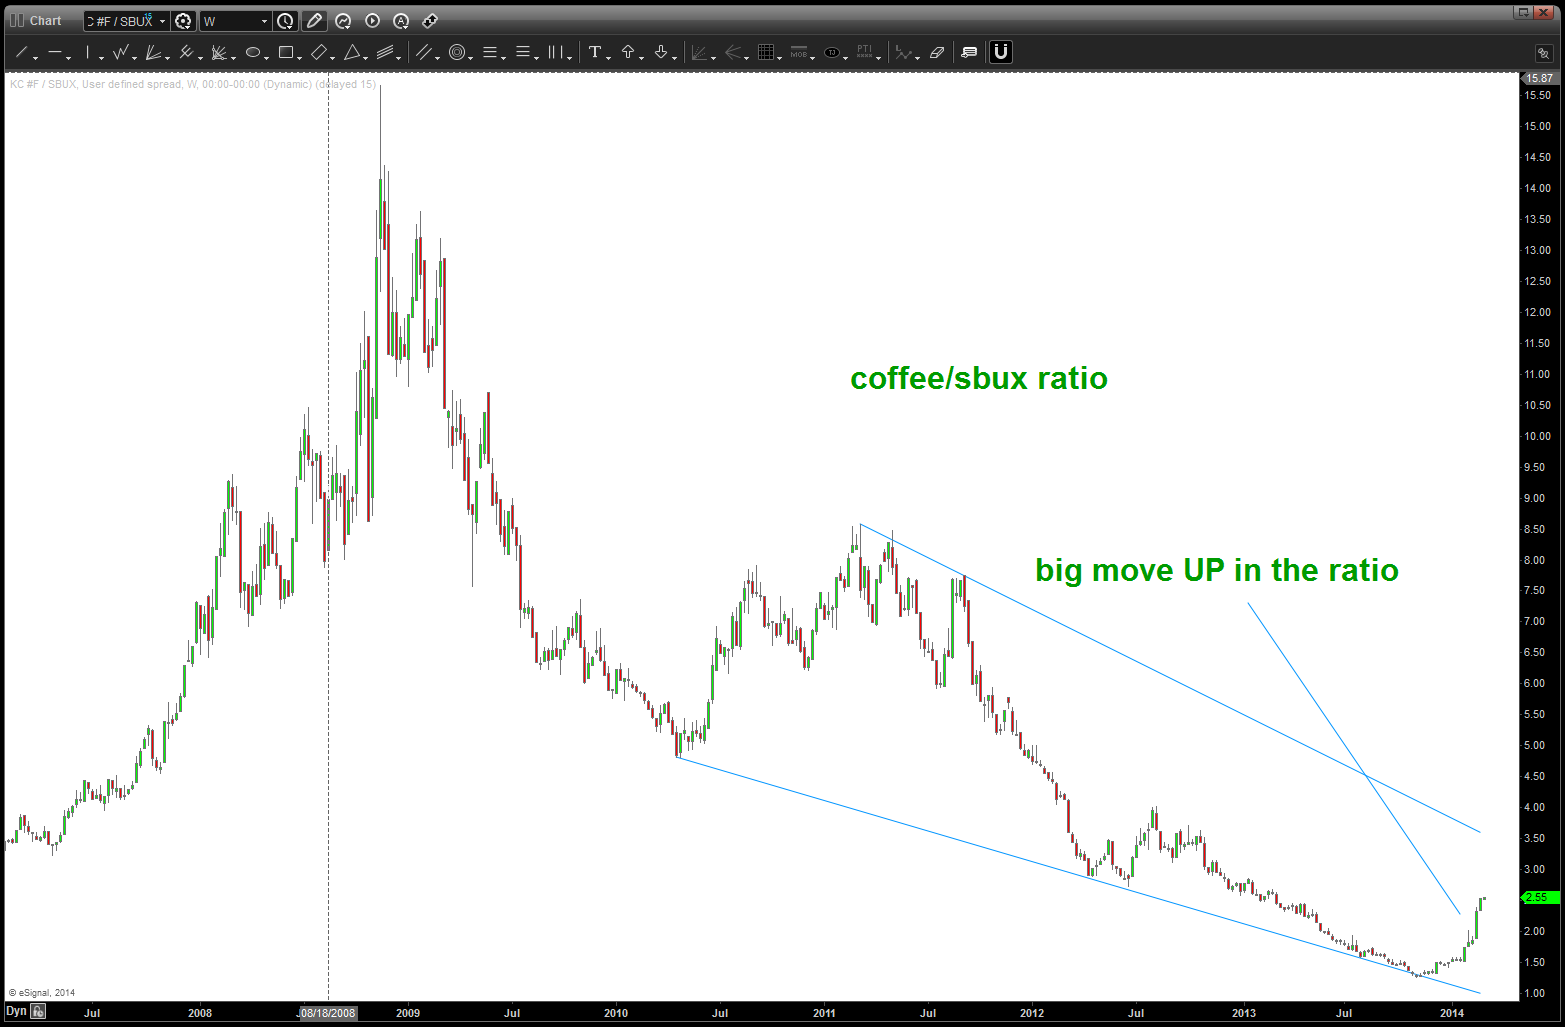
folks, this is a monster move! so what happened to the ratio?
the COFFEE/SBUX ratio before:
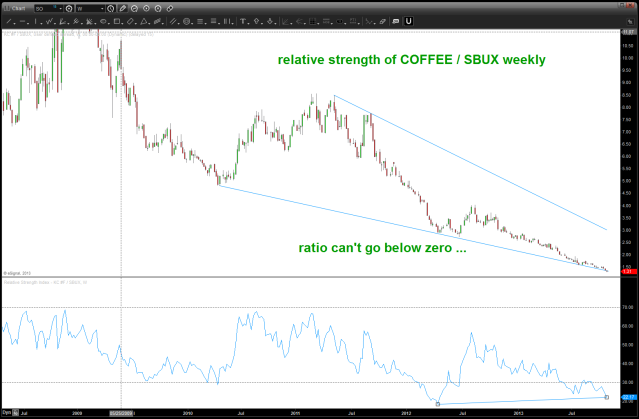
the COFFEE/SBUX ratio after:
here’s the charts of SBUX and GMCR