Loonie, the Dollar and the Oil Services Index
Posted on April 1, 2014 Leave a Comment
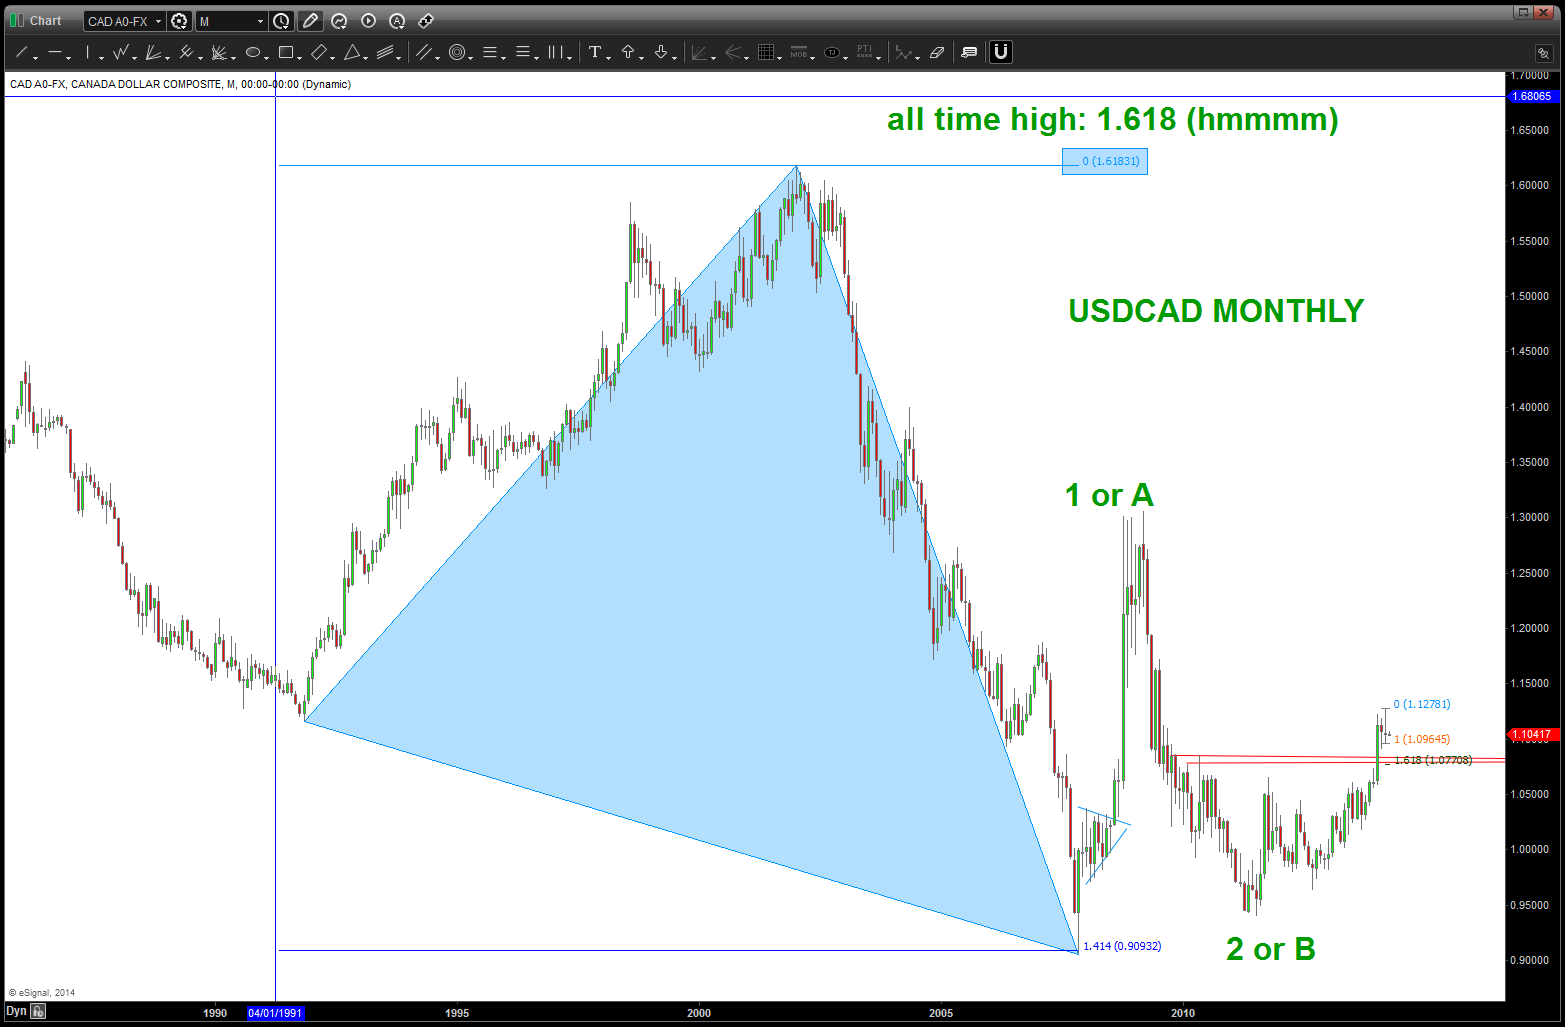
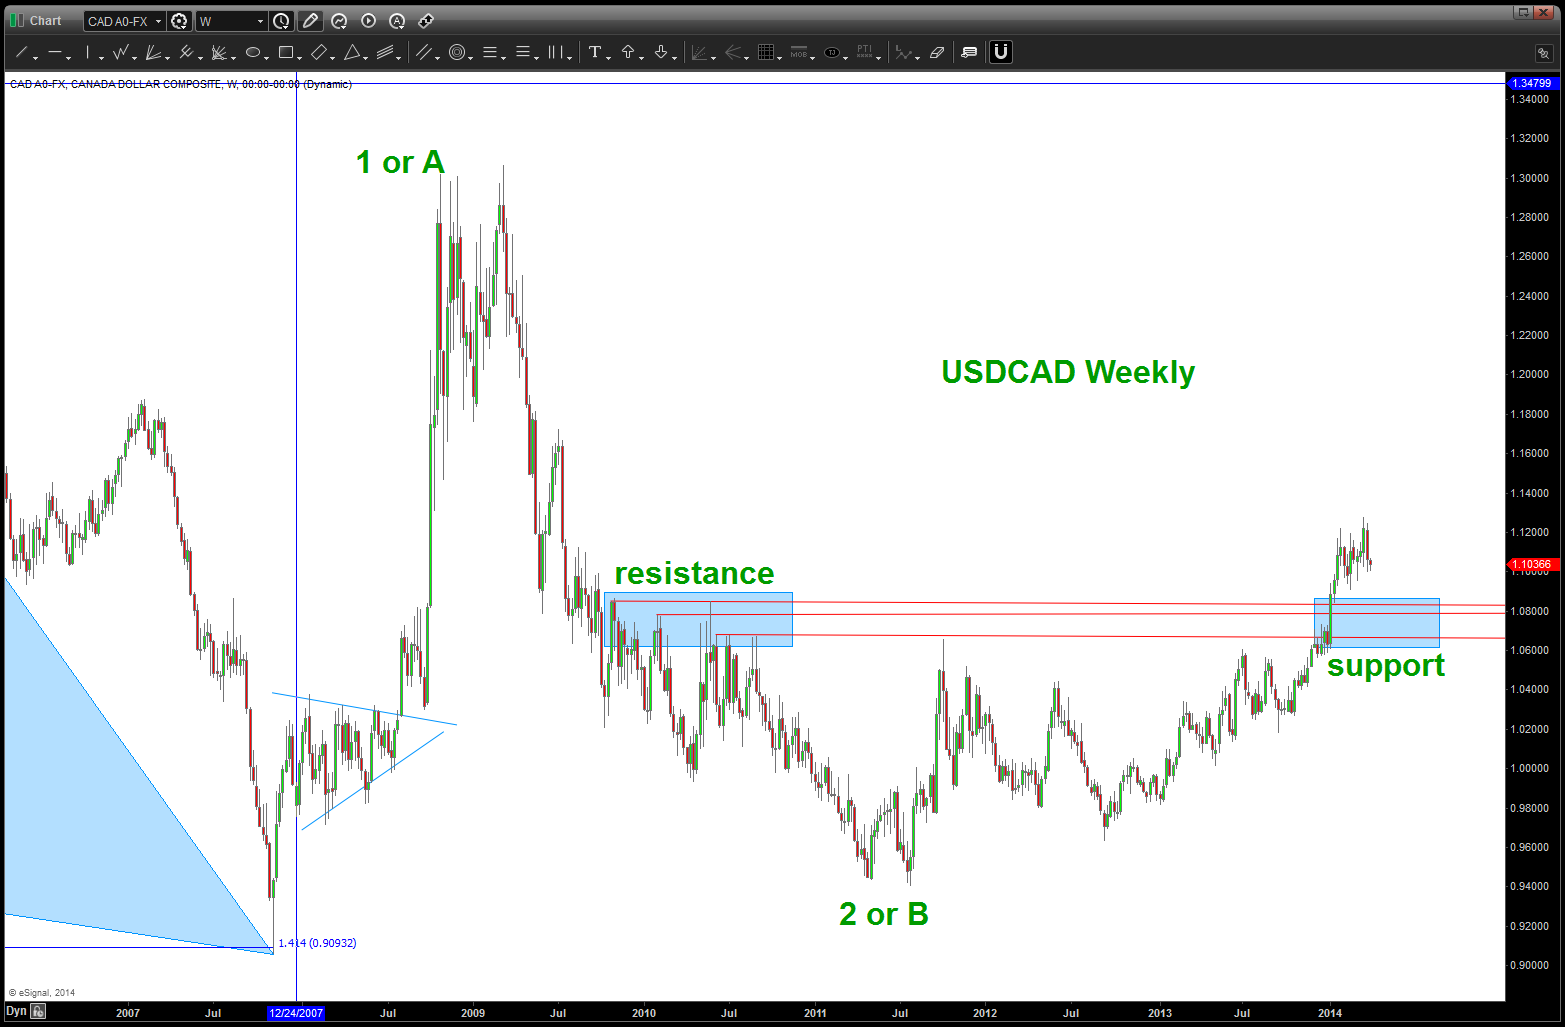
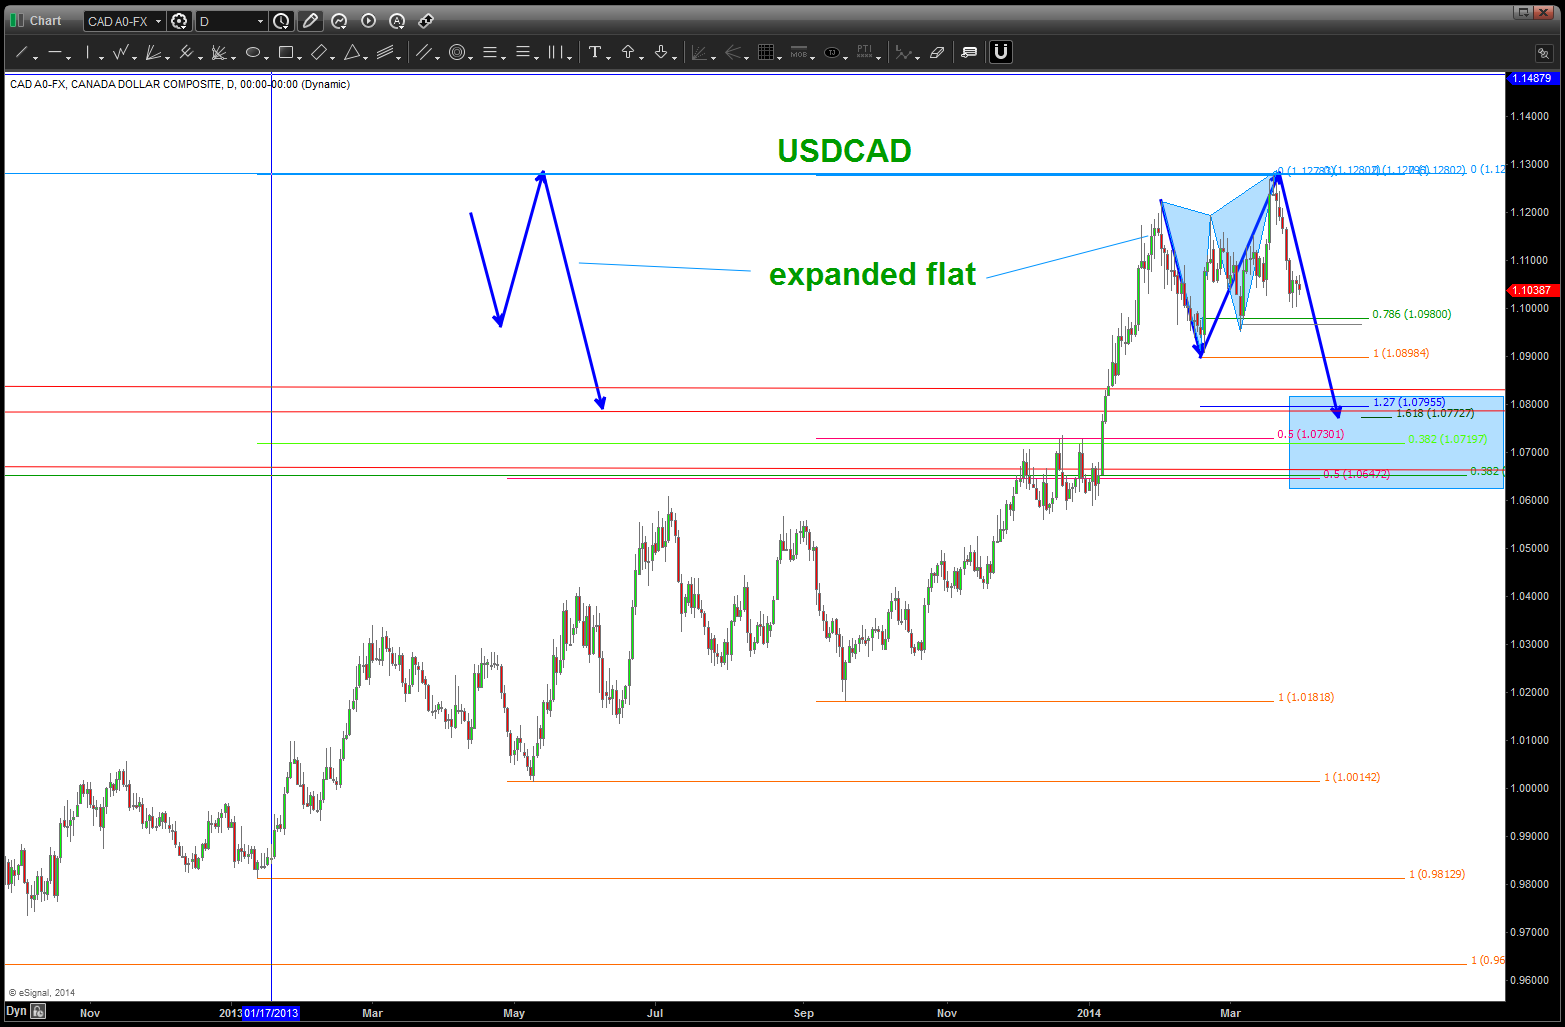
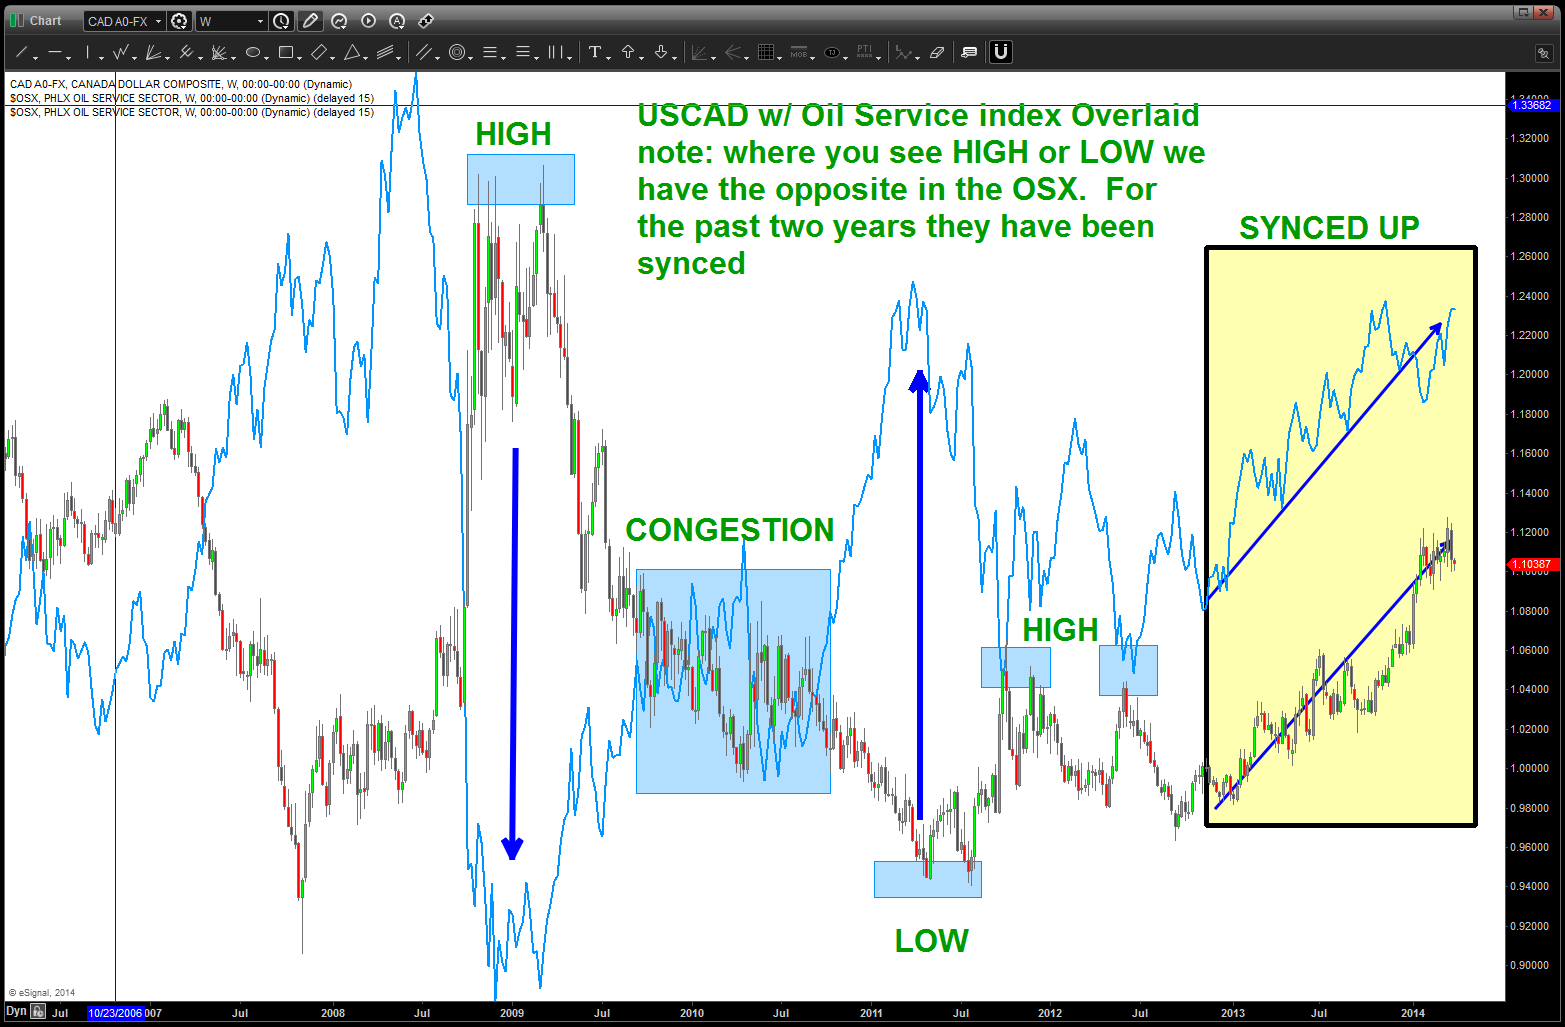
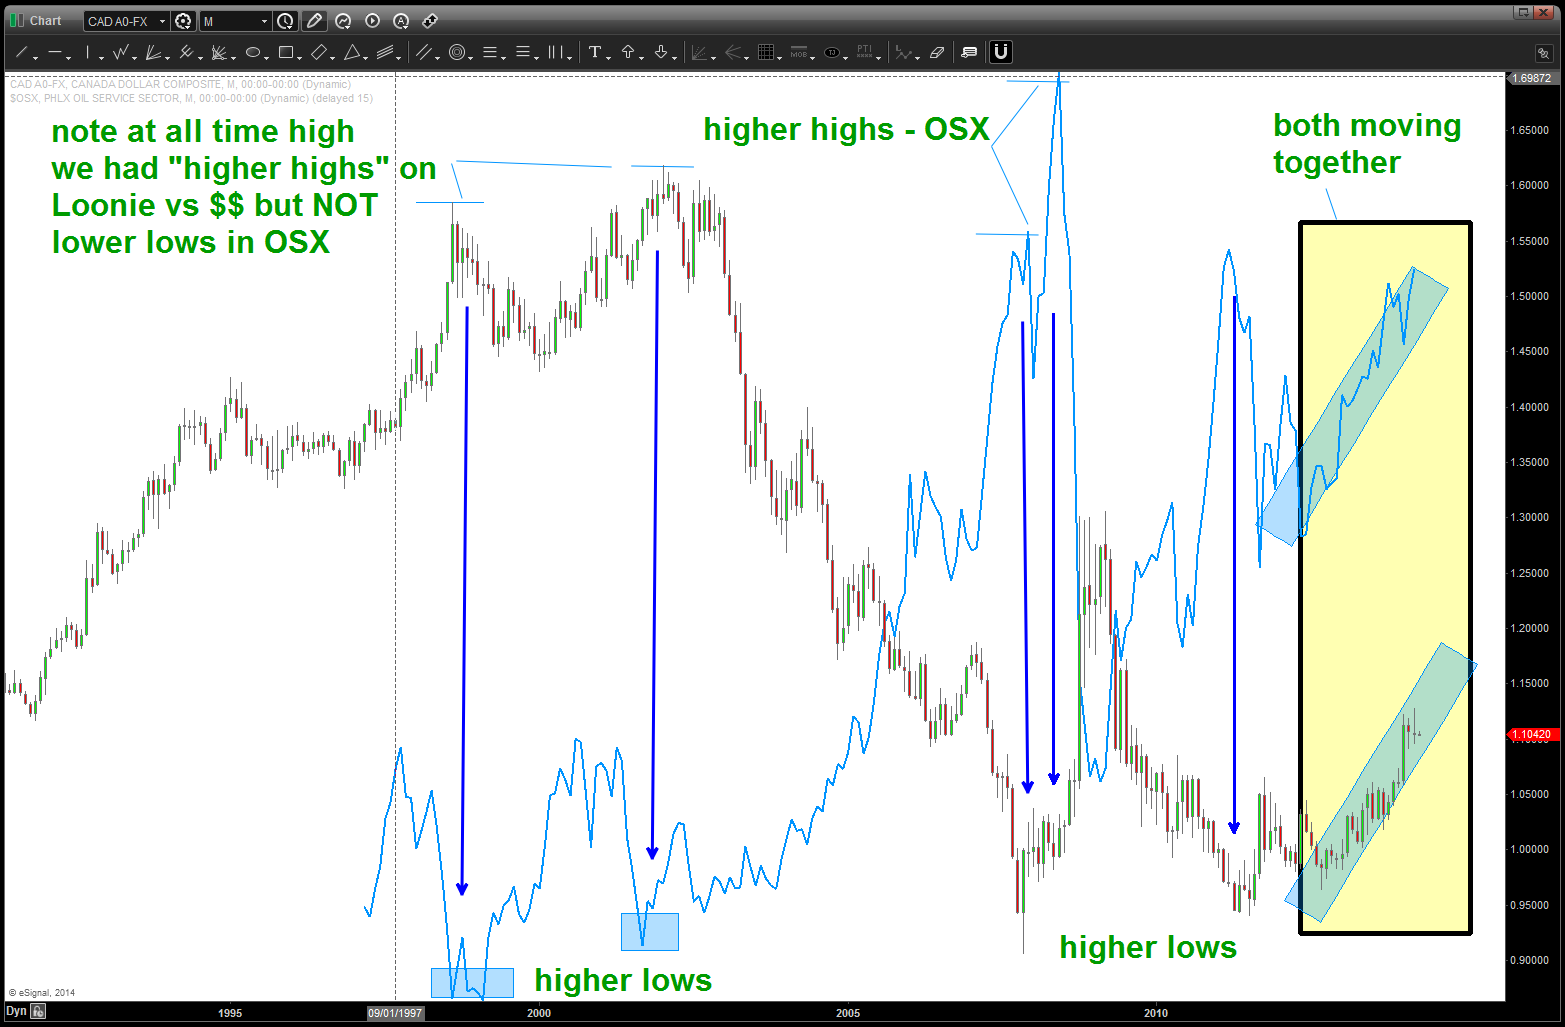
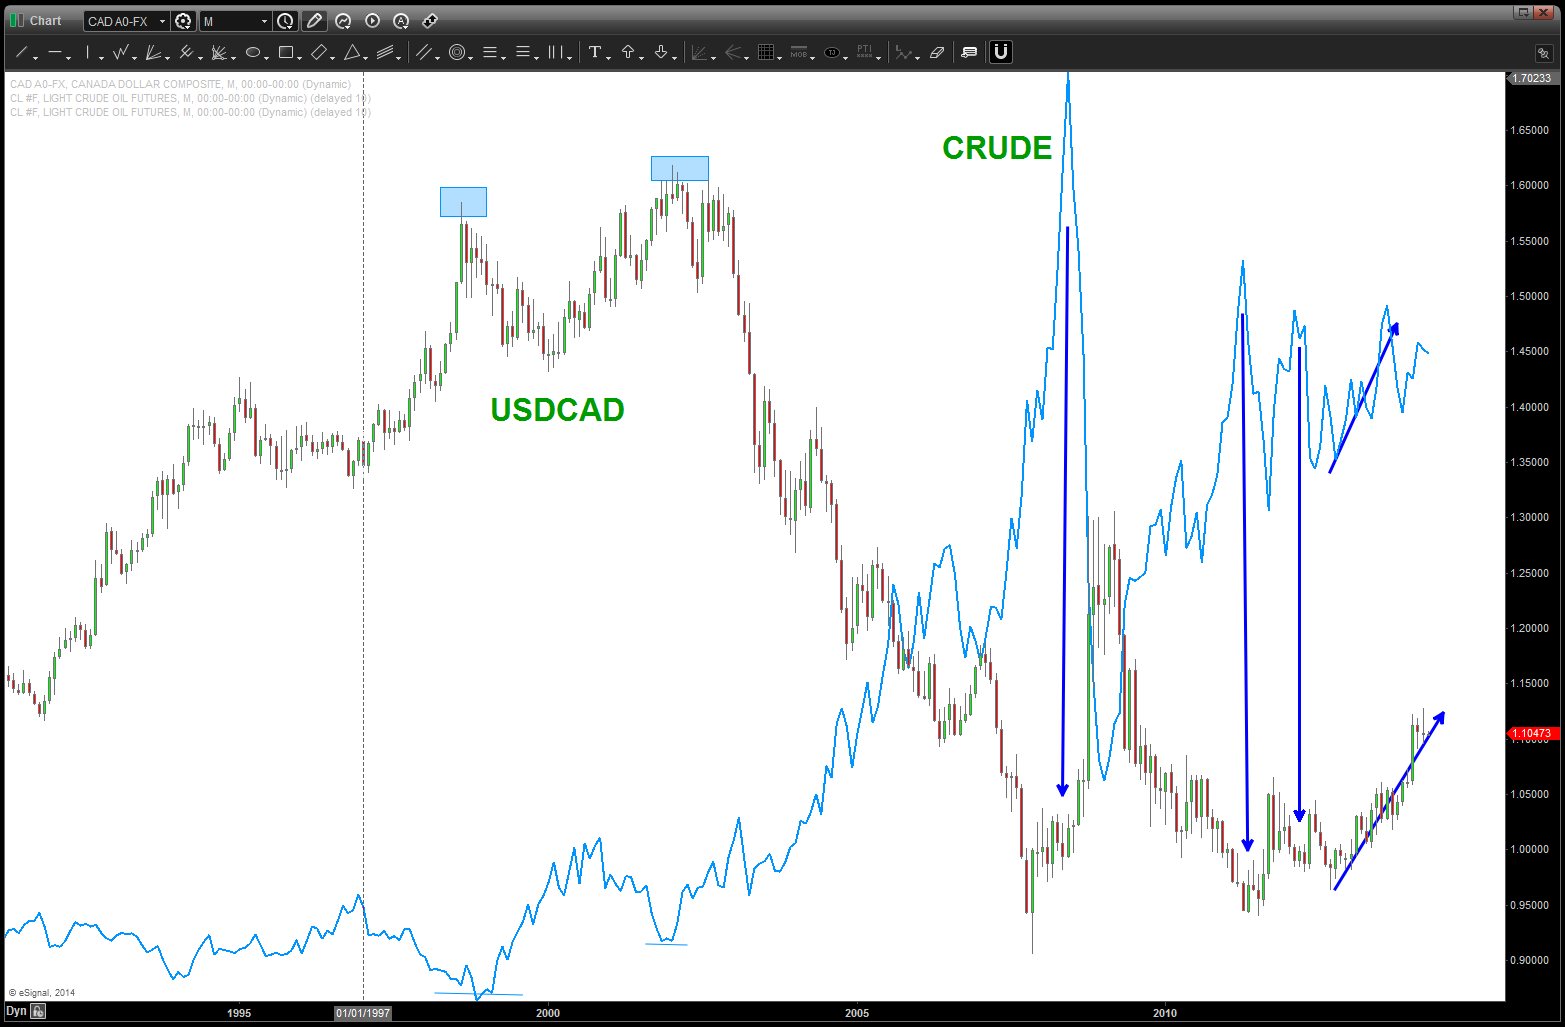
CLIFF NOTES: USD support for BUY opportunity shown//very important divergence present in OSX and LOONIE vs USD. for the life of the data they have moved opposite but for the past 2 years they have rolled together. while they have lead/lagged they have, essentially, been doing the opposite at tops and bottoms. When one tops the other bottoms and vice versa.
so, at times, one could look to the Oil Service Sector and see if a BUY or SELL pattern completed and then look for the opposite pattern to appear on the Loonie vs the USD. For two years that has not been the case .. they are moving together. They could roll together into infinity but something certainly doesn’t make sense …
so compare the commodity currencies (AUD/NZD/CAD) against each other ….BOOM a beautiful SELL PATTERN on the AUDCAD
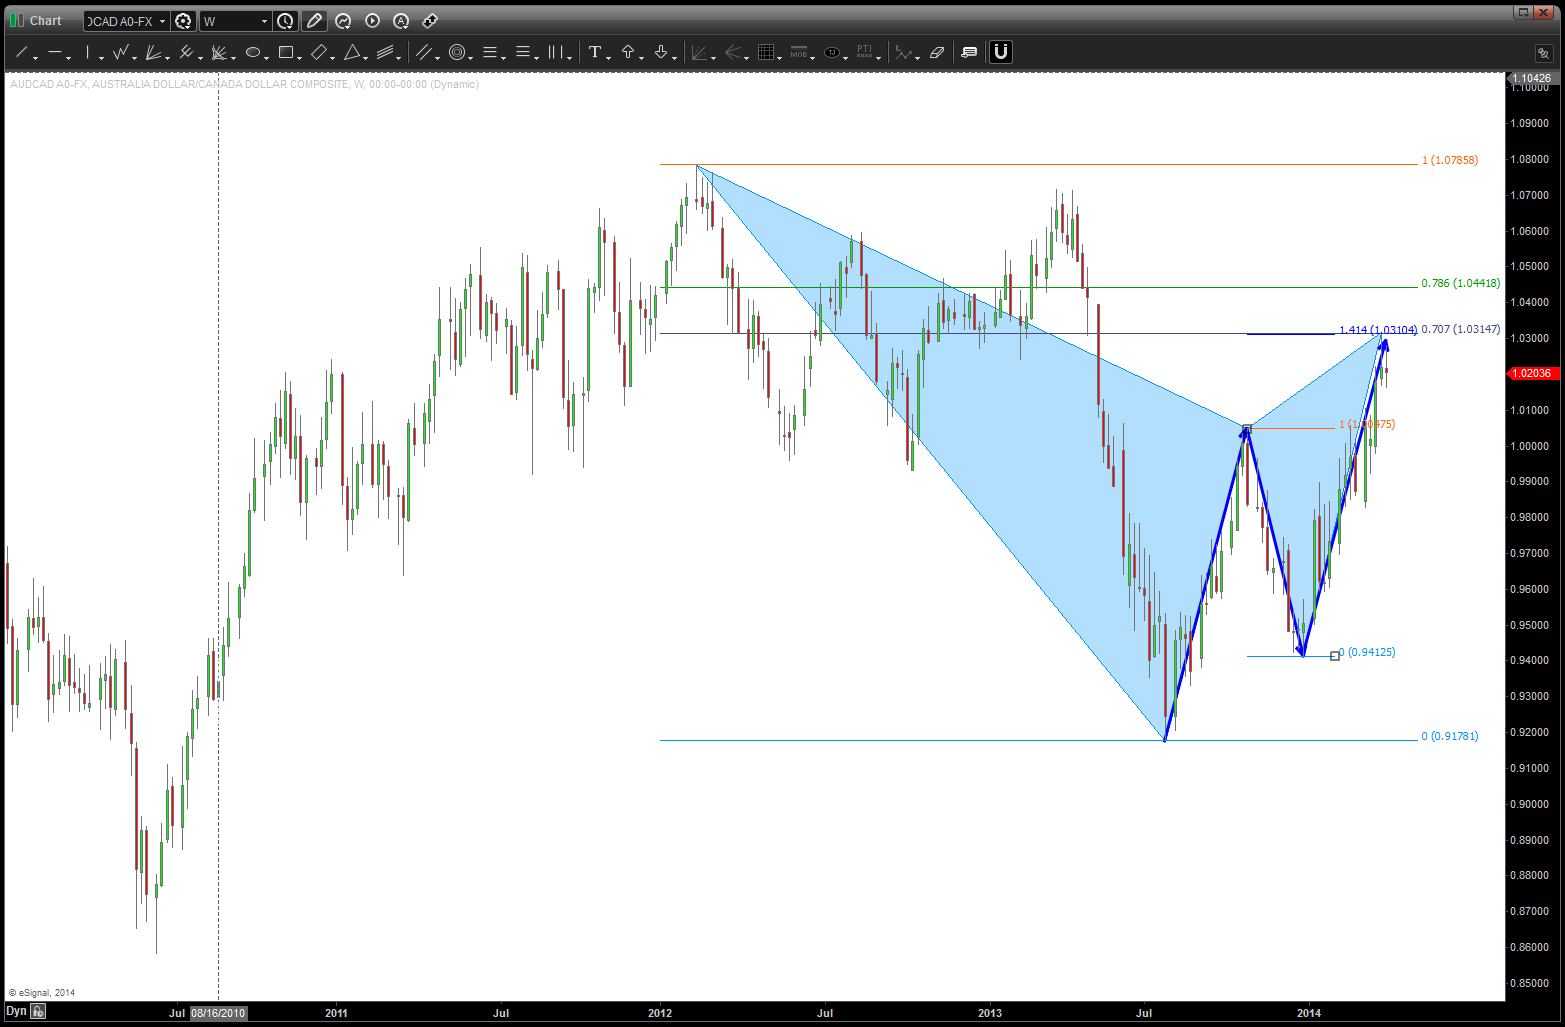
CLIFF NOTES: Loonie “should” strengthen against the AUSSIE
how about CNZDCAD? not suprising — KIWI is kicking everyones butt right now … it’s at an all time high against the LOONIE w/ strength.
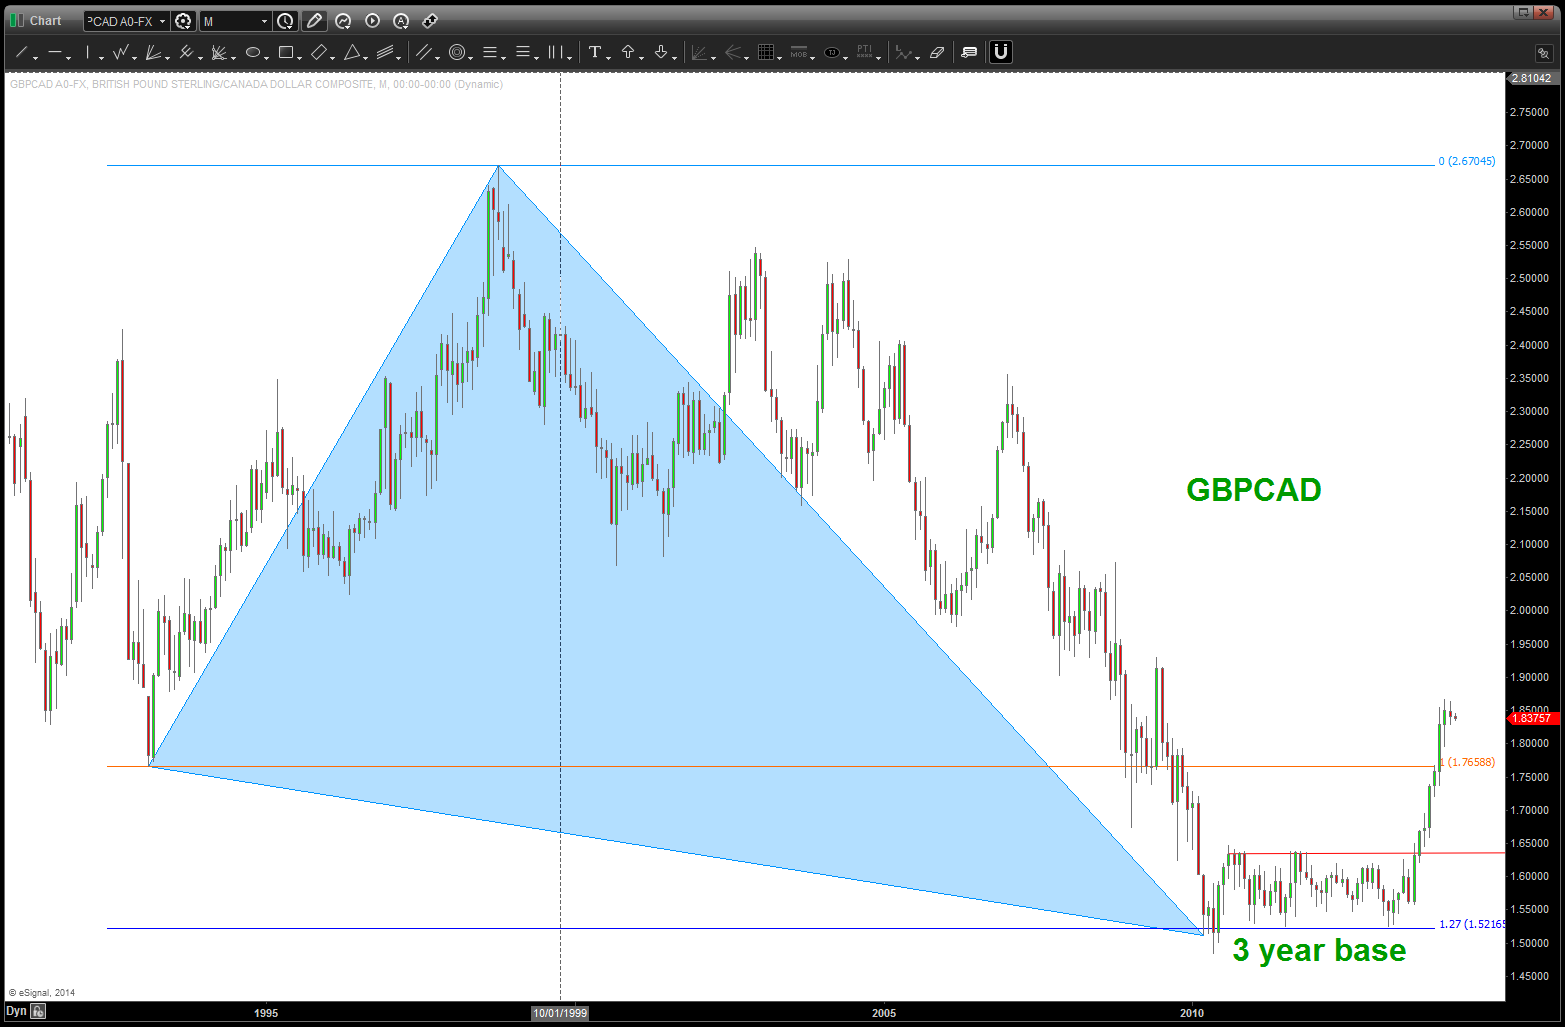
GBPCAD:
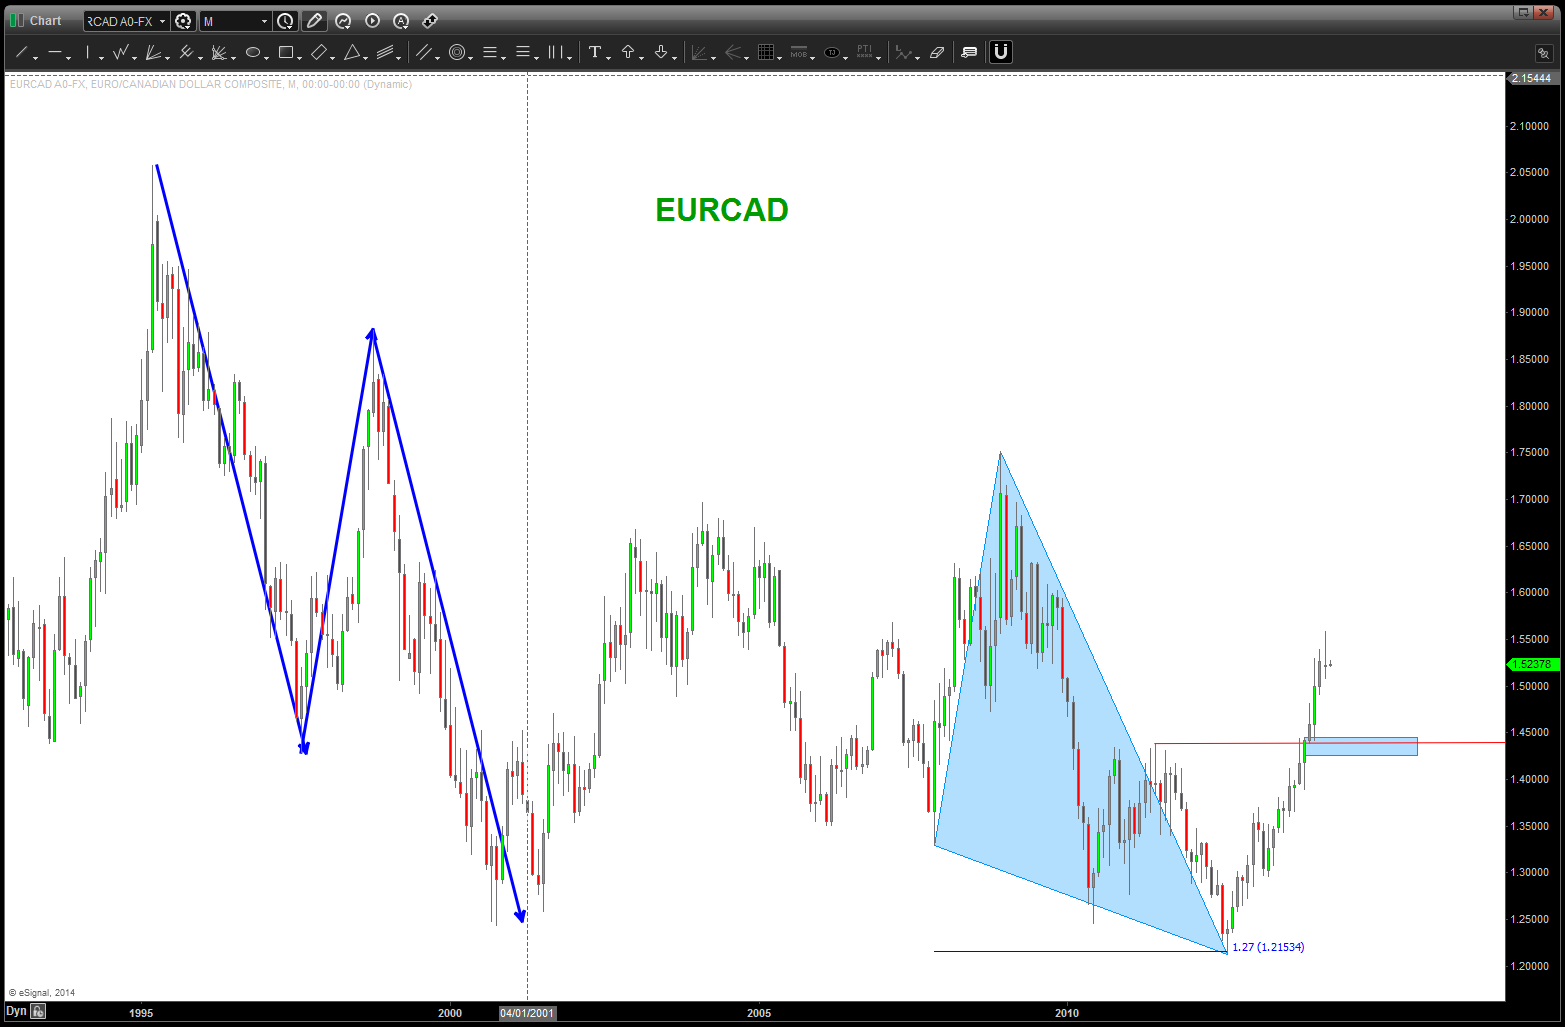
EURCAD:
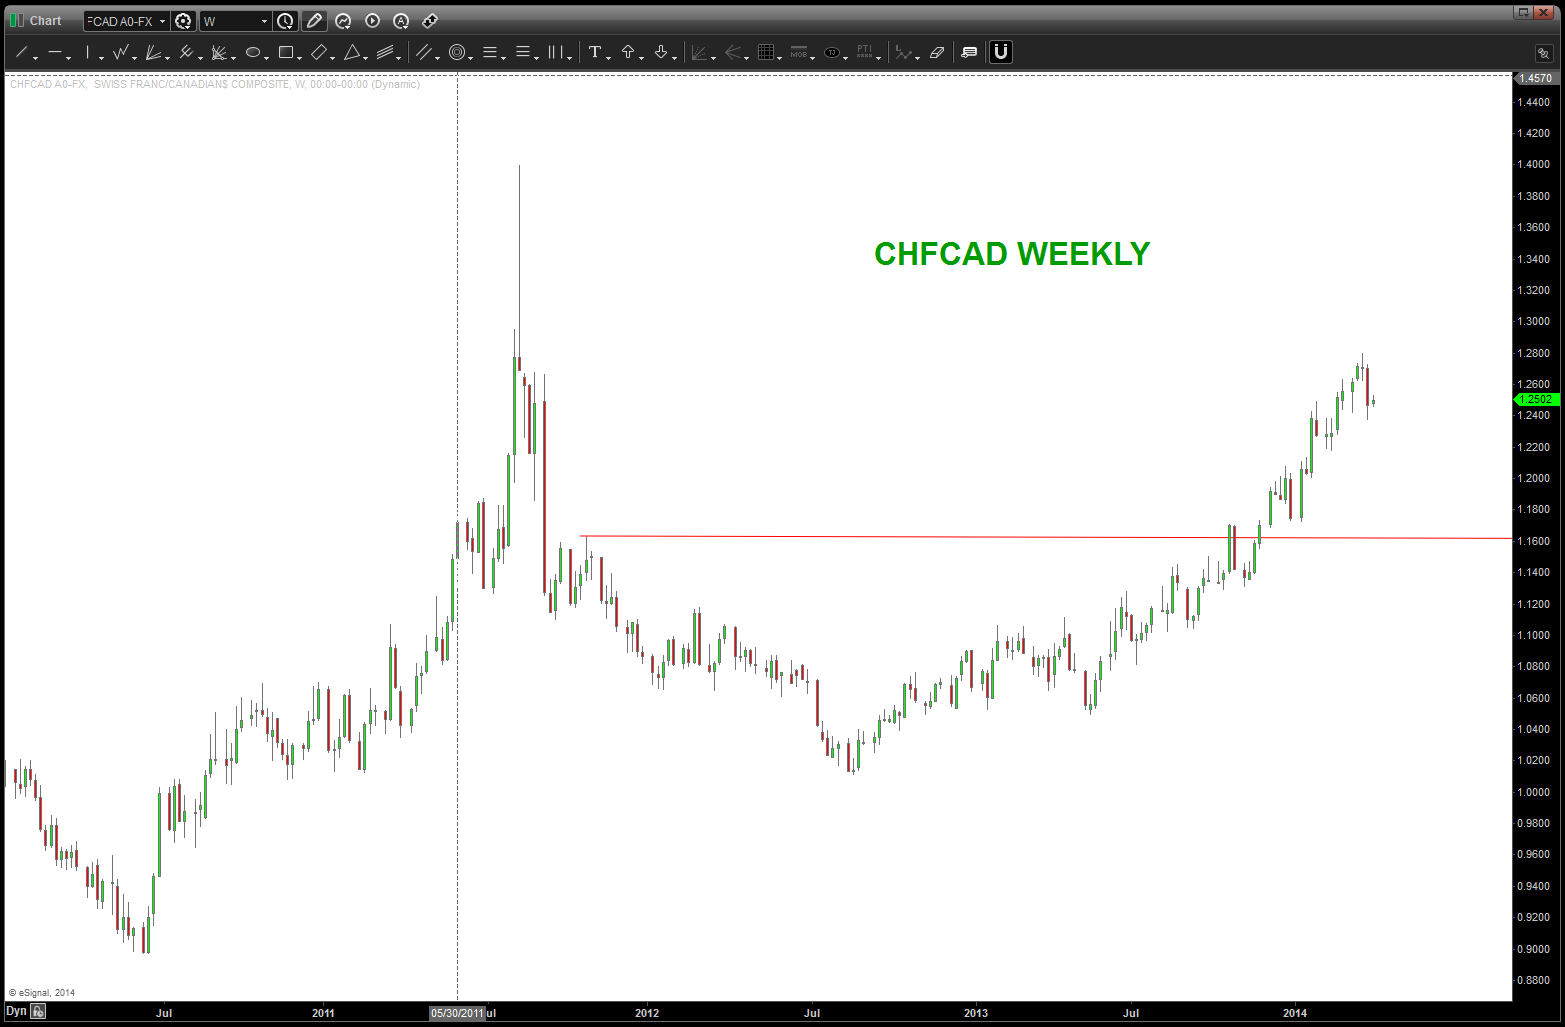
CHFCAD:
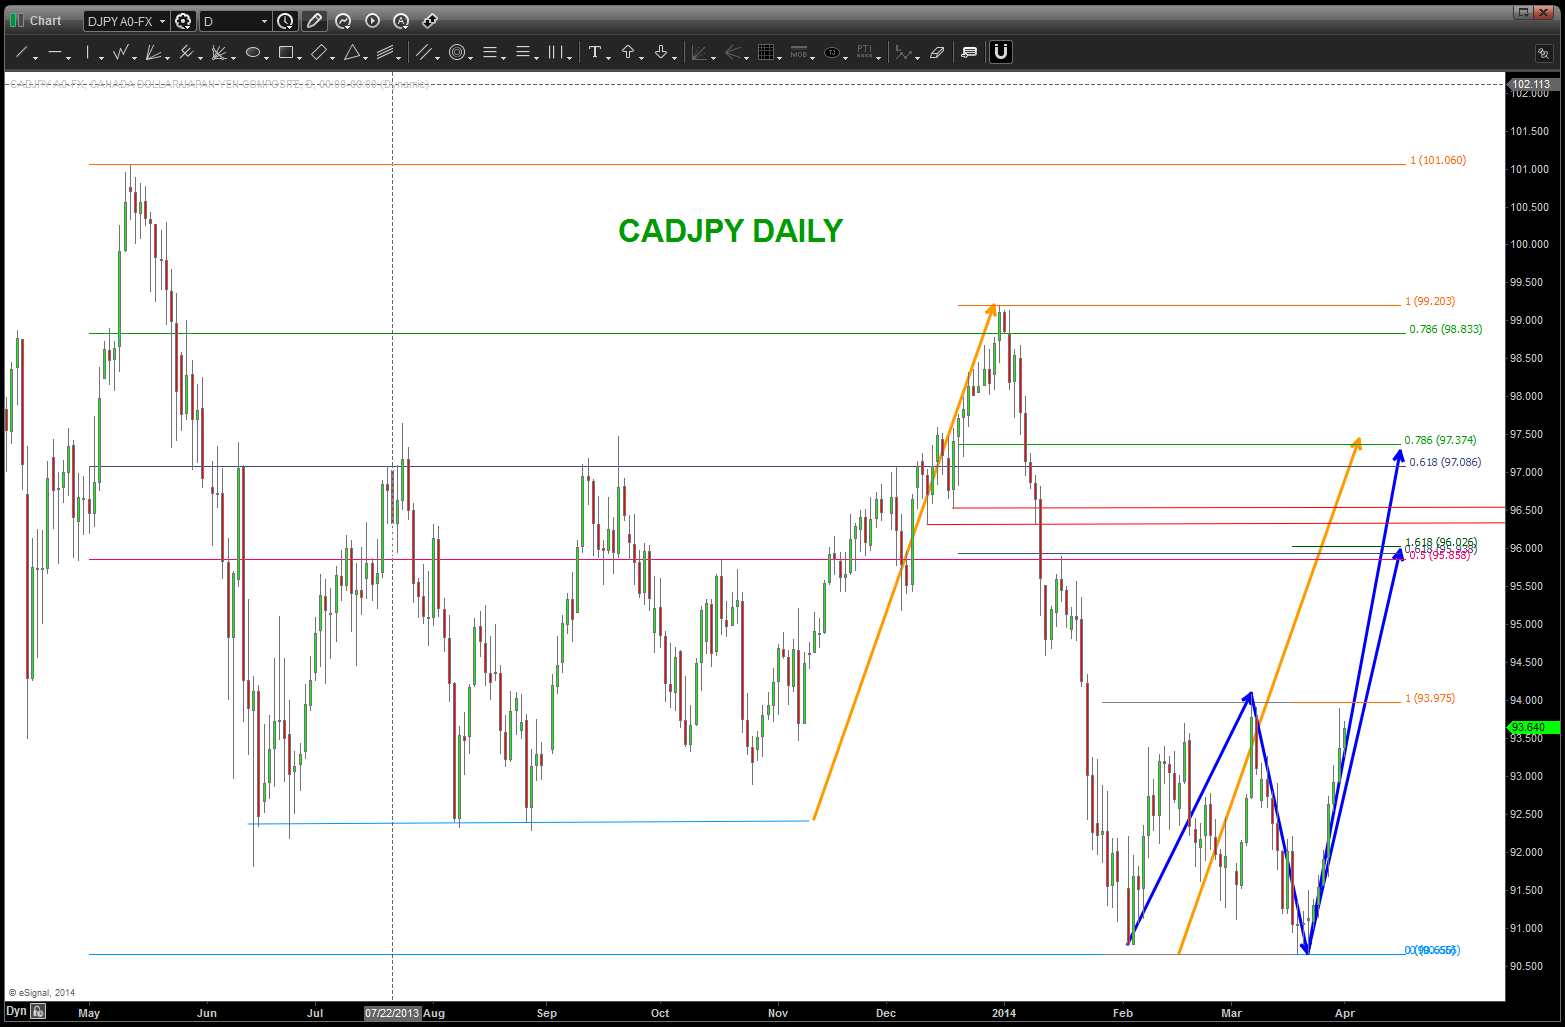
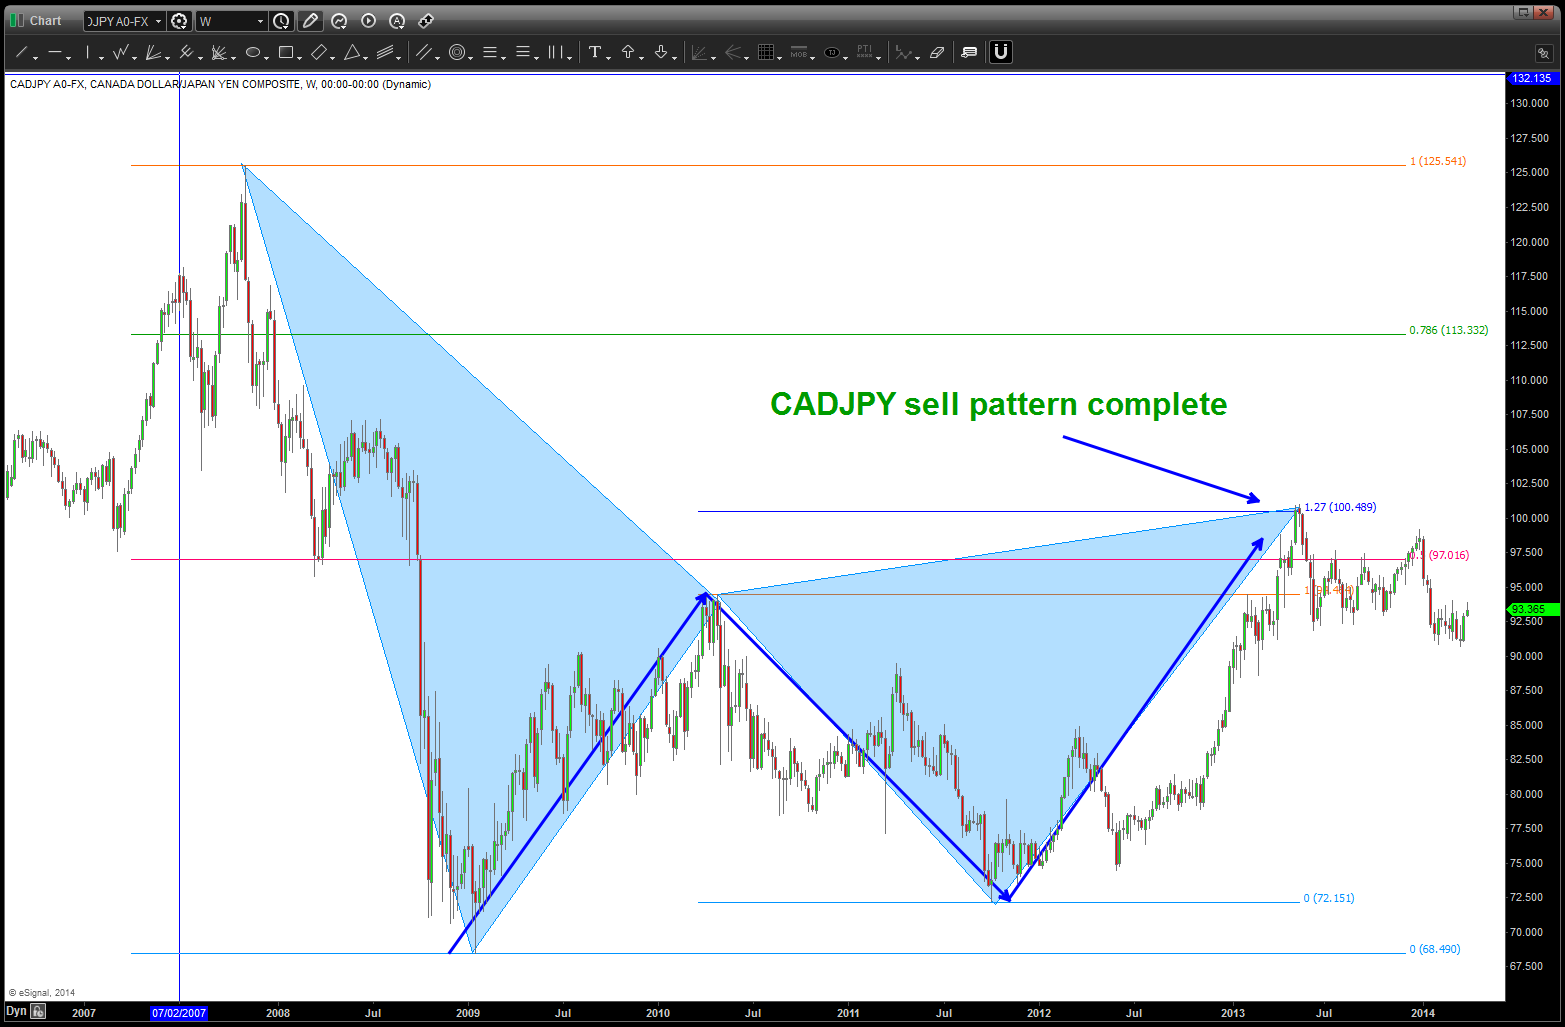
CADJPY
the Japanese Yen in charts …
Posted on April 1, 2014 4 Comments
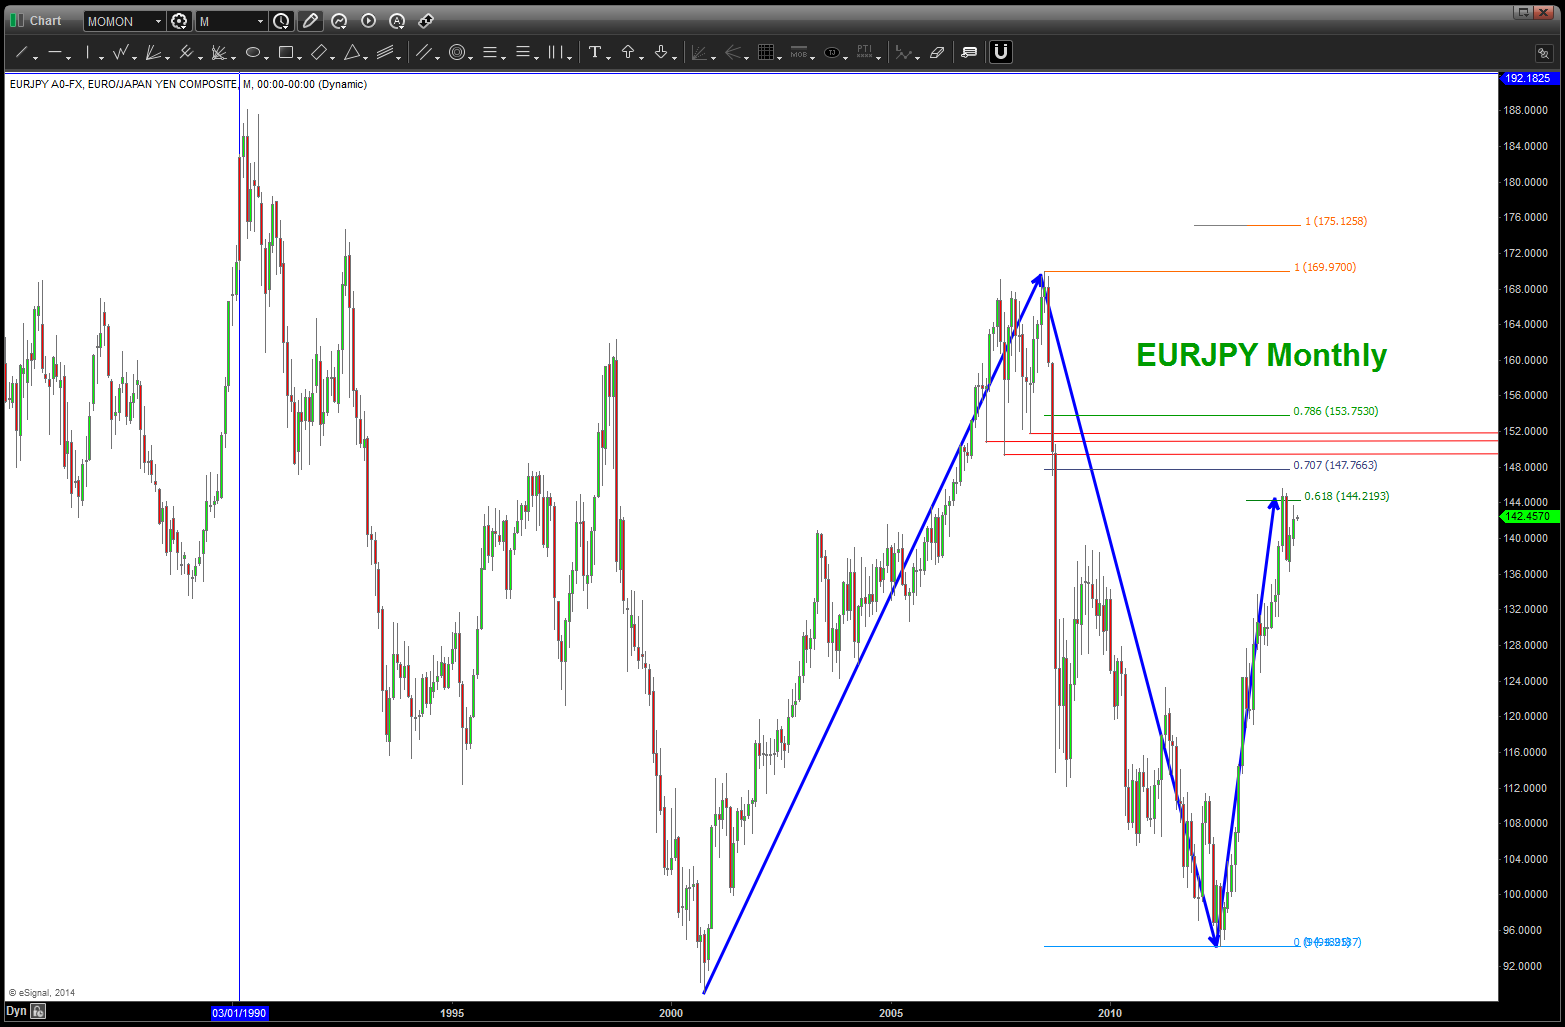
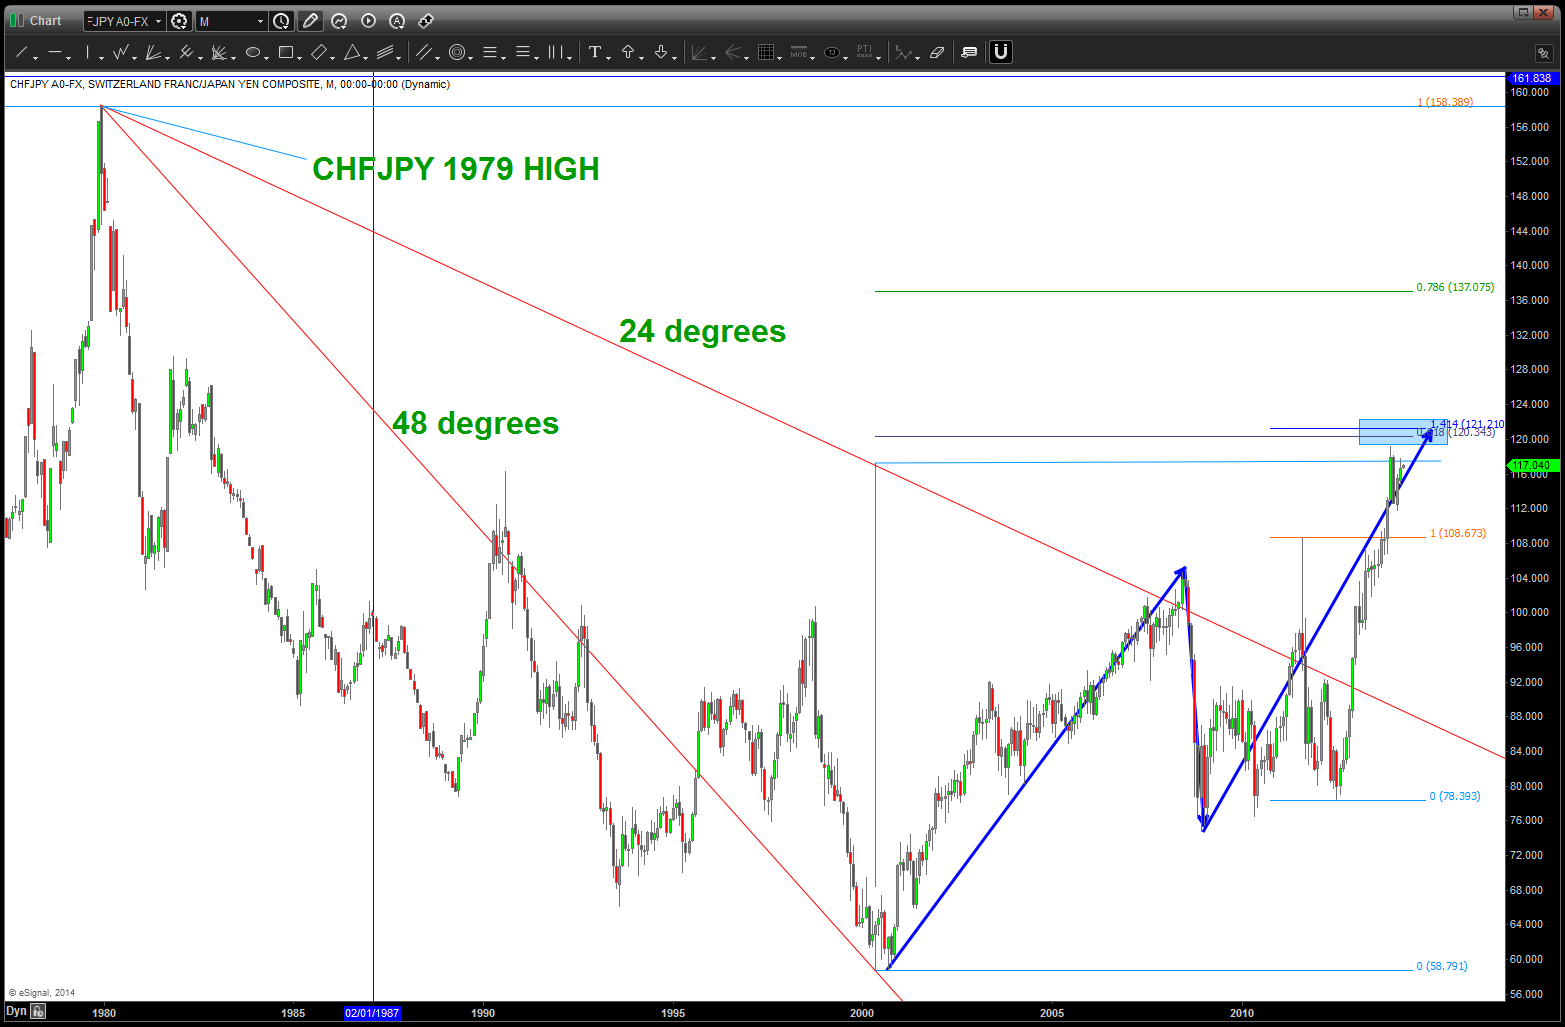
Cliff notes: can “see” why recent YEN weakness has paused and ran into resistance on the charts. that being said, some MAJOR patterns completing just a little farther away (note: CHFJPY) Also, note that YEN strength usually shows volatility spiking. I expect mid-April to be interesting across the entire circle of life.
Also, have found this a great resource to check accuracy of long term data: http://fxtop.com/en/historical-exchange-rates-graph-zoom.php?C1=CHF&C2=JPY&A=1&DD1=01&MM1=01&YYYY1=1953&DD2=31&MM2=03&YYYY2=2014&LARGE=1&LANG=en&CJ=0

NFLX follow up
Posted on March 31, 2014 Leave a Comment
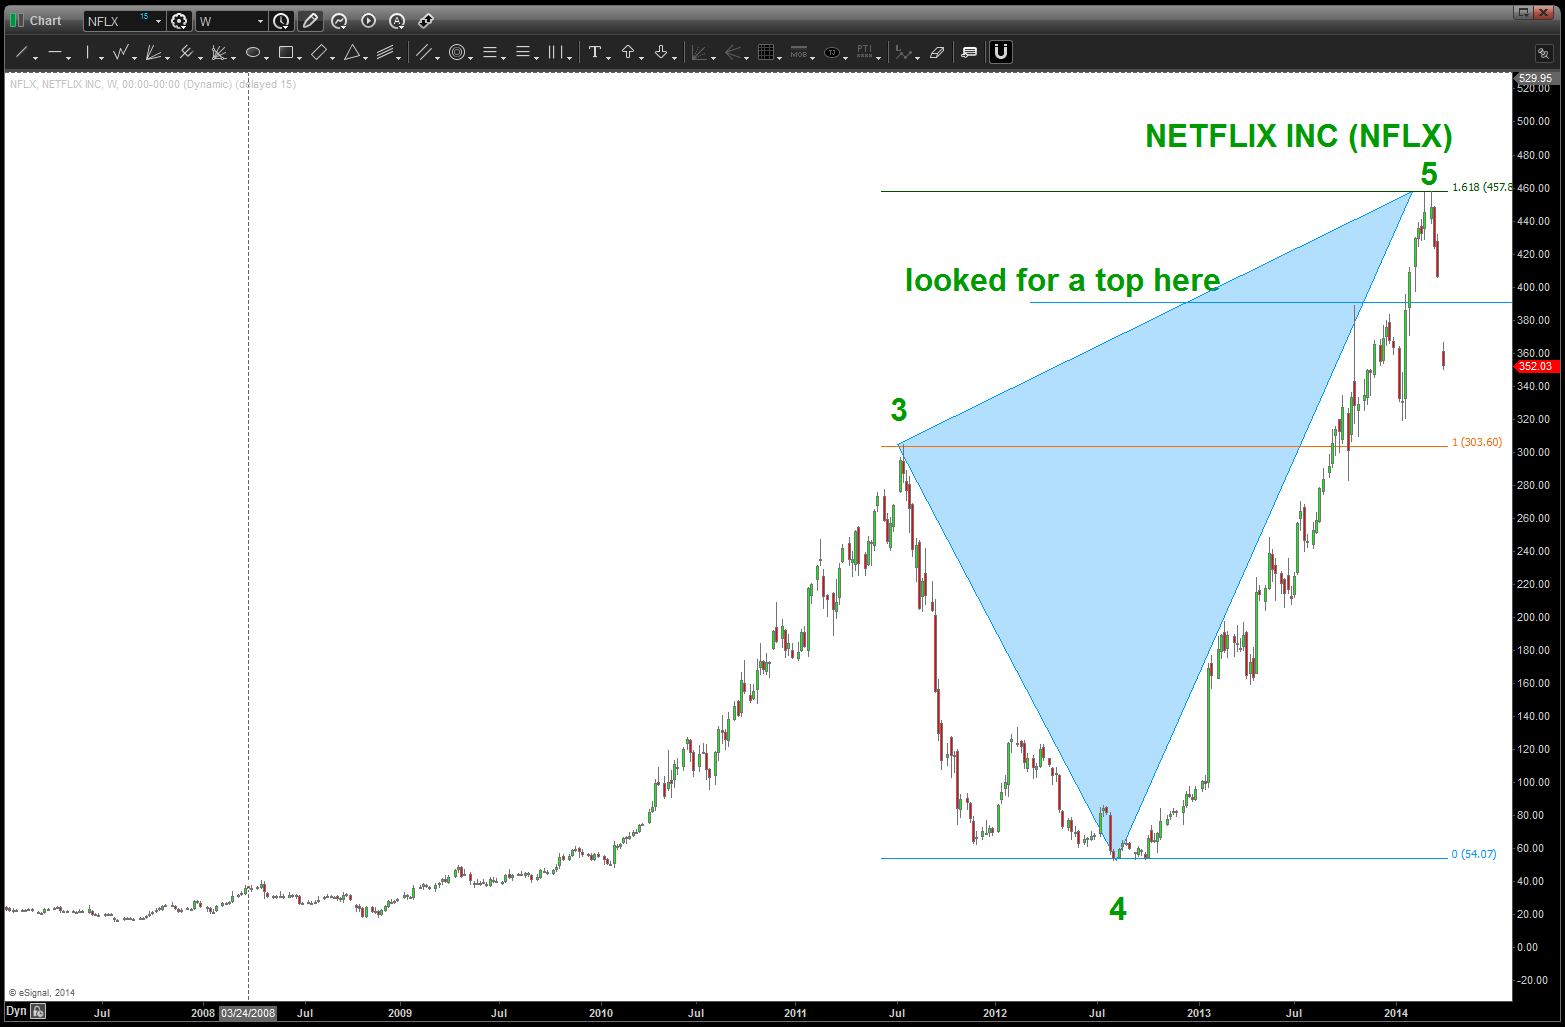
CLIFF NOTES: went a little higher than the original target at/around 400. However, we did make it known a 5th wave advance was maturing and finishing. Believe it might be cooked …
BIDU follow up
Posted on March 31, 2014 Leave a Comment
CLIFF NOTES: very strong probability that a 5 wave advance is complete on BIDU
Here’s the last look at BIDU working on a 188 target for wave 5: https://bartscharts.com/2013/10/21/the-ray-charles-count-on-bidu/
Updated chart:

back to the basics …
Posted on March 28, 2014 Leave a Comment
a very good friend of mine has sought my assistance in becoming a pattern recognition guru. I do this very sparingly because before I ever accept this challenge and privilege I make sure they have read http://www.constructingtheuniverse.com/bookinfo.htm. Why? Because the PATTERNS fly against the convention of any modern portfolio theory, CNBC talking head pundit and, quite frankly, many noted technicians. Flush the brain, find a pattern and take the trade ….
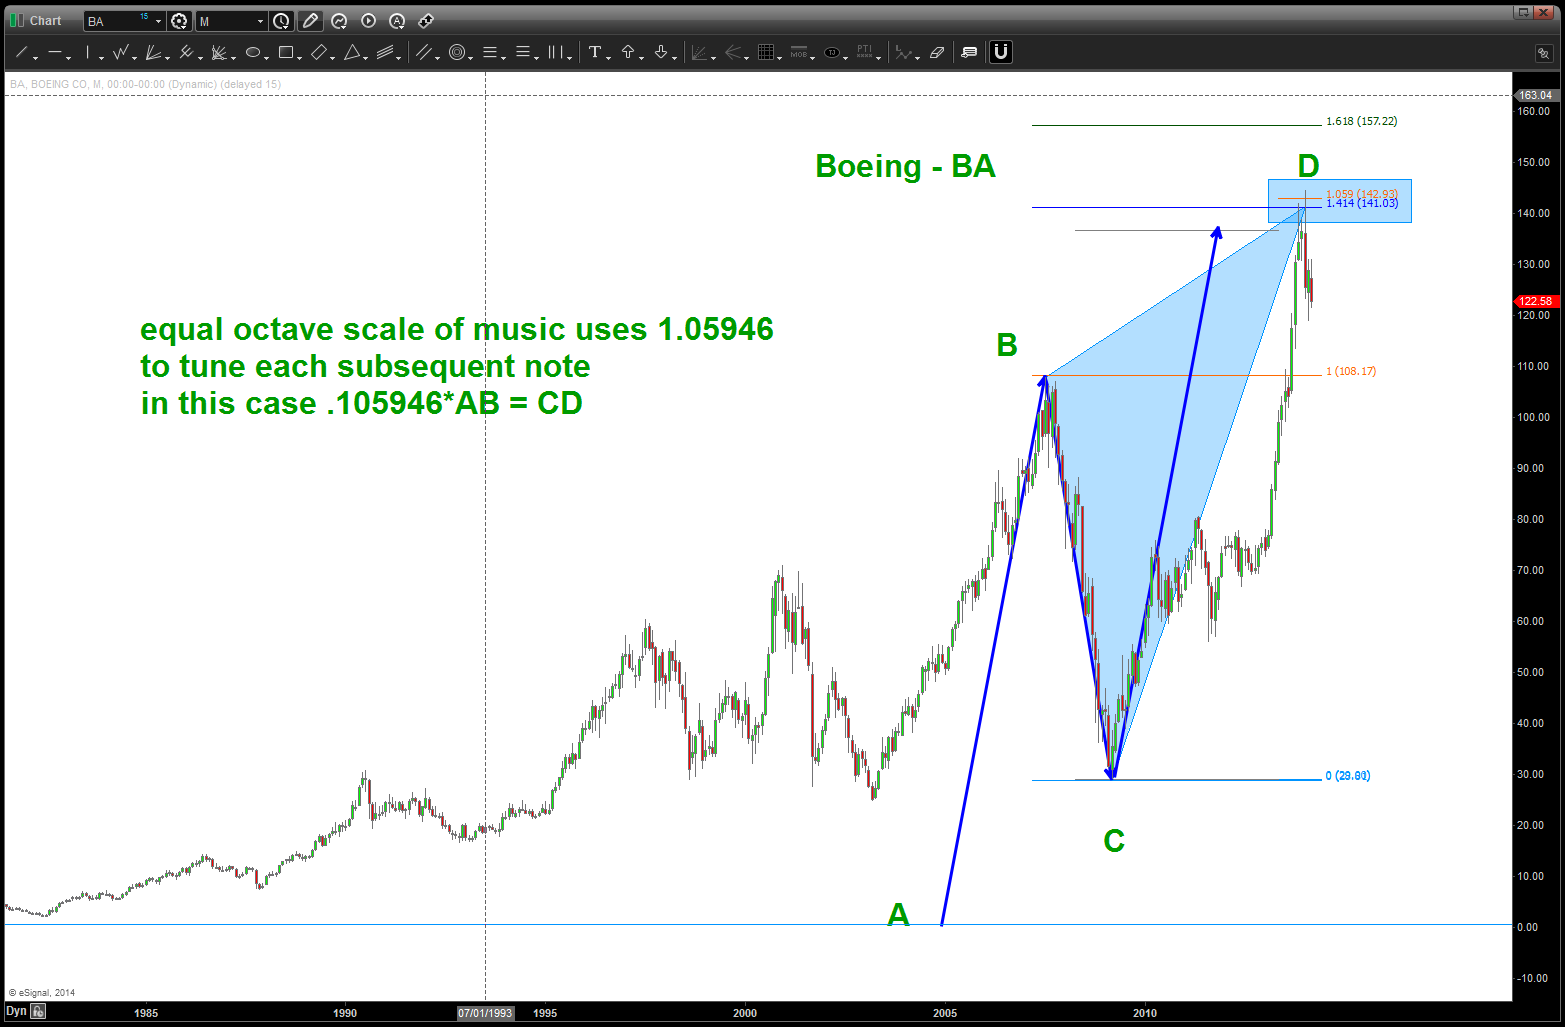
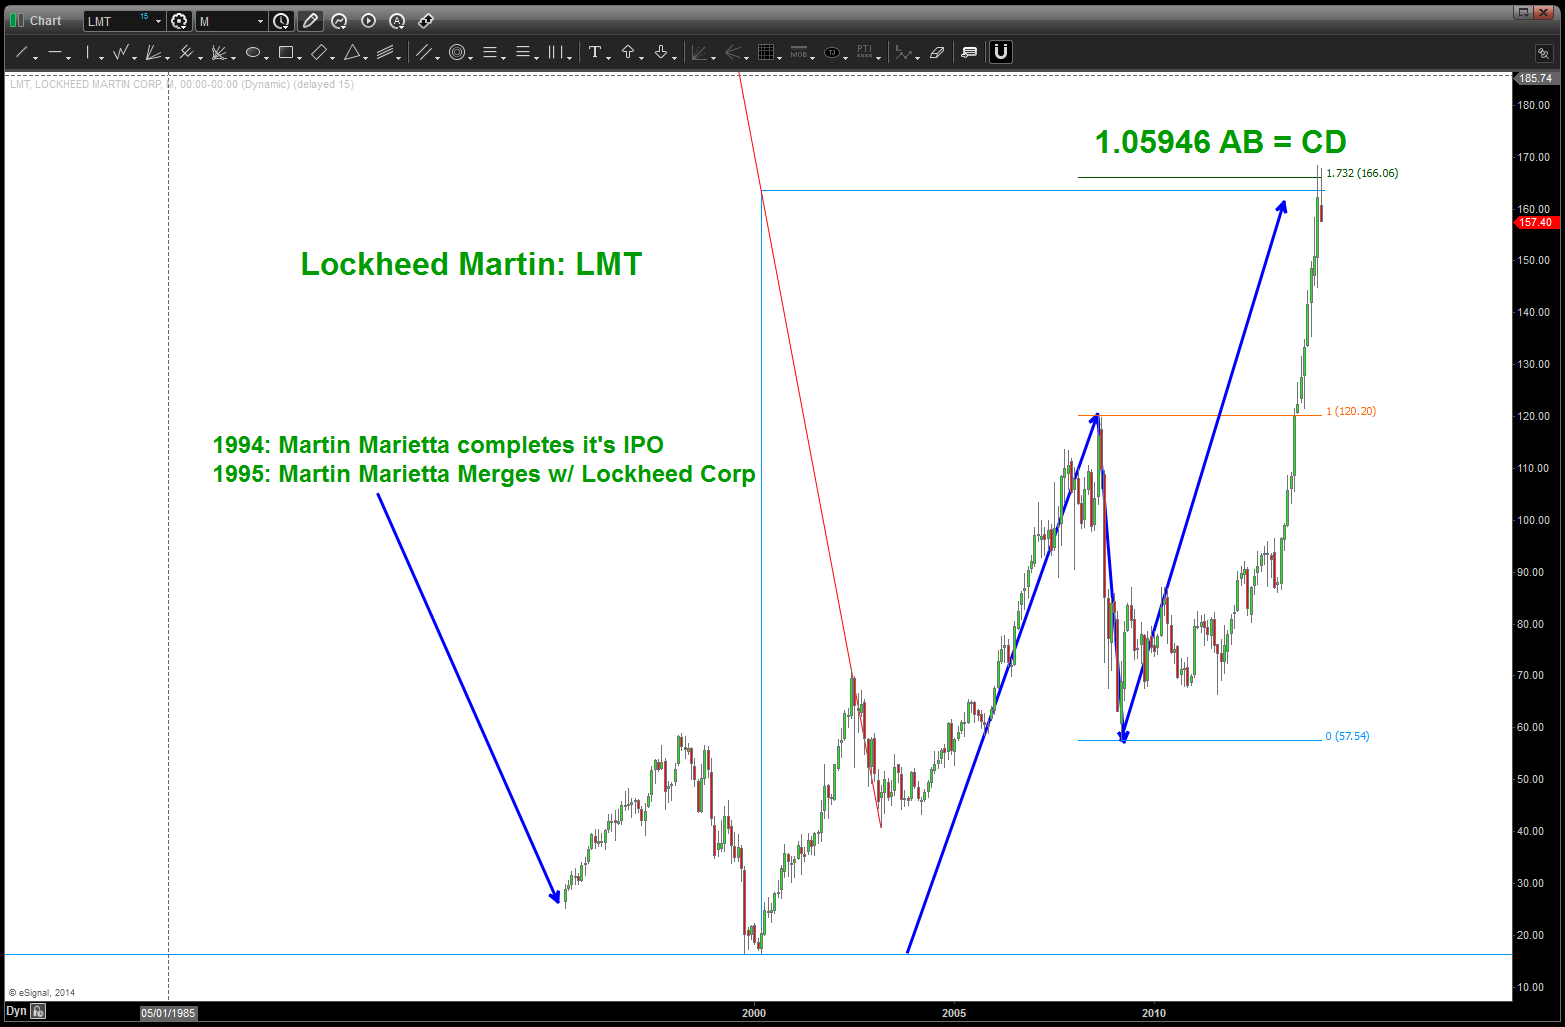
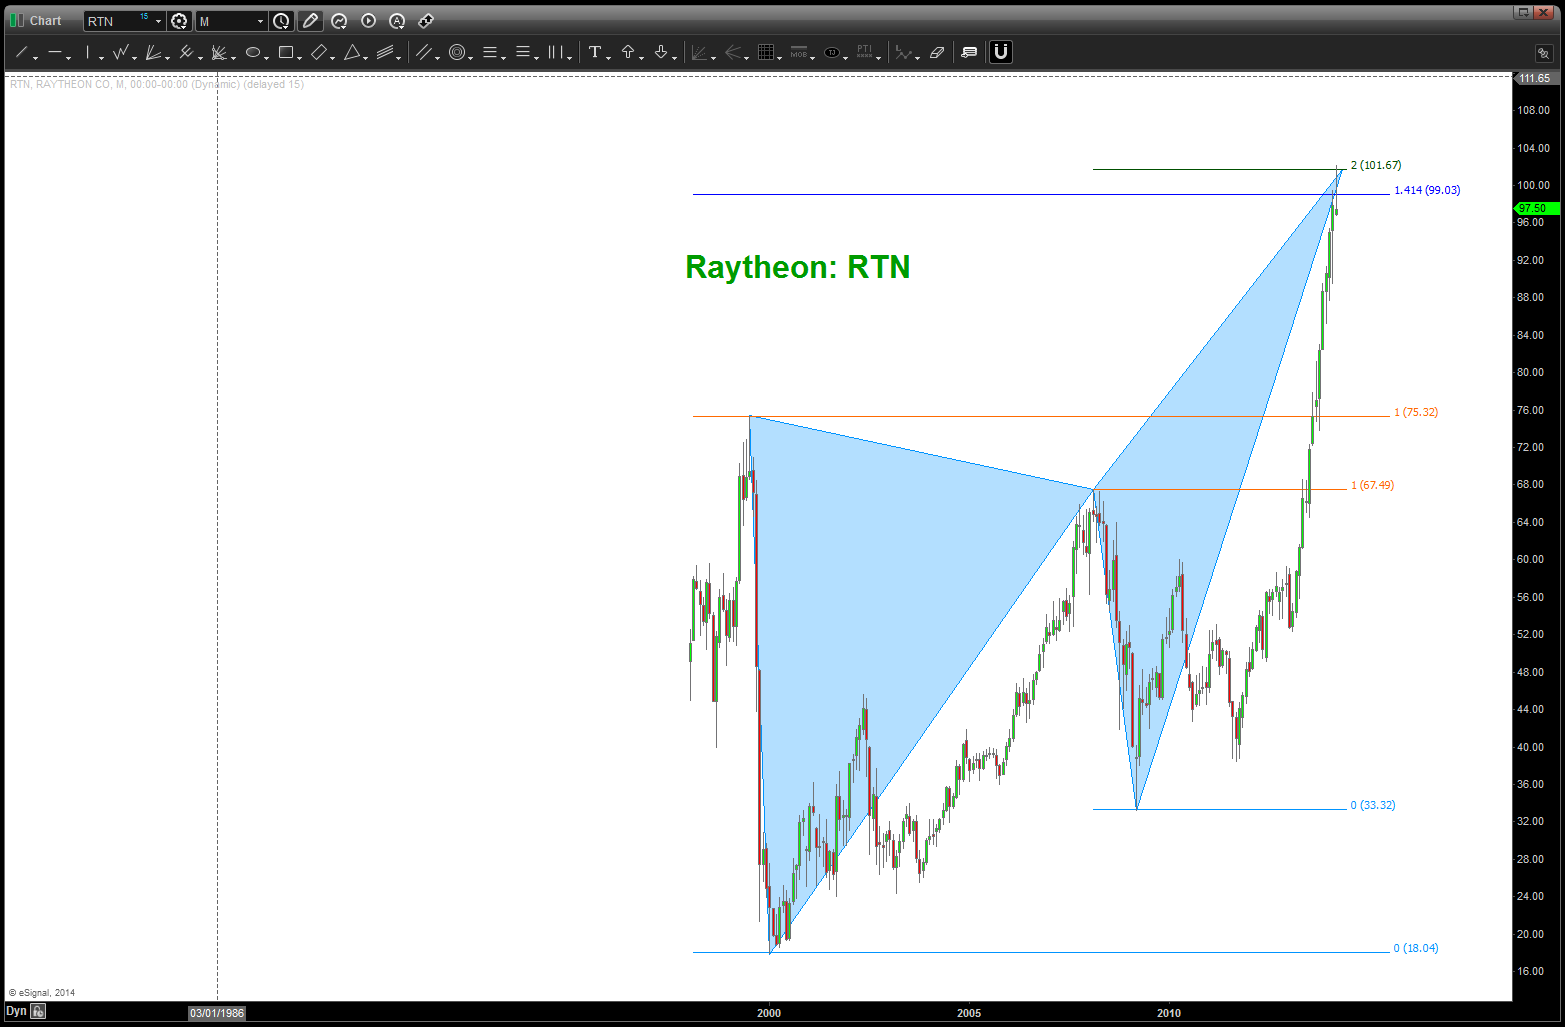
so, in a nutshell it comes down to 3 things : Project, Extend, Retrace.
PROJECT – the basic (no less important) is ab=cd. (shown below)
EXTEND: from the b point EXTEND based on the bc leg UP (or down) into the ab=cd region by 127%, 141.2%, or 161.8%.
RETRACE: Xa retrace by .618 or .707 or .786.
Where they come together … a PATTERN is formed and you take the trade.
That is ALL you will EVER need to know …
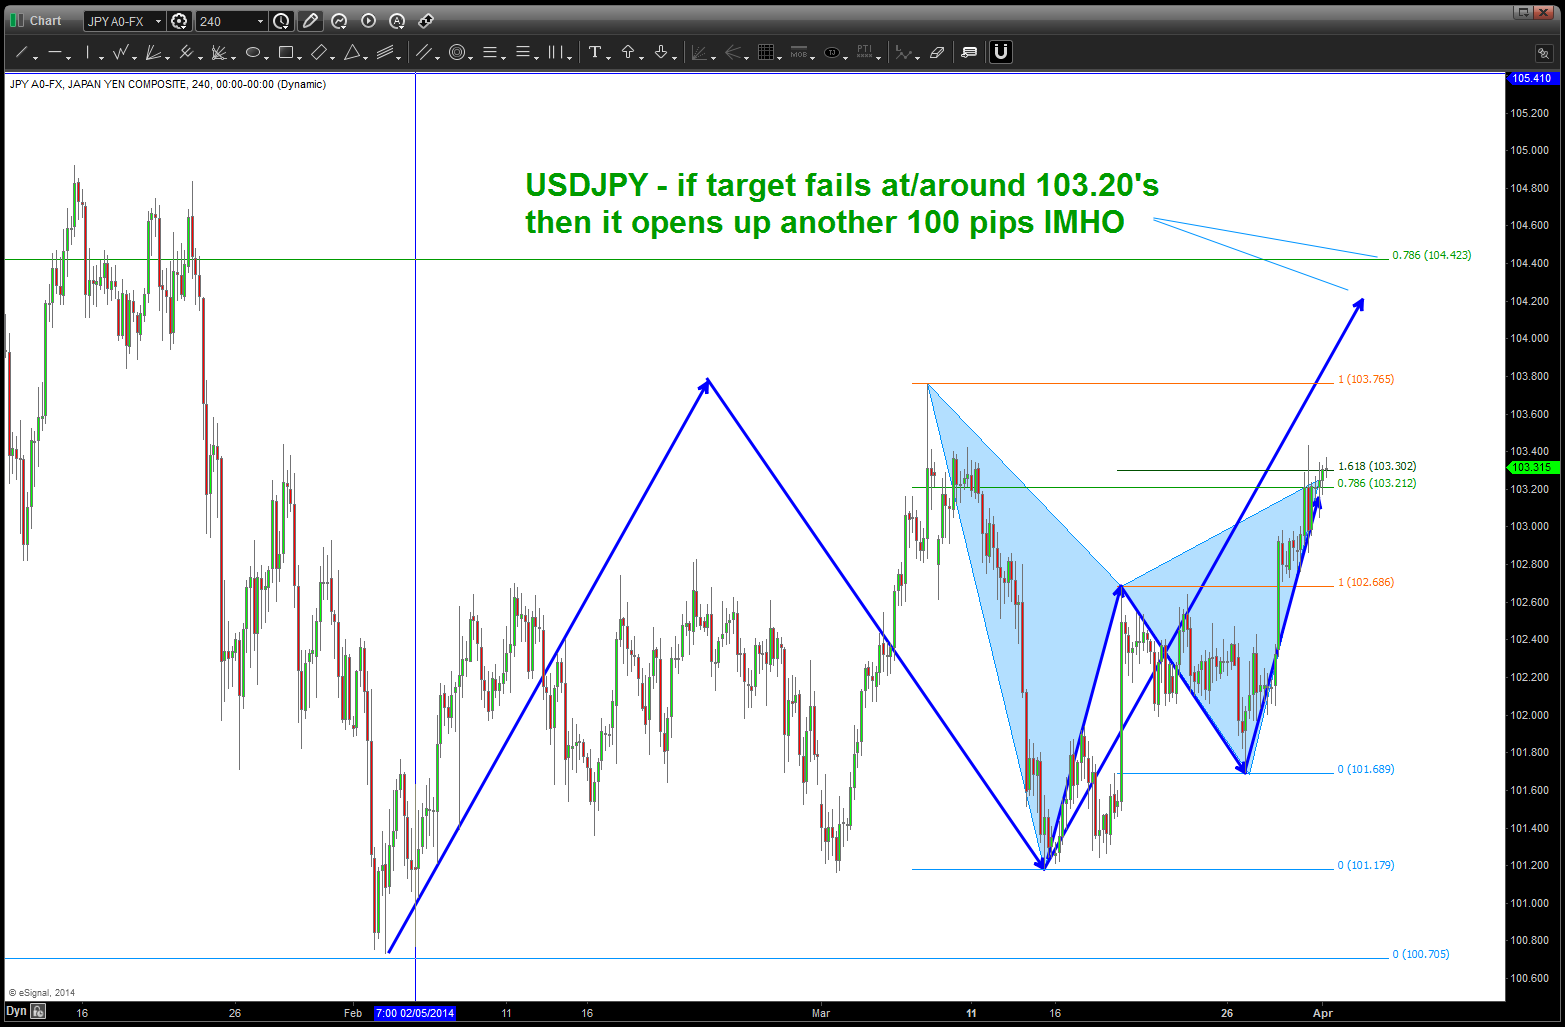
Below is the JPY 120 minute SELL pattern at/around 103.09-103.30
Make it a great weekend.

all time low on NASDAQ log trend line
Posted on March 27, 2014 4 Comments
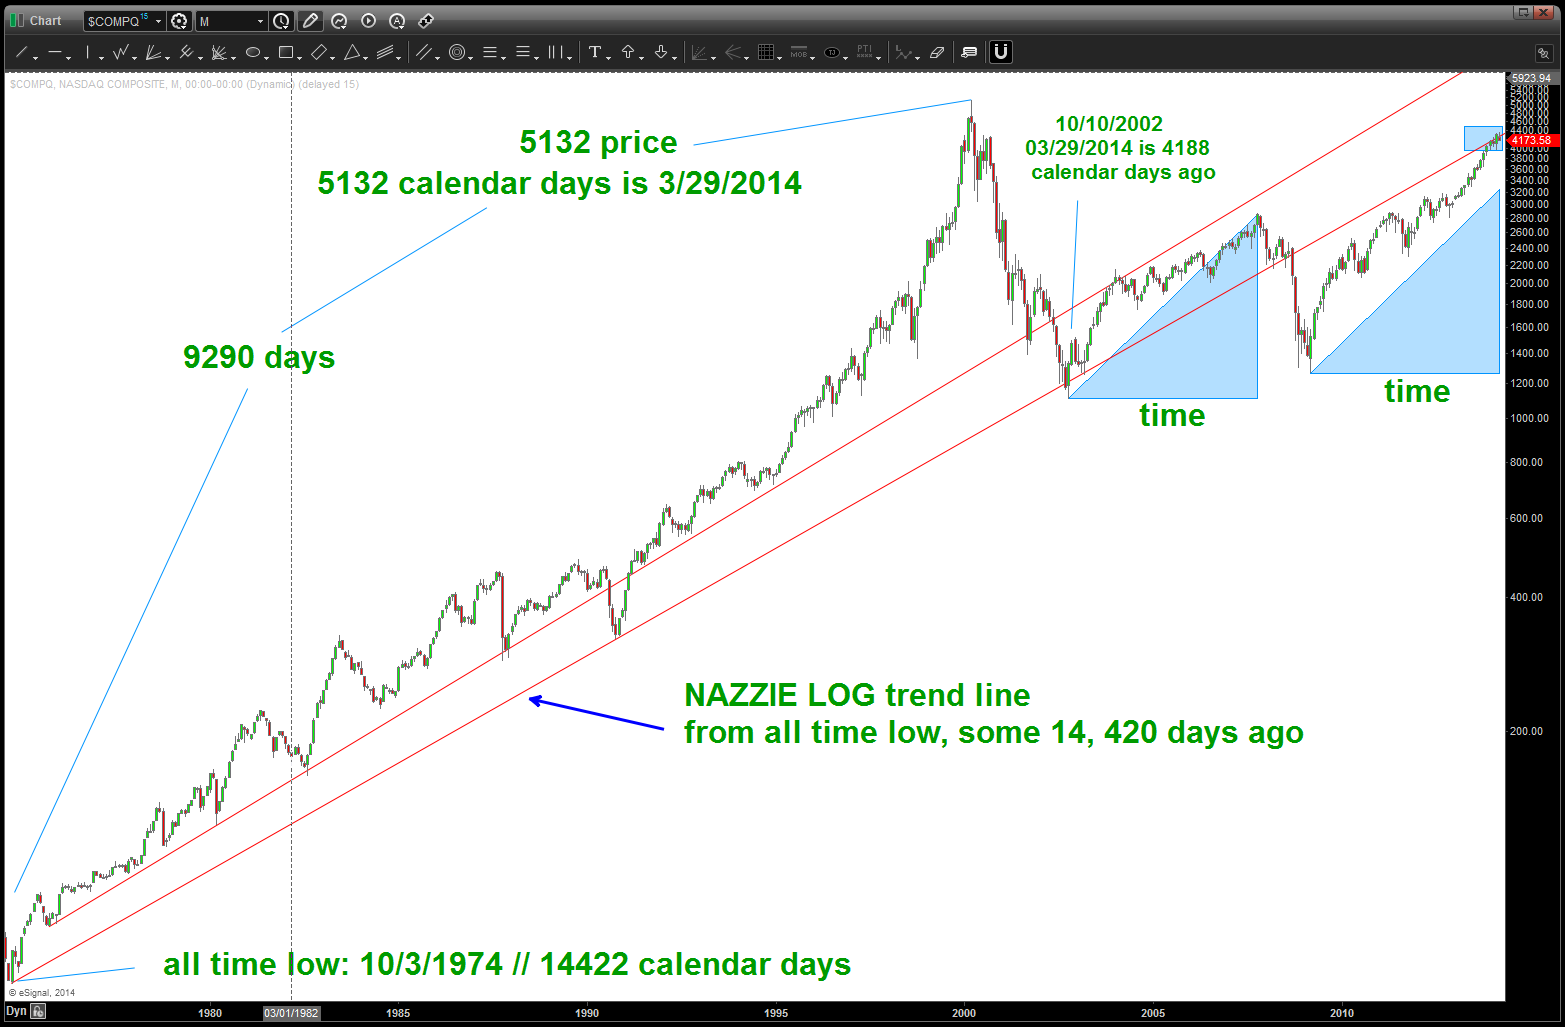
CLIFF NOTES: this is major resistance on the NASDAQ
folks, it’s all about the swing low … while the NASDAQ is continuing to break down like our targets expected, it has not broken a major swing low, yet. This weekend will be very key as we “square out” in days the all time high of 5132. Additionally, note we are only 15 points from 4188 which is the calendar day count from the 10/10/2002 low. So … we have 1) targets being hit in PRICE and 2) equal TIME rally up (noted by blue triangles) and 3) butting against major trend line resistance and 4) a potential square out of price and time from major highs and lows.
NASDAQ LOG trend line from all time low
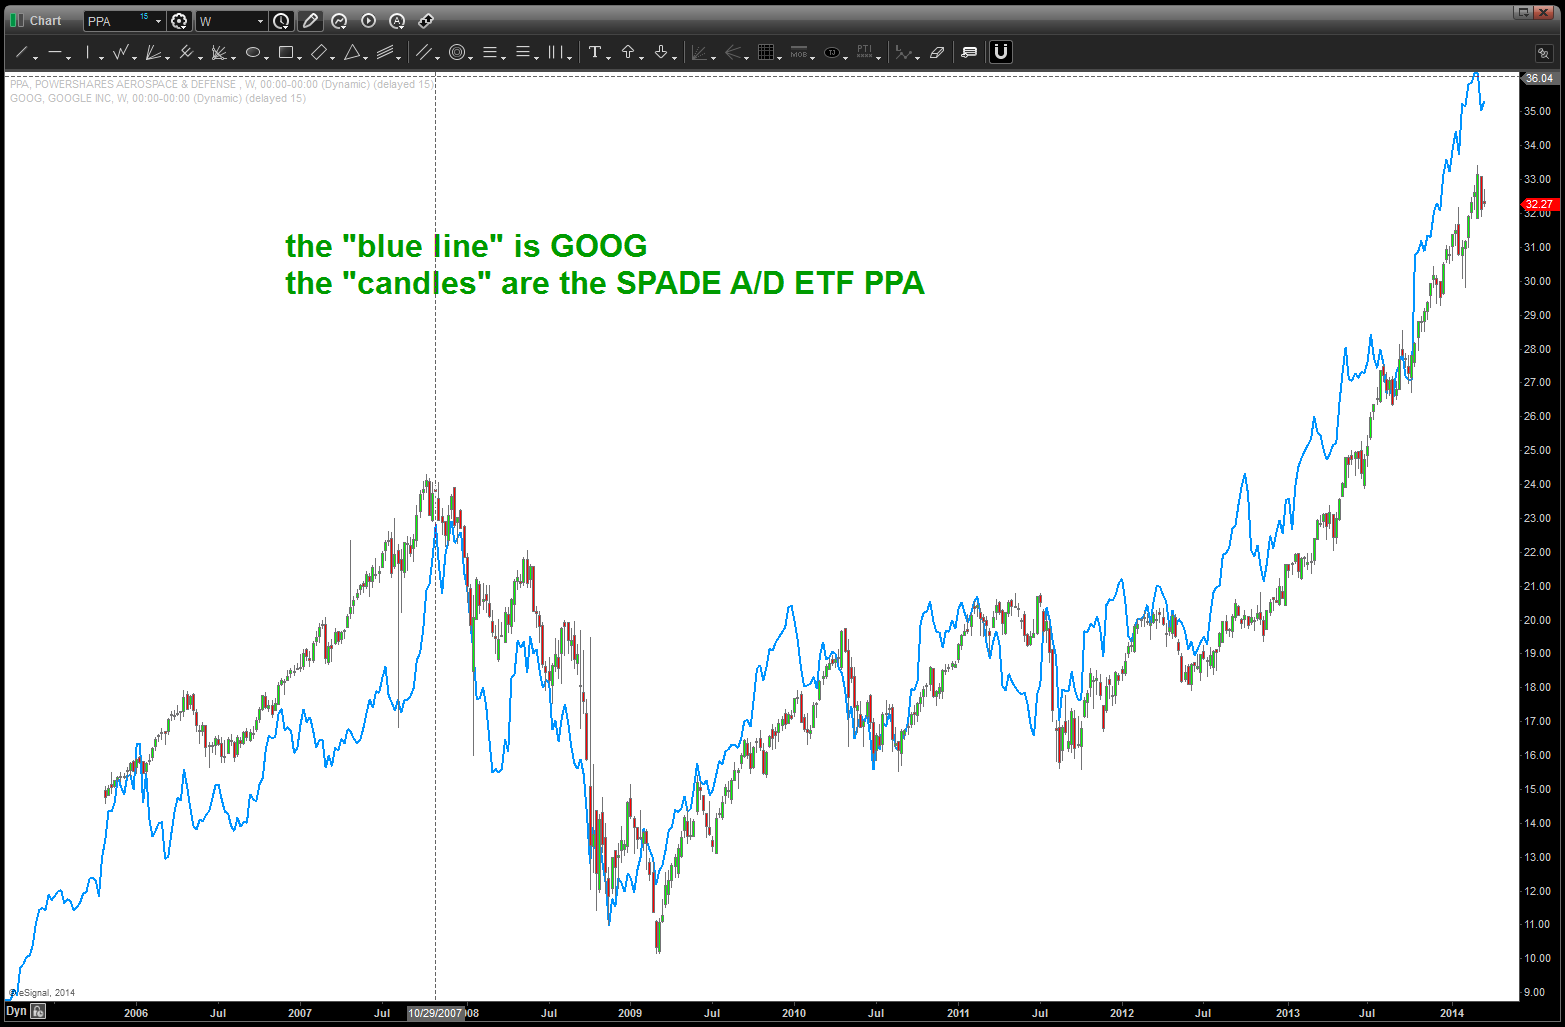
Top 4 A/D contractors, the PPA and GOOG
Posted on March 23, 2014 Leave a Comment
Cliff Notes: they are showing sell patterns and we have visited the correlation of the Defense Index ($DFI // PPA) and GOOG before ….

JPM updated w/ a SELL pattern complete
Posted on March 23, 2014 3 Comments
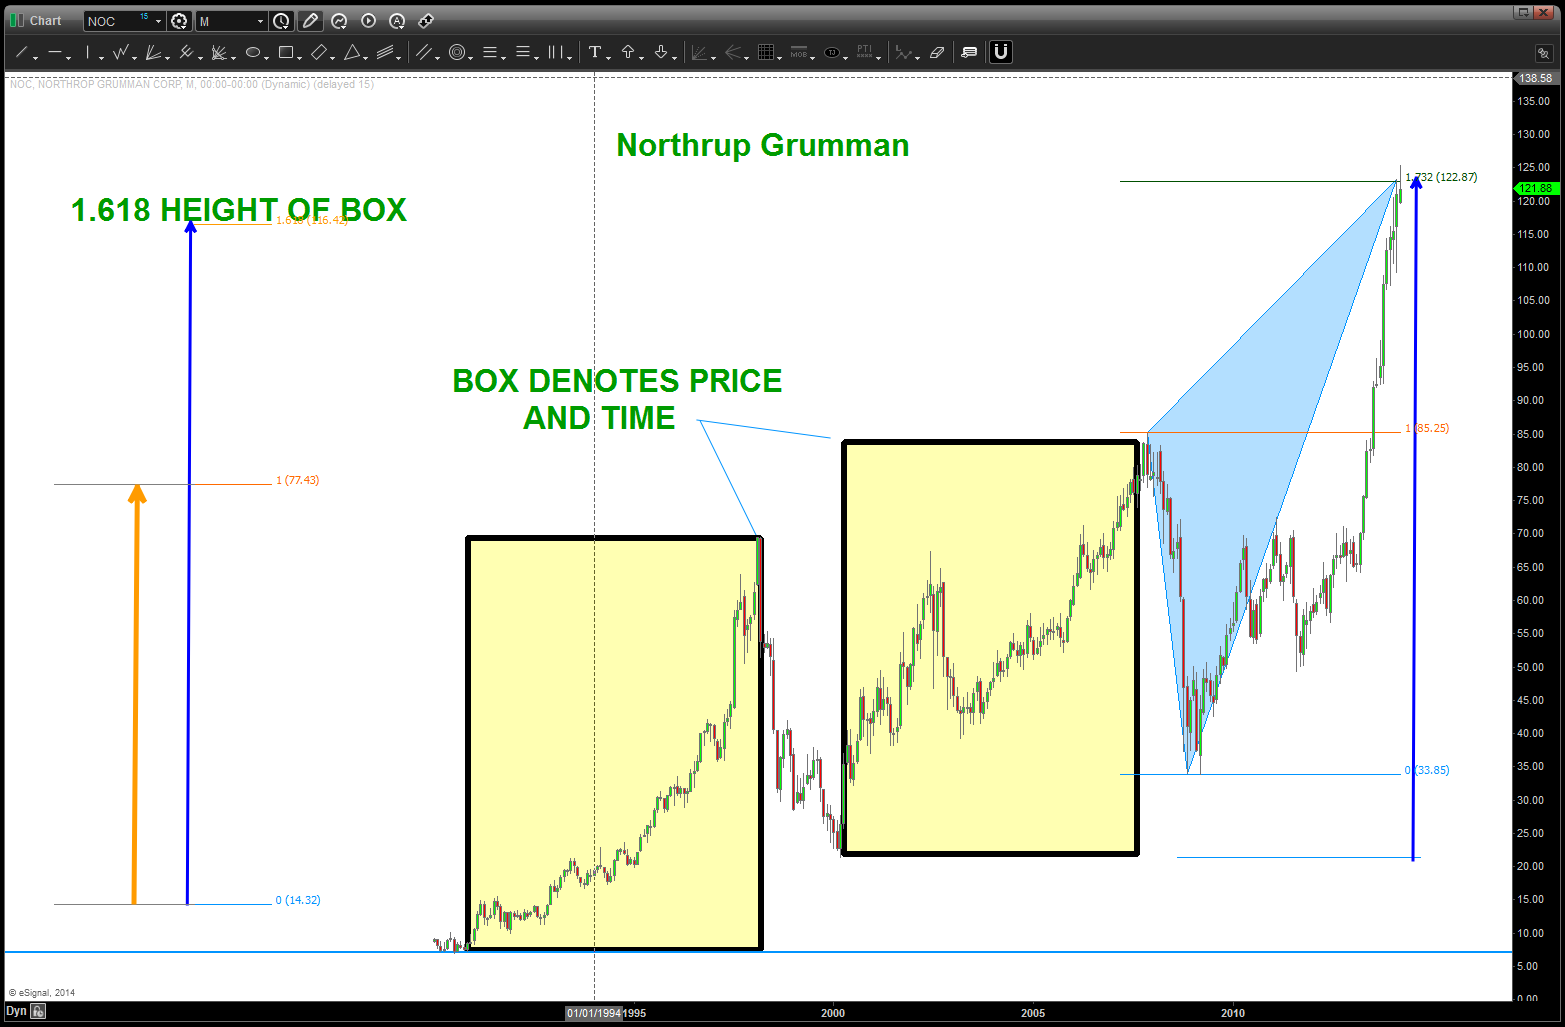
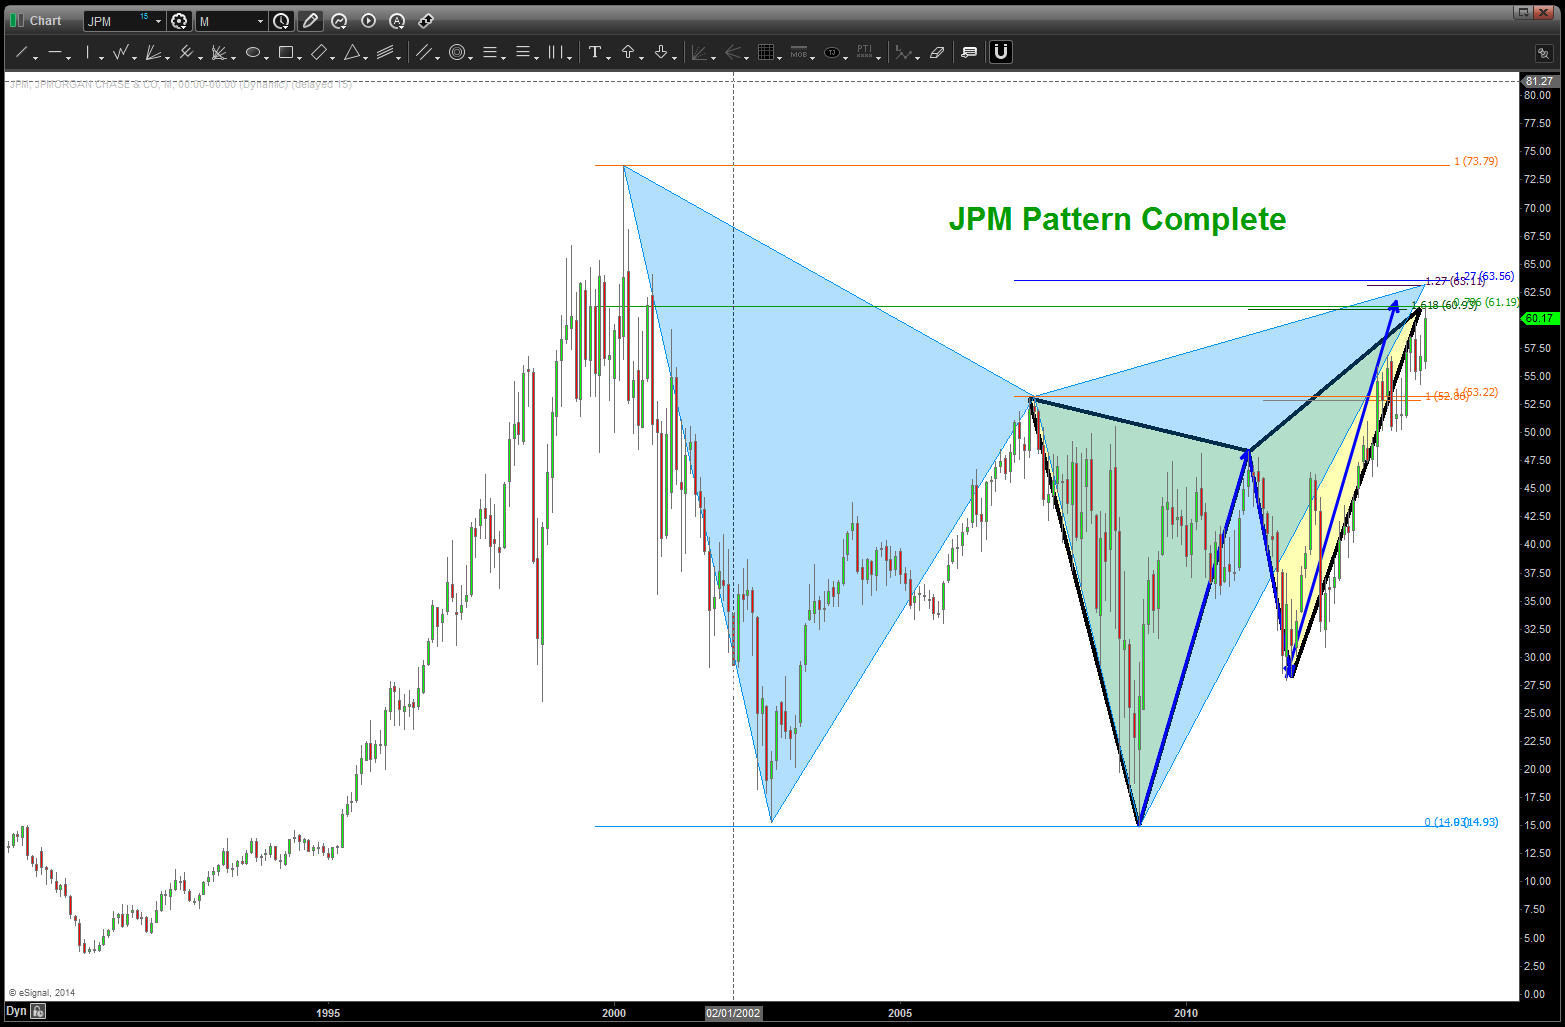
in November 2013 we targeted this area as a SELL pattern:
much like the movie Inception w/ the dream w/in a dream w/in a dream concept we also like PATTERNS to behave in the same manner. a pattern w/in a pattern w/in a pattern. all this does is increase the probability of a pattern working. does not guarantee it will work but does tip probability in our favor.
w/ JPM we have the following:
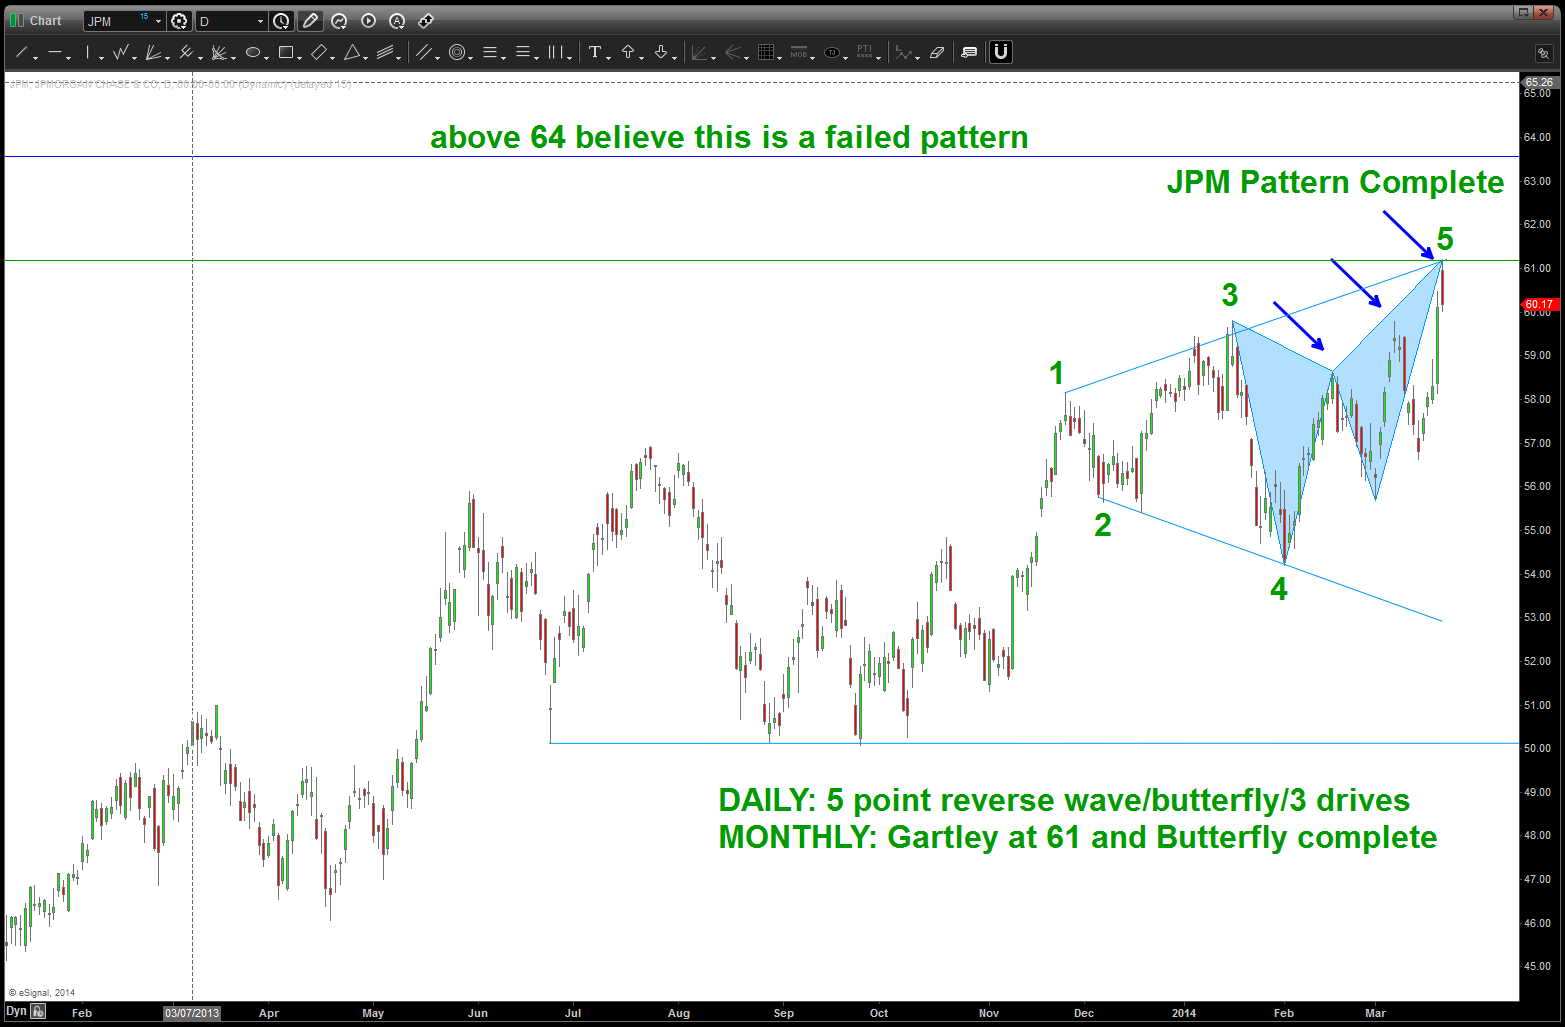
- Monthly Gartley Pattern w/ a Buttefly pattern inside of it.
- Daily 5 point reverse wave w/ a butterfly inside of it and inside of that butterfly is a 3 drives.
Folks, only probability but this pattern is complete. If we get a daily open/close above 64 I would assume this pattern had failed.
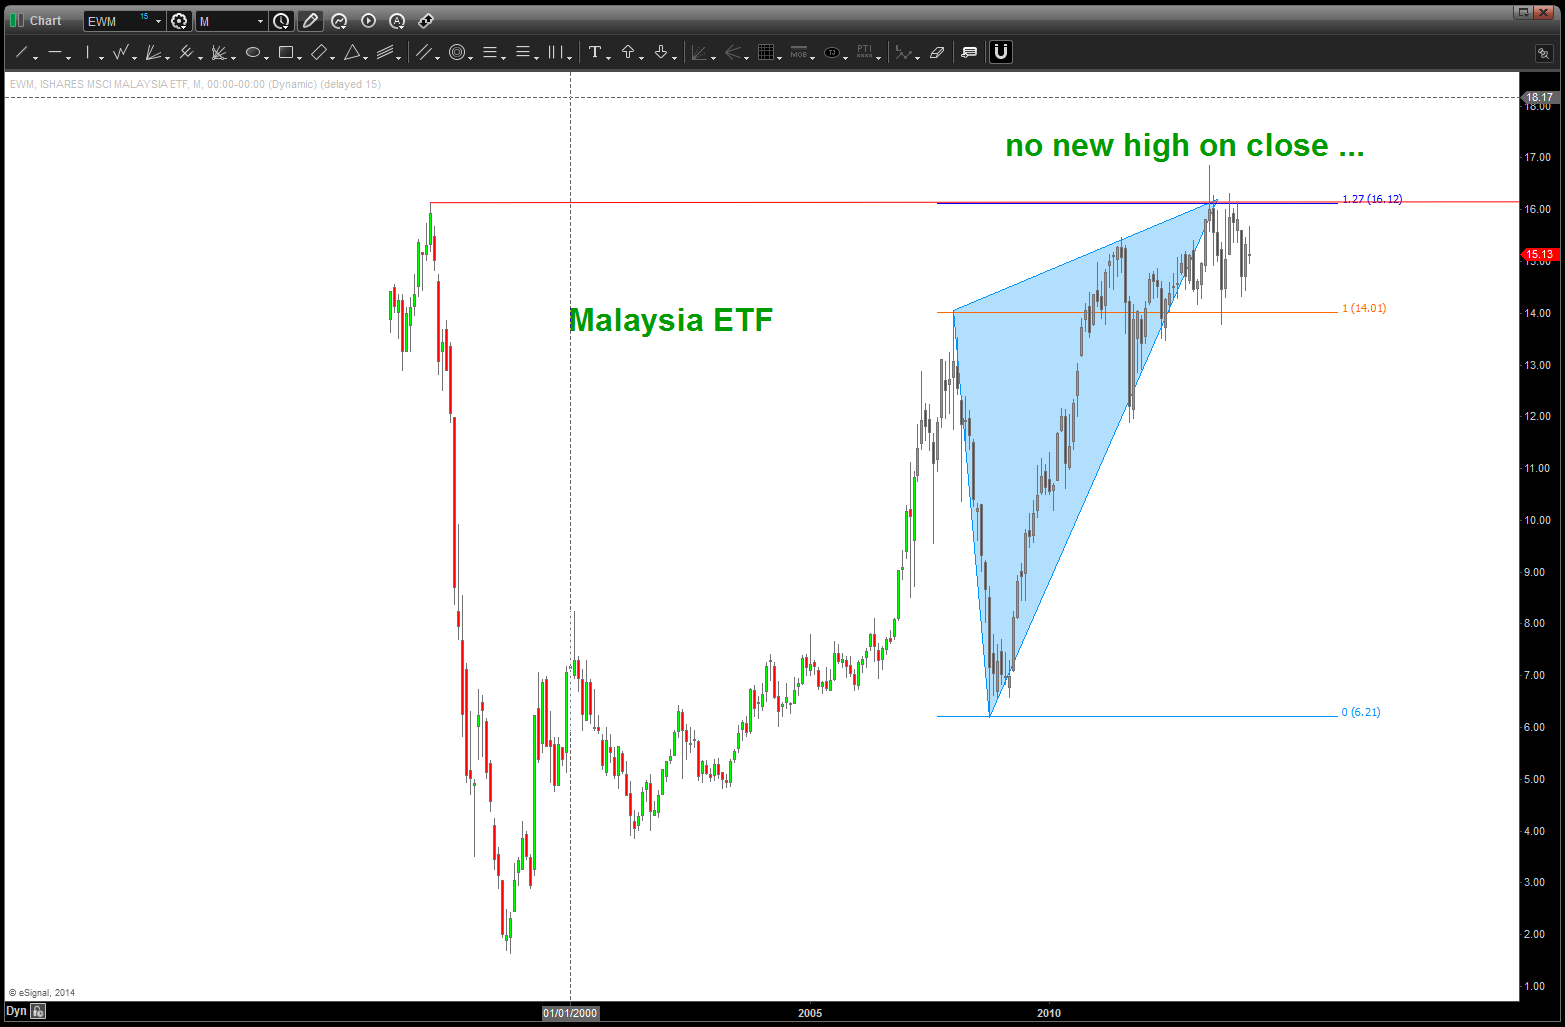
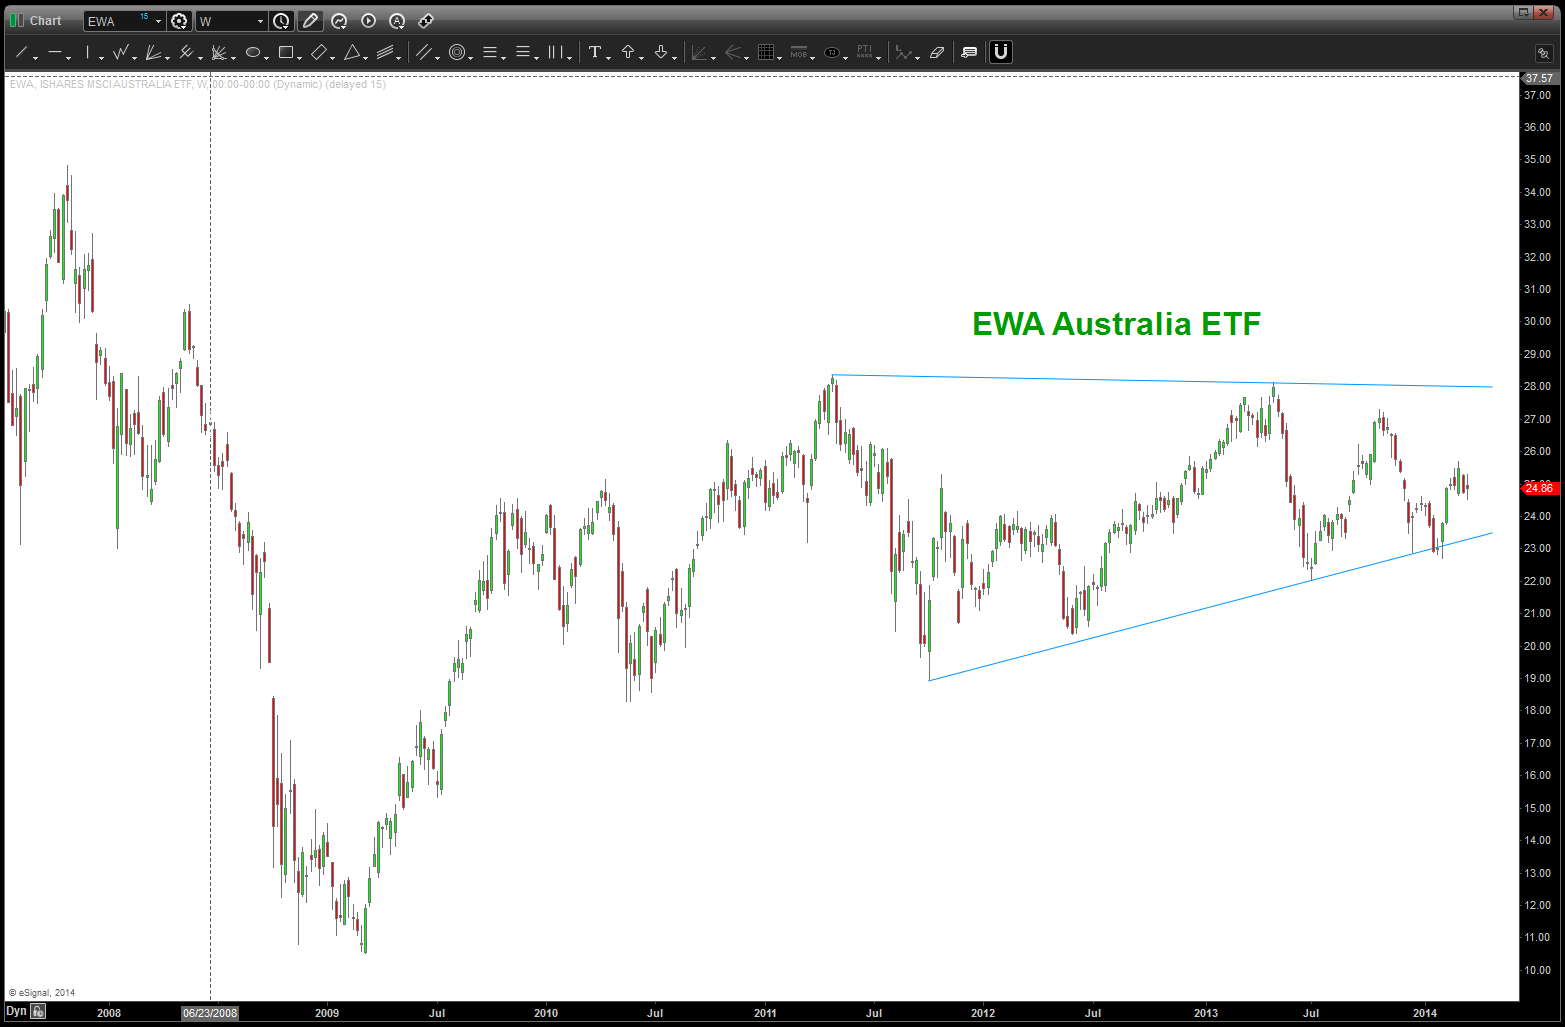
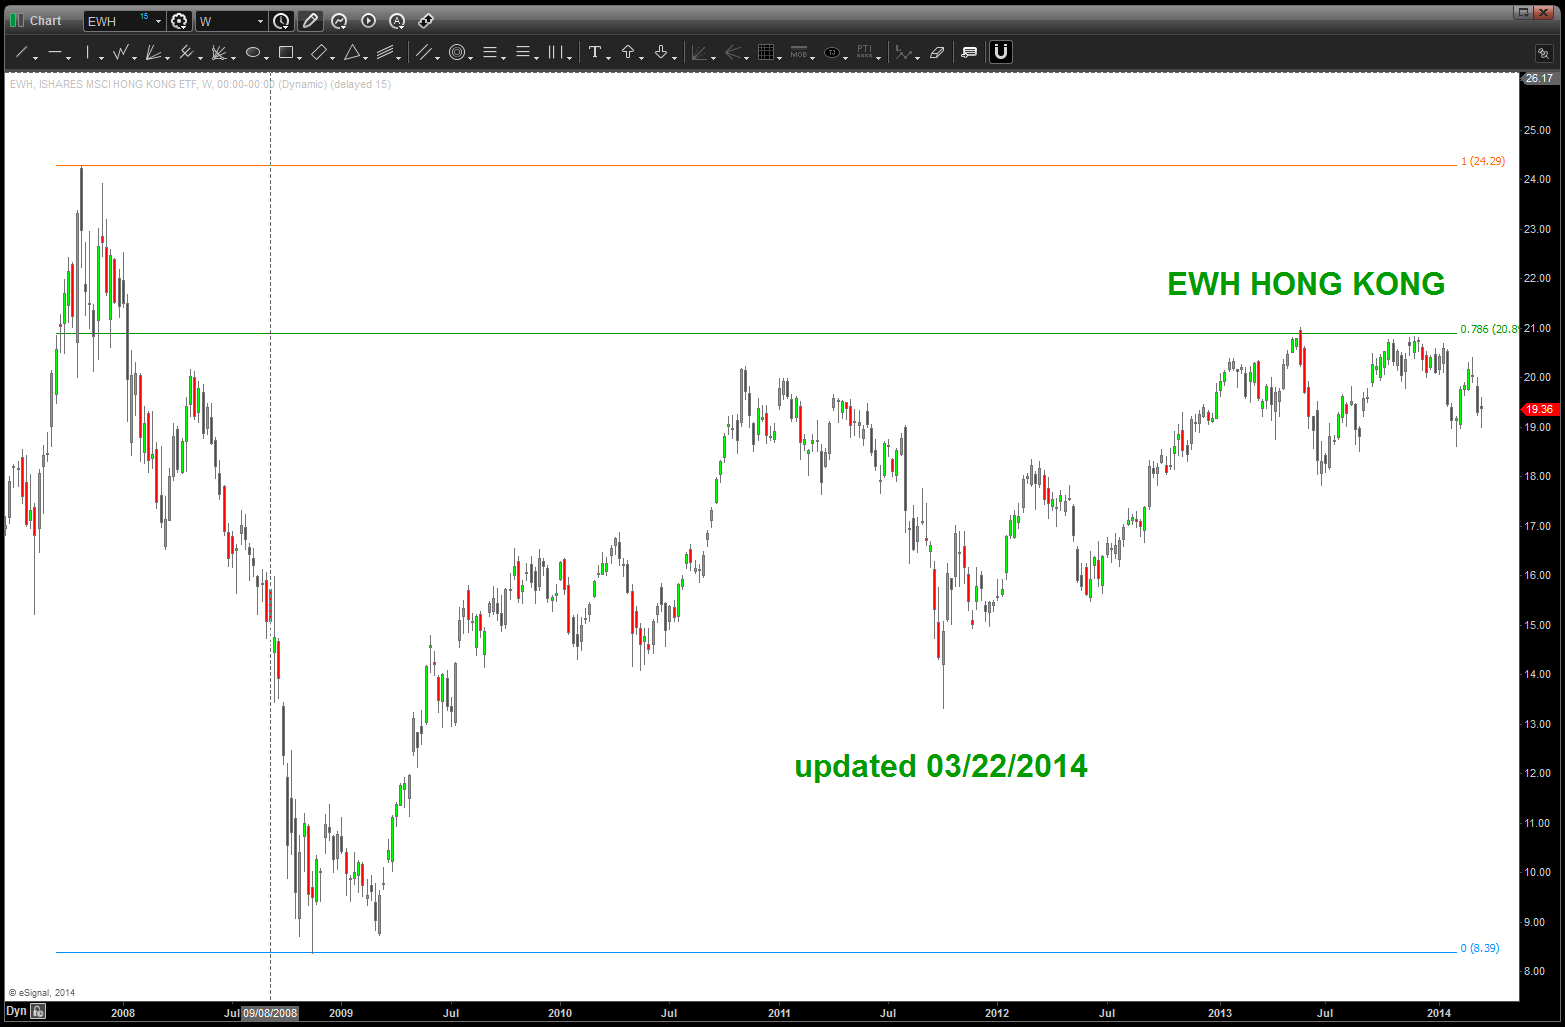
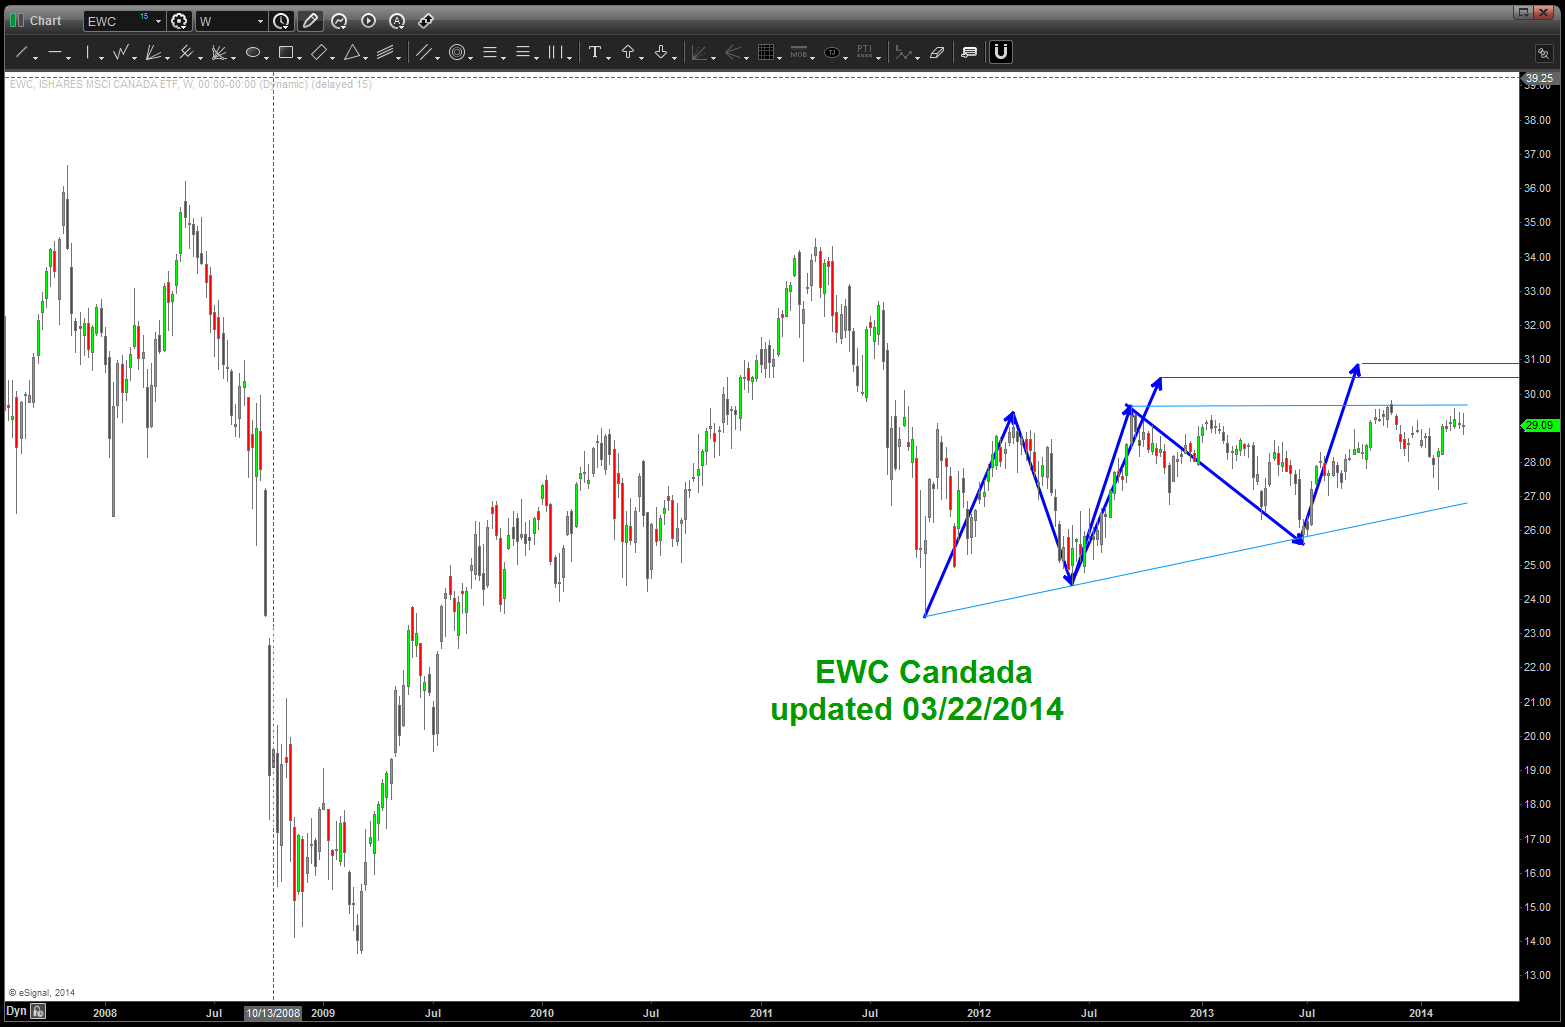
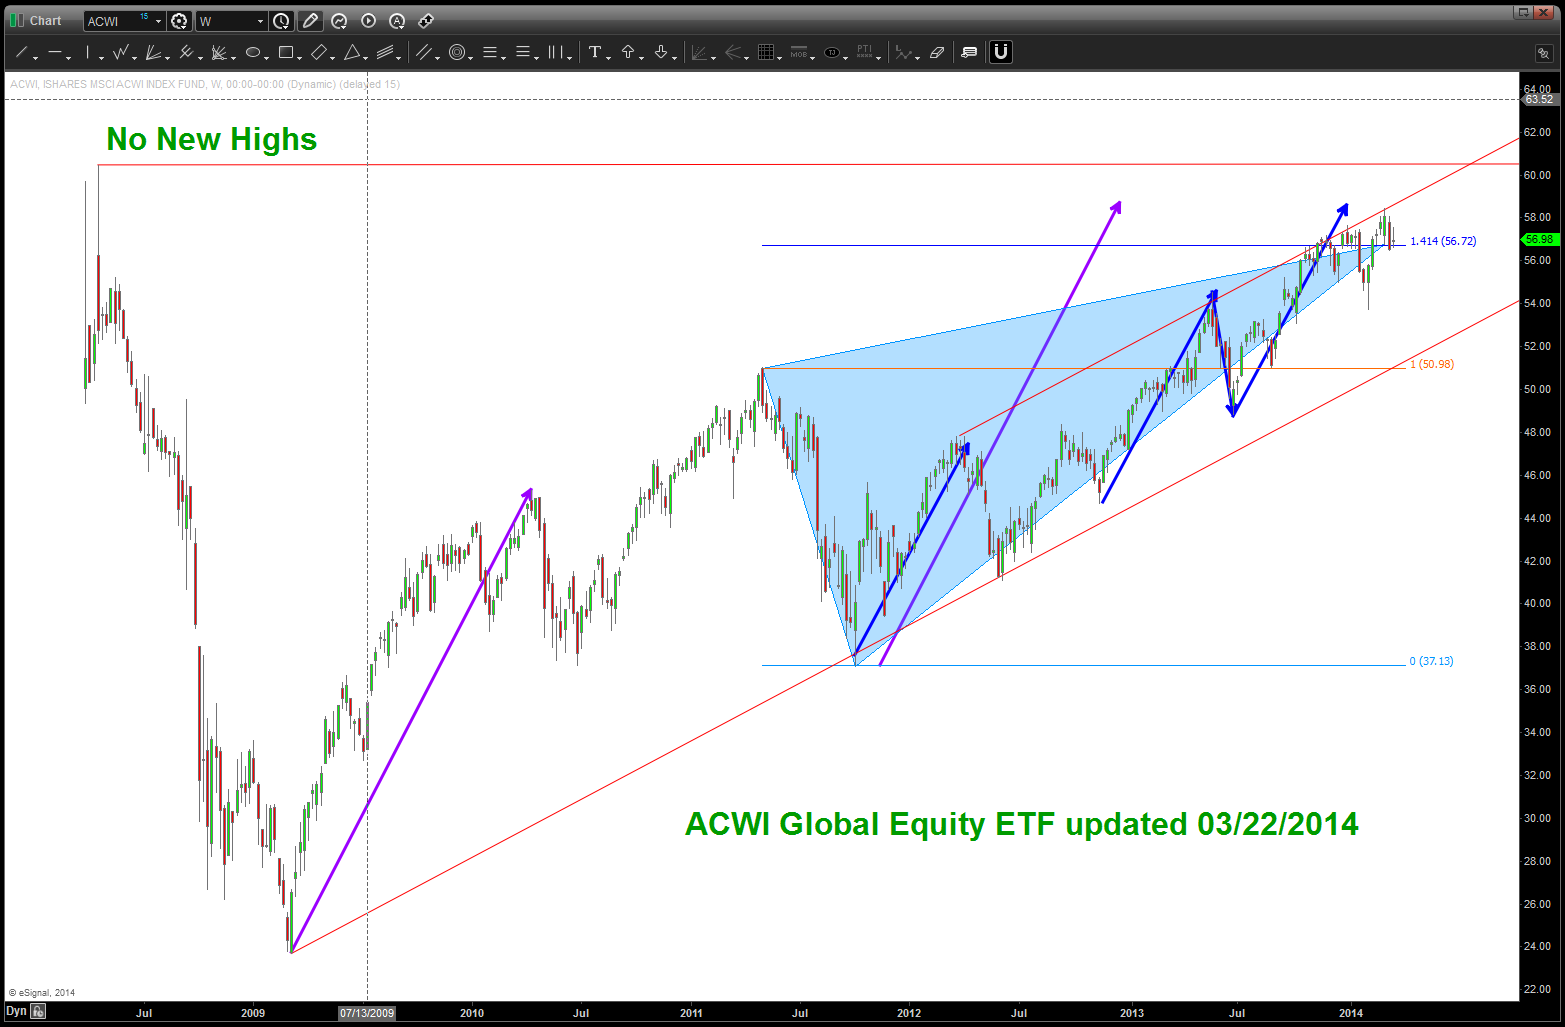
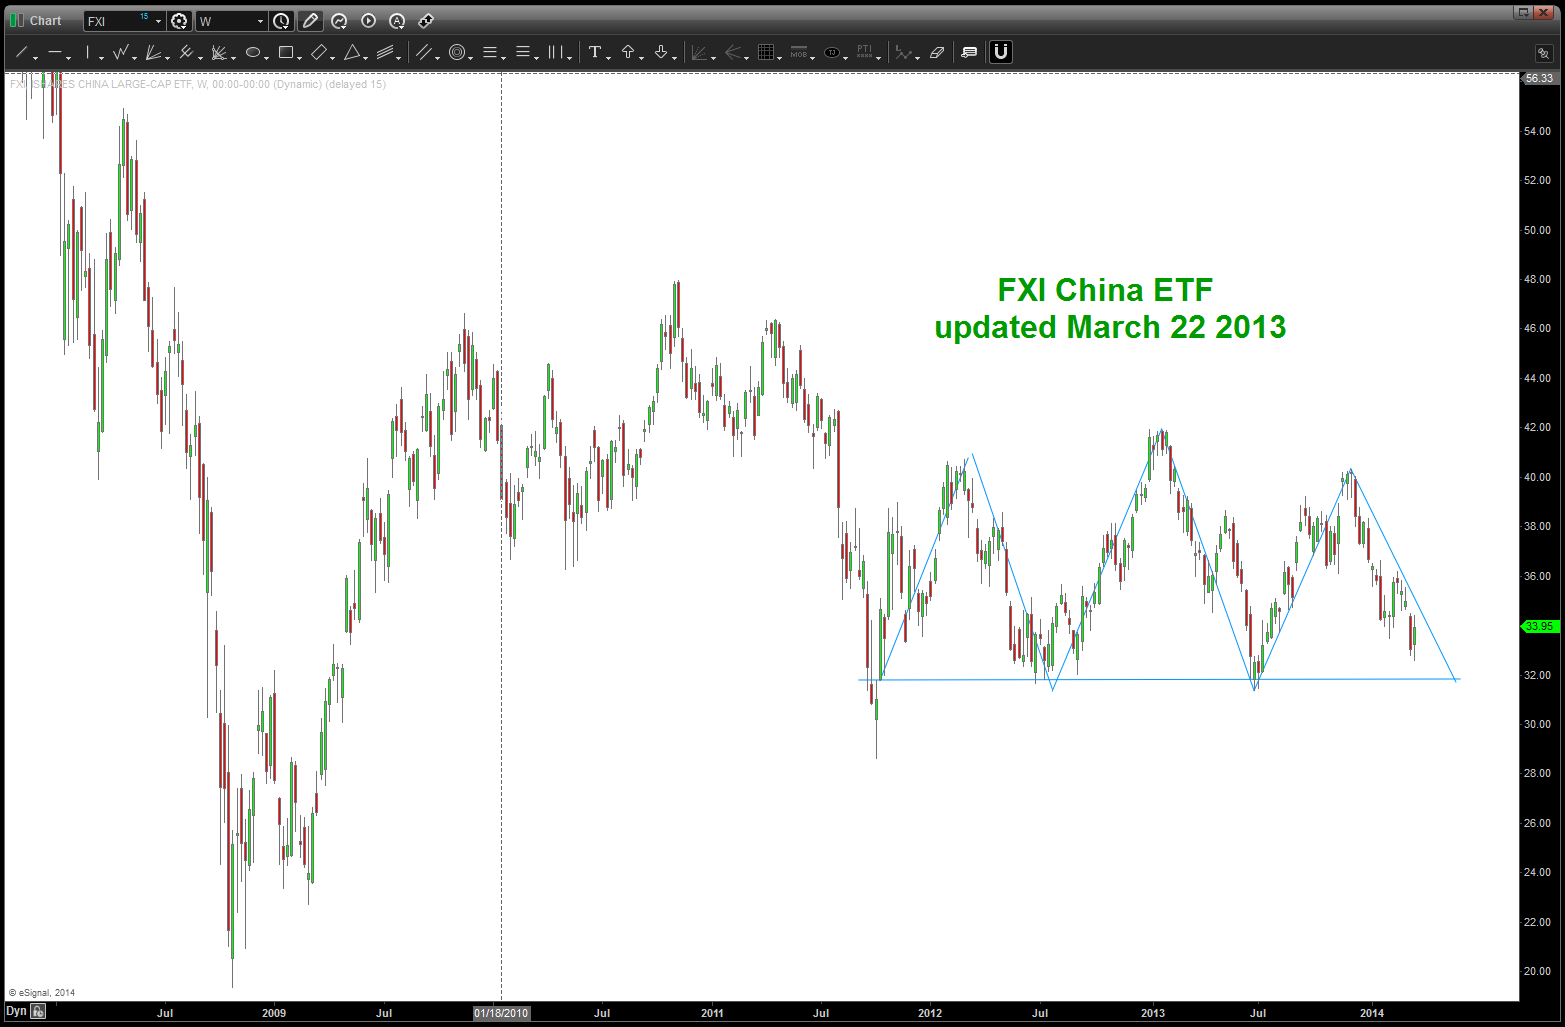
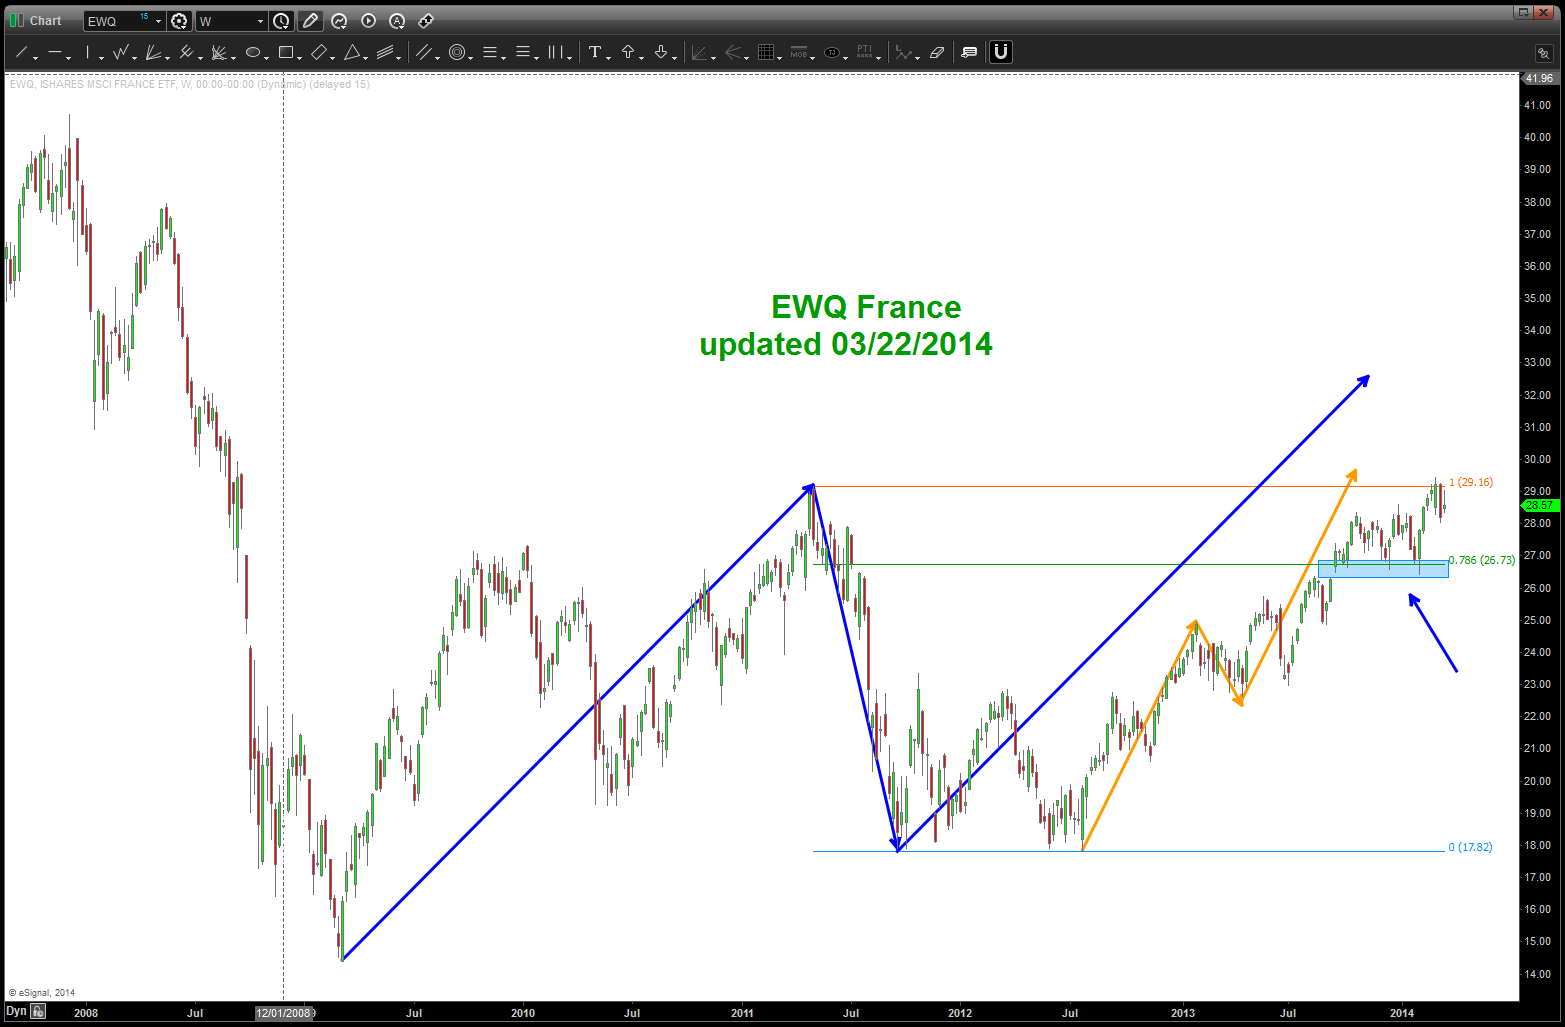
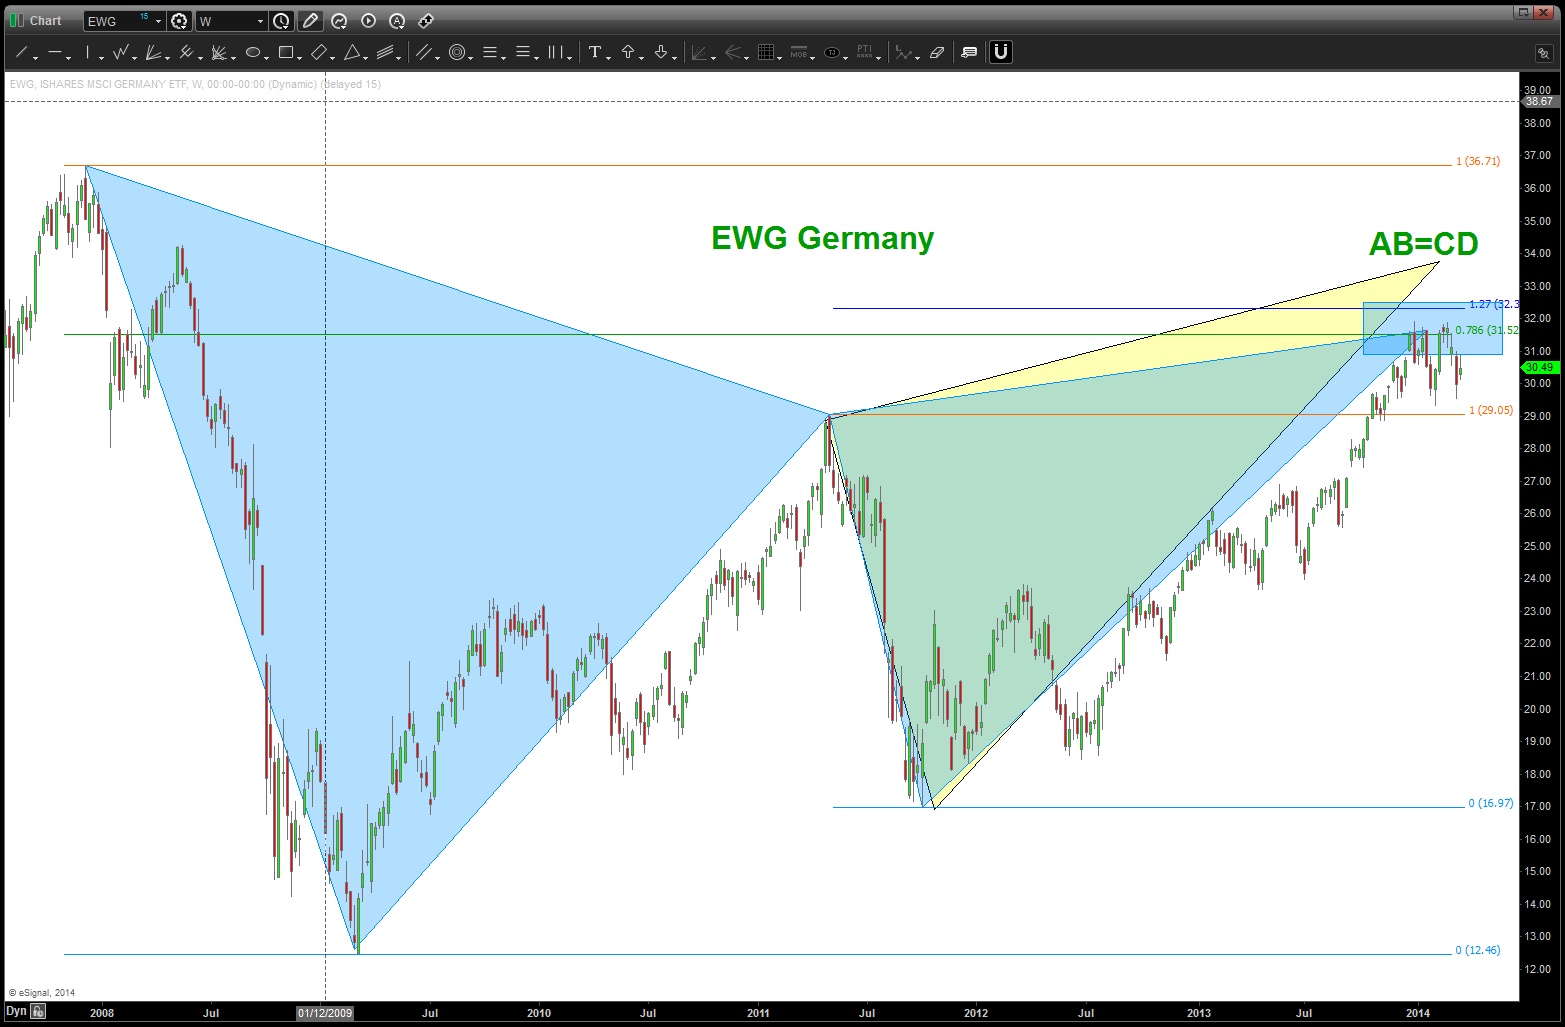
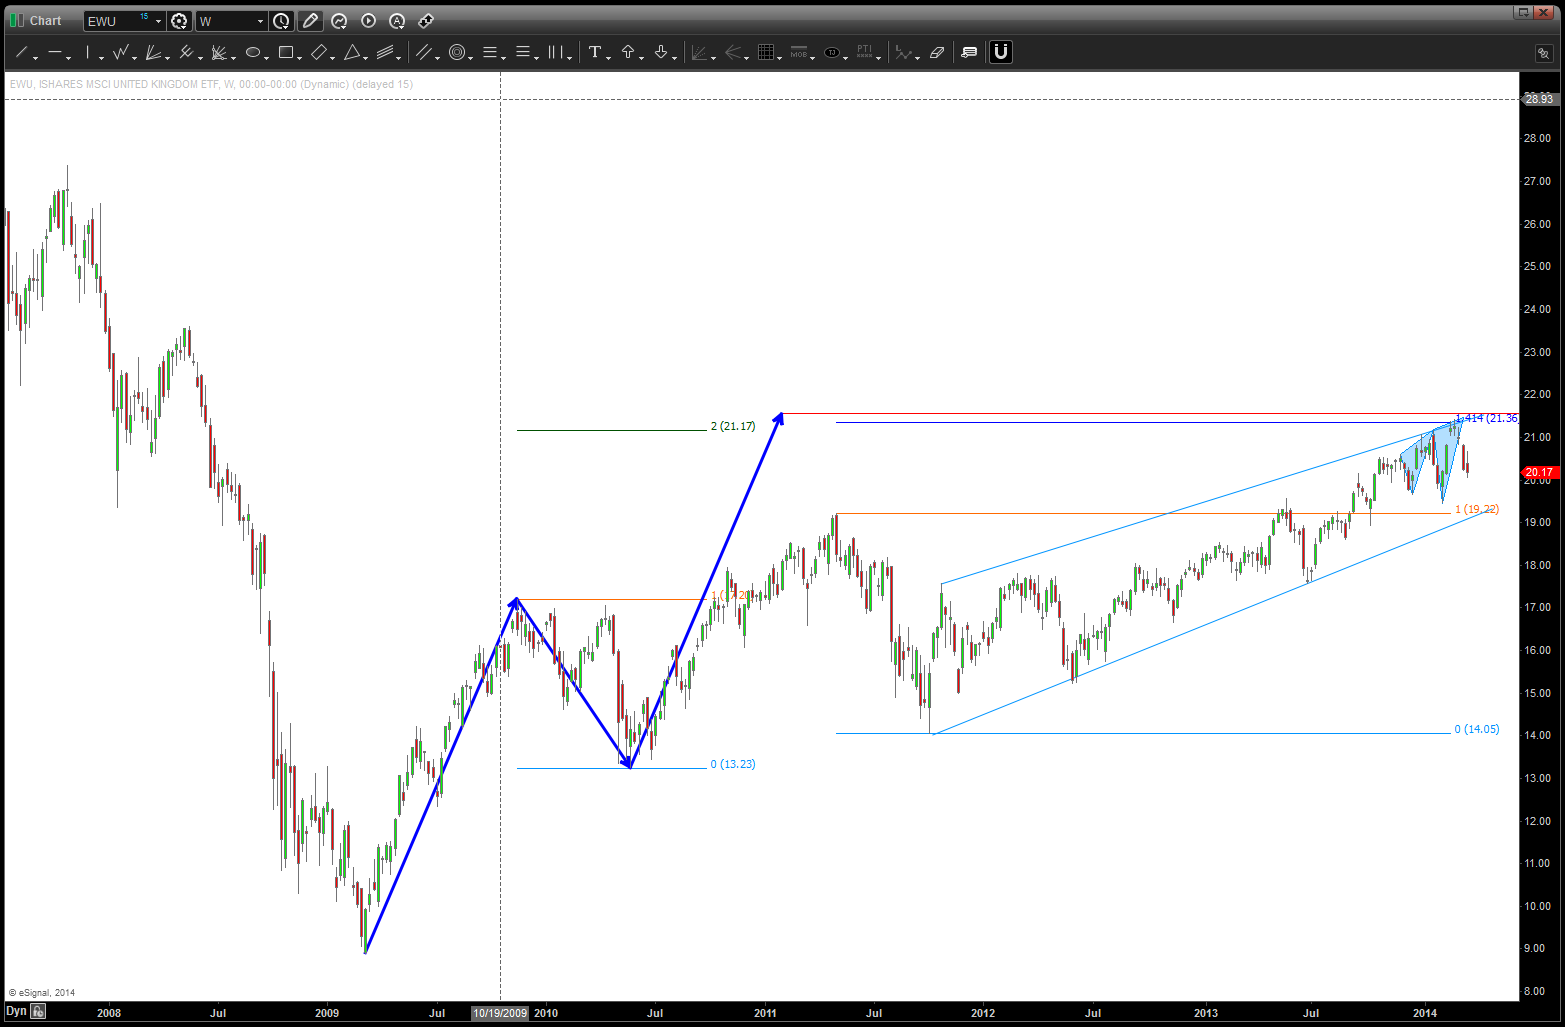
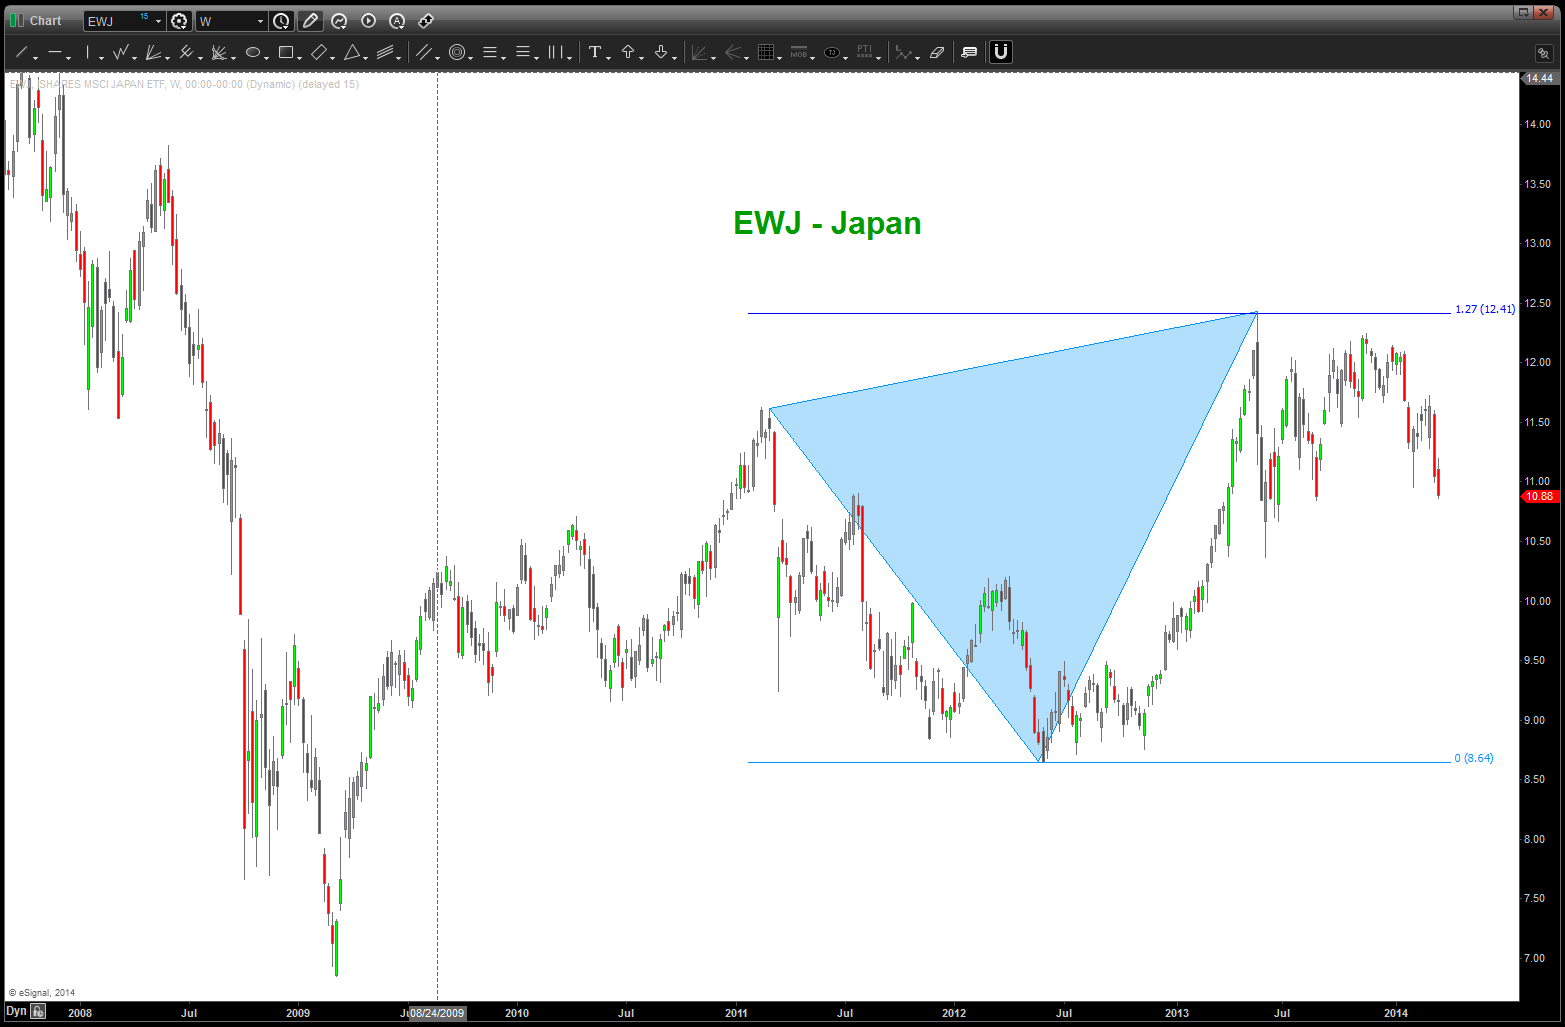
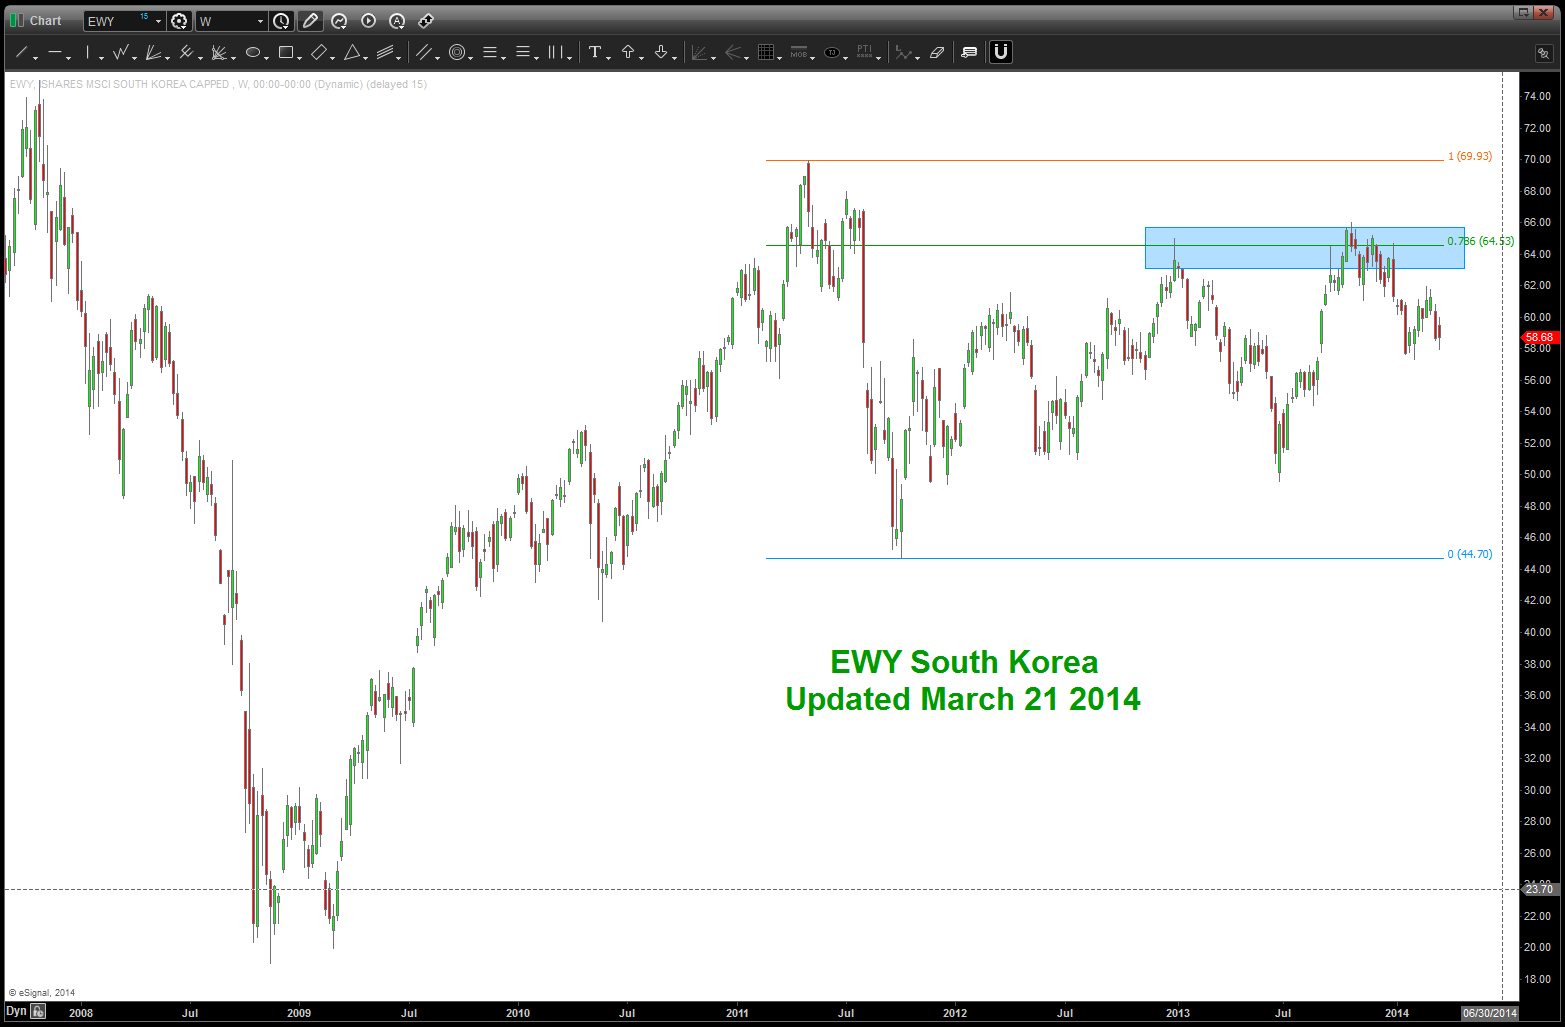
around the world …. the song remains the same
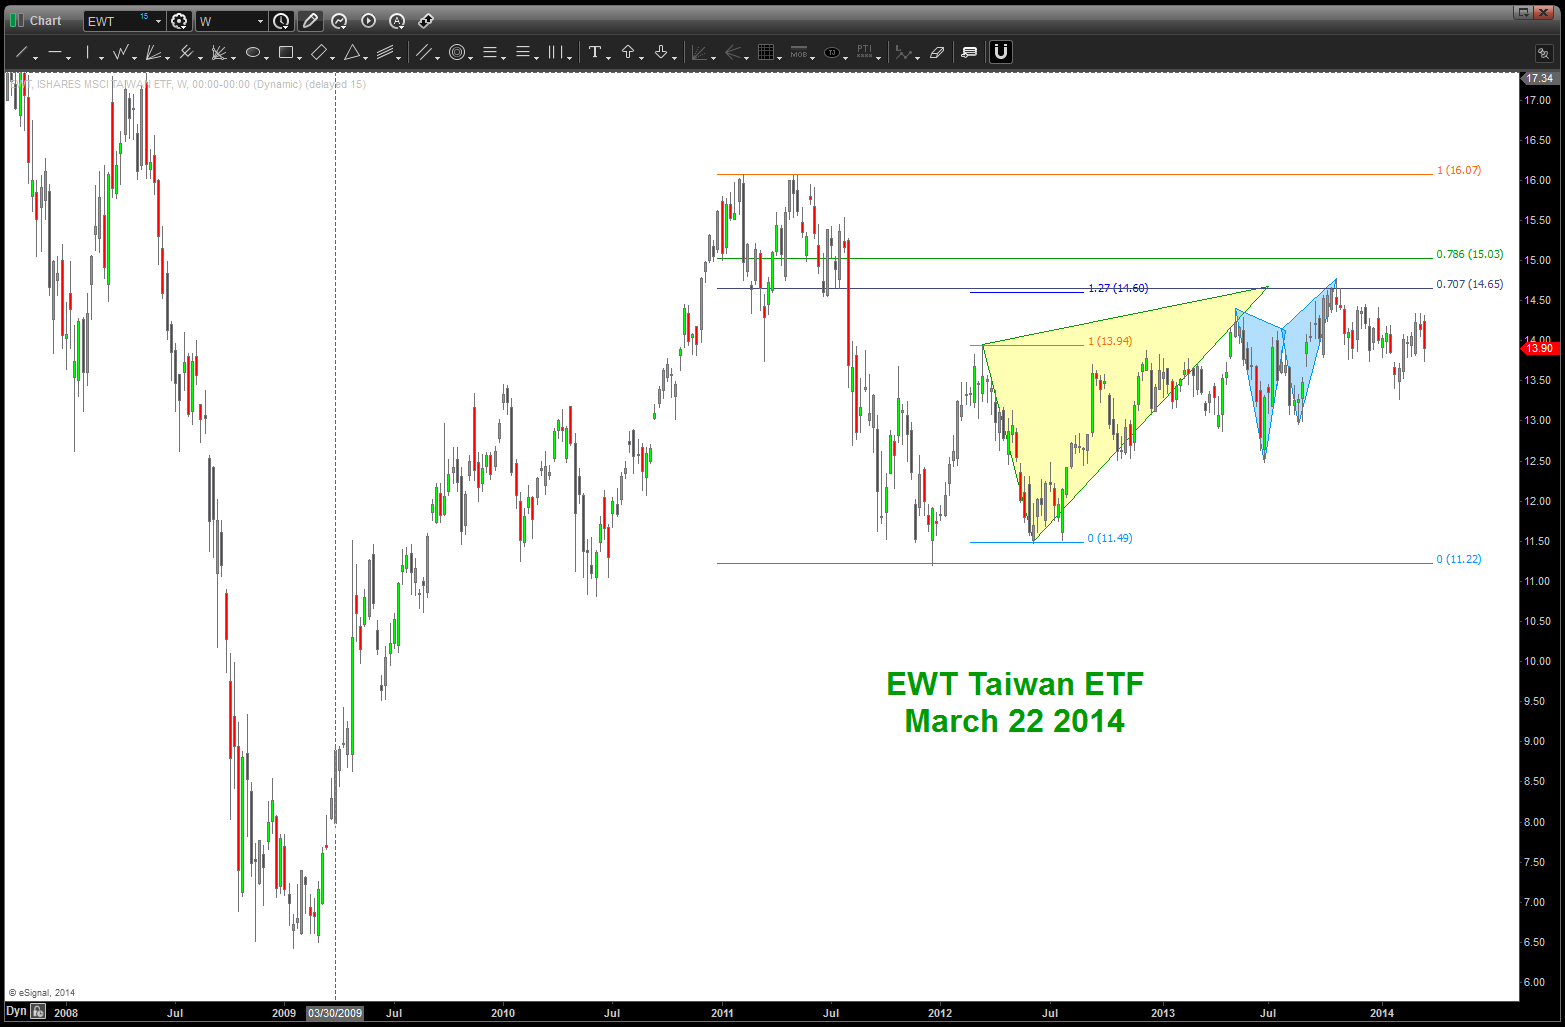
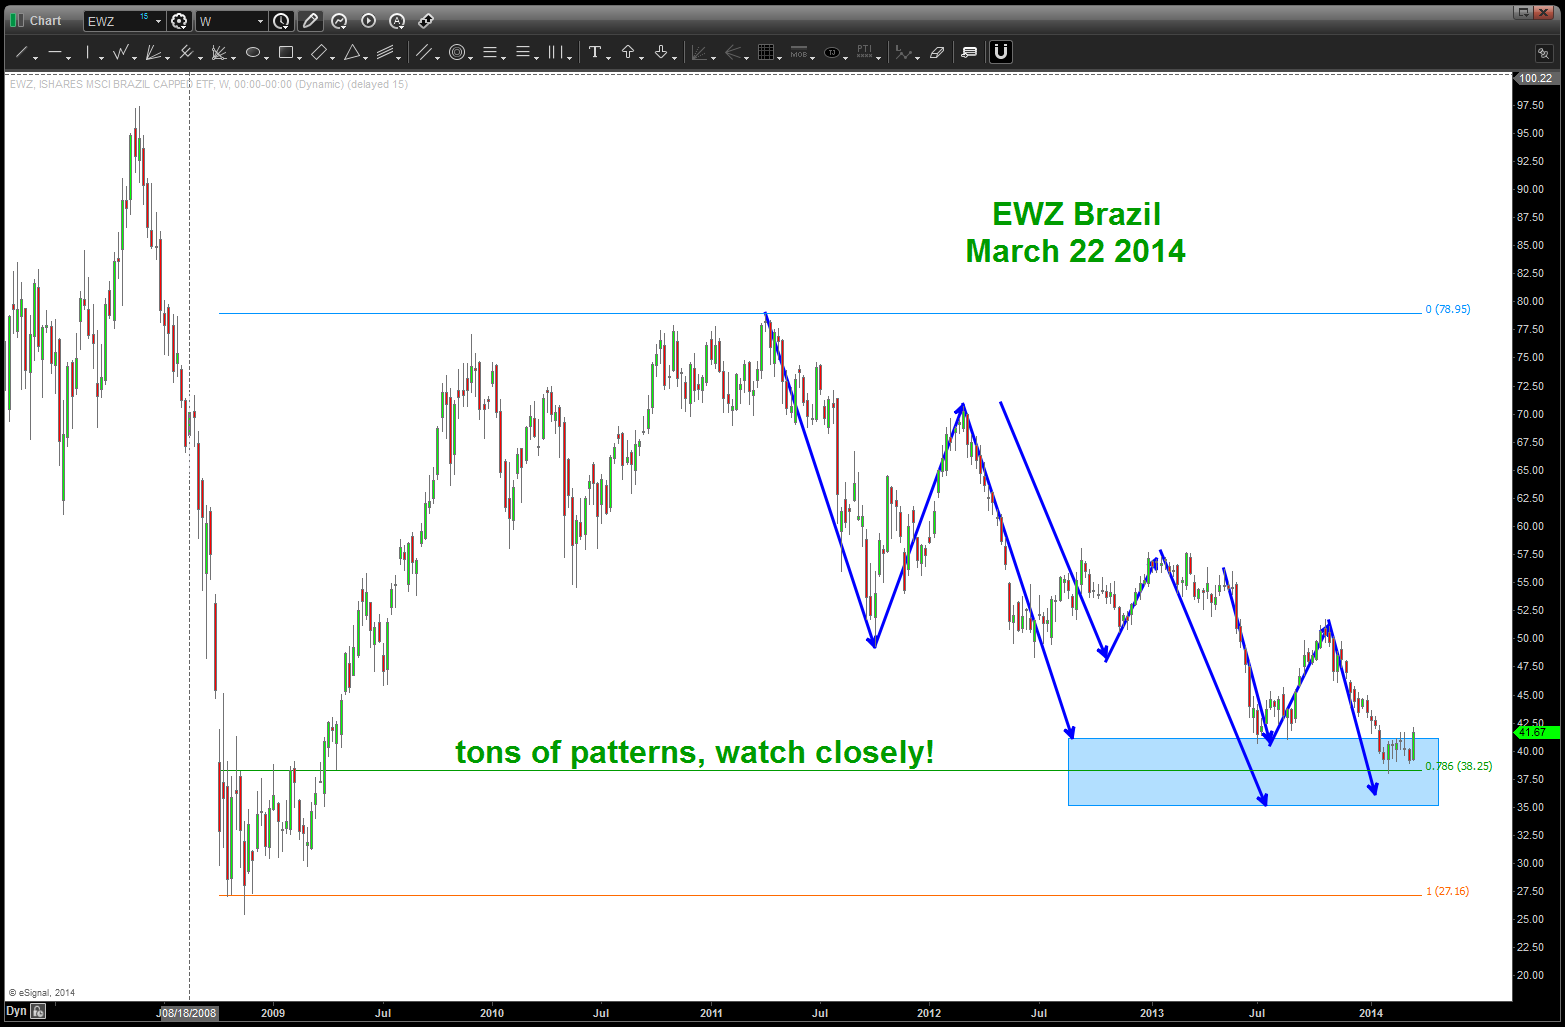
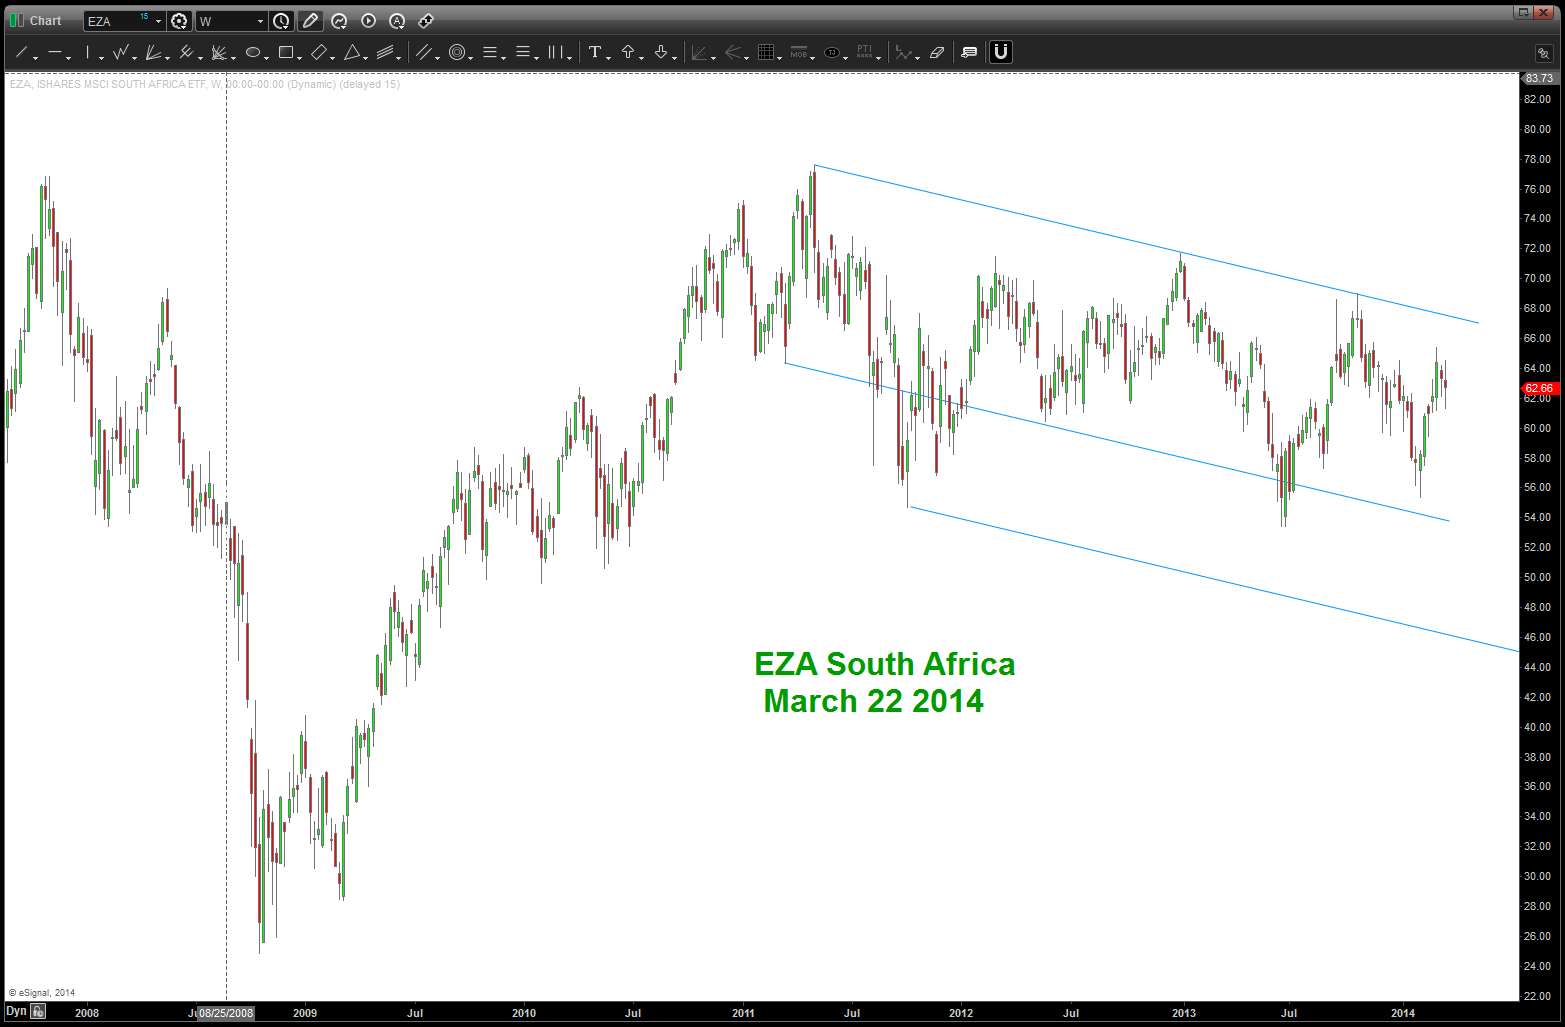
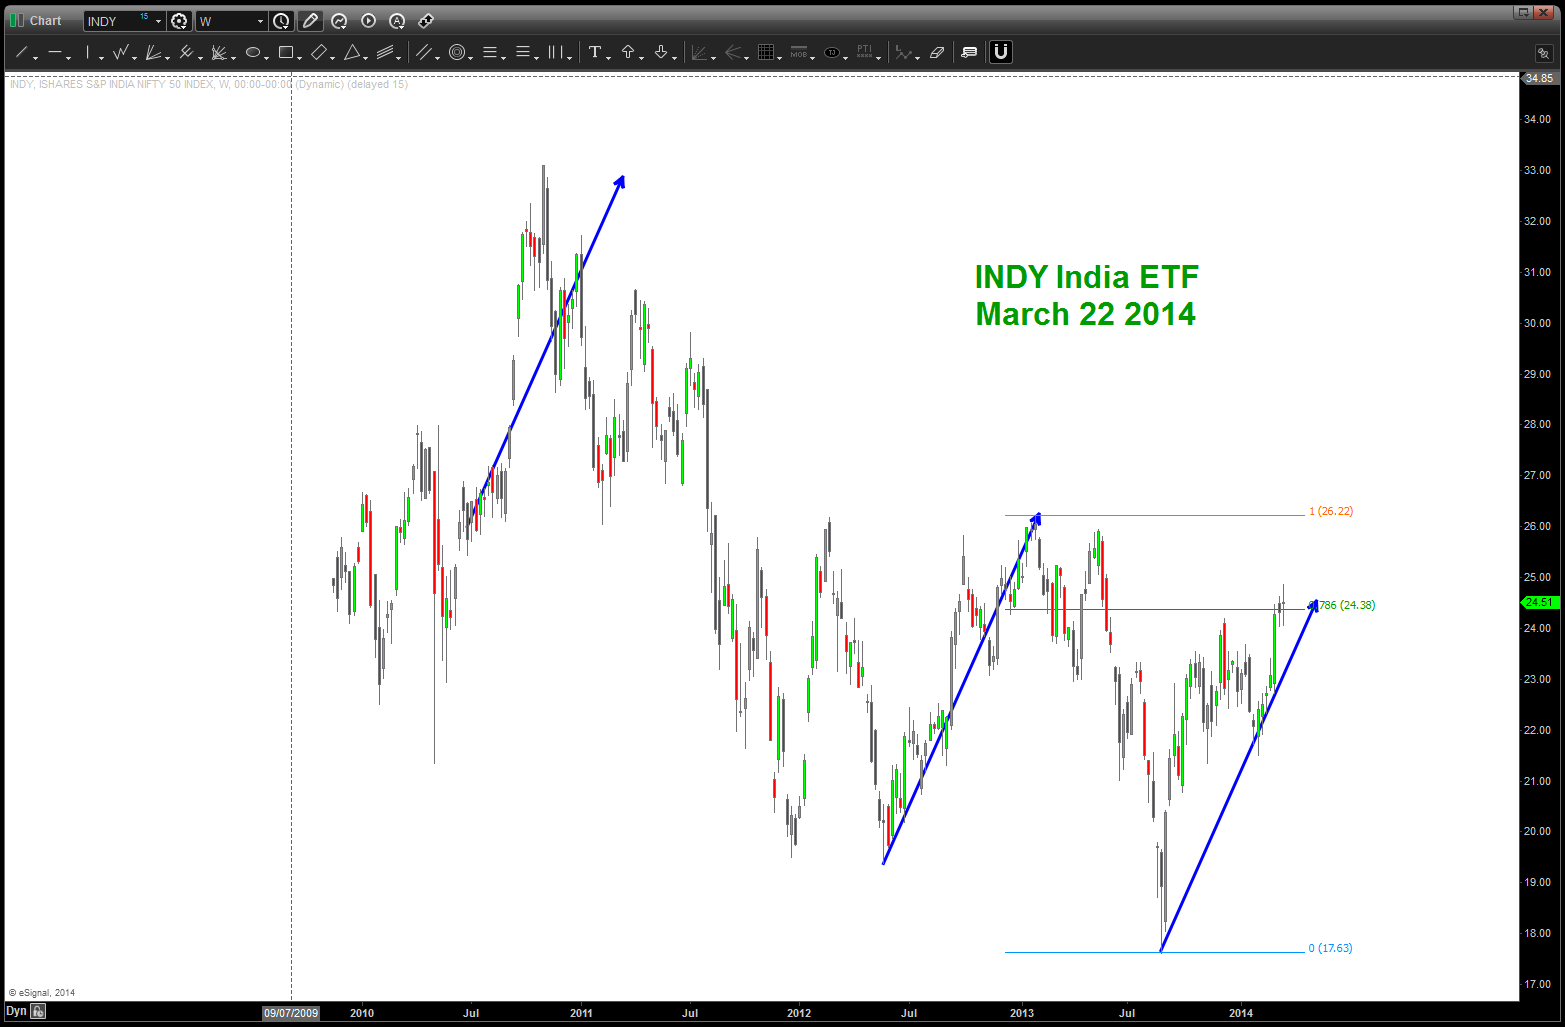
Posted on March 22, 2014 Leave a Comment
cliff notes: not one new high across the world. Malaysia has given it a good try, but has not “on close” exceeded it’s 2007 high. the song remains the same … http://www.youtube.com/watch?v=CcYZlRWWxO0
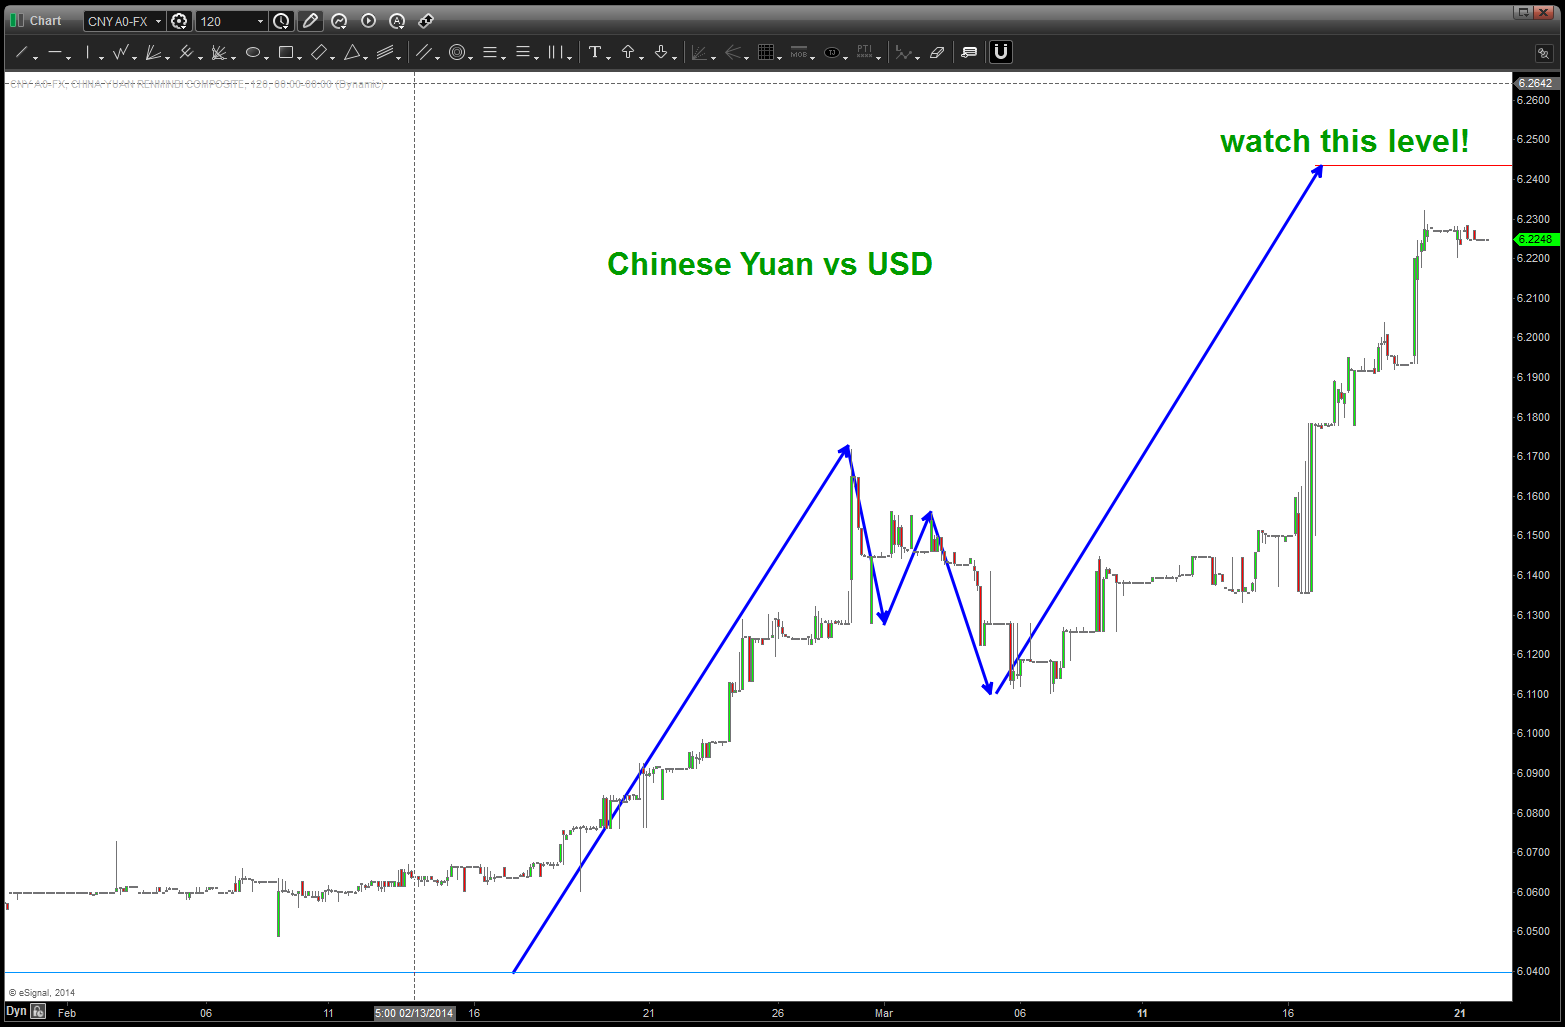
Chinese Yuan continuing to watch
Posted on March 22, 2014 Leave a Comment
we correctly ID an inflection point and it took off … now, a little higher is a SELL USD vs YUAN pattern a little higher. Watch this level shown below as it’s going to be extremely important. Here are the former posts …
https://bartscharts.com//?s=chinese+yuan

