all time low on NASDAQ log trend line
CLIFF NOTES: this is major resistance on the NASDAQ
folks, it’s all about the swing low … while the NASDAQ is continuing to break down like our targets expected, it has not broken a major swing low, yet. This weekend will be very key as we “square out” in days the all time high of 5132. Additionally, note we are only 15 points from 4188 which is the calendar day count from the 10/10/2002 low. So … we have 1) targets being hit in PRICE and 2) equal TIME rally up (noted by blue triangles) and 3) butting against major trend line resistance and 4) a potential square out of price and time from major highs and lows.
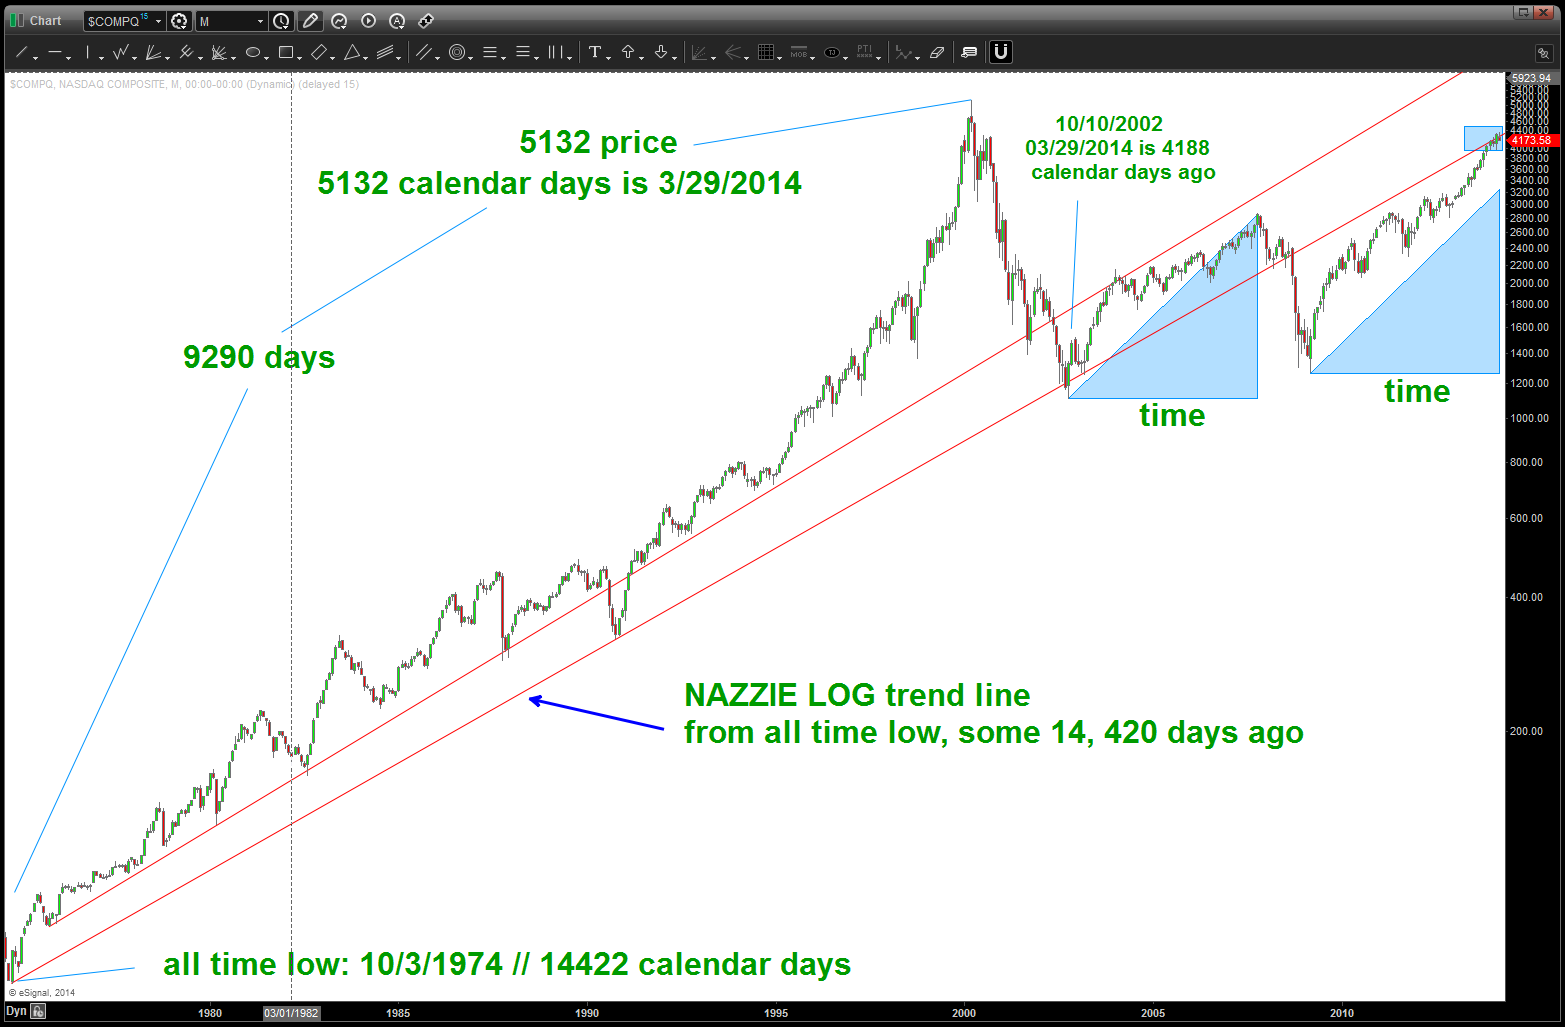
NASDAQ LOG trend line from all time low

Major correction coming?
Alex, it is all about the swing low IMHO. Certainly appears that a bunch of targets have been hit and the market is reacting to them … I am aware that some significantly bearish cycles are hitting in the month of April. To quote one of my mentors: “The biggest cluster of cycles we will face for the next decade hit from April 14 to 23rd. In my life I’ve never seen anything like it except perhaps for 1974. My guess is a Middle East War or major stock market collapse. I would be extremely defensive.” So, I’m just simply looking at patterns and they certainly aren’t bullish .. get defensive if/when a weekly swing low is broken. Until then, technically, the bulls are still in control. Does that make sense?
Yes it does. Thanks
excellent and thanks for the questions // let me know if you have any more. Bart