TBT update …
Posted on May 1, 2014 Leave a Comment
CLIFF NOTES: have added the time component to the chart. NOTE the blue rectangle of the last correction (08/2012-05/2013) and how that correction is exactly the same tomorrow. Expecting 62 to hold for resumption or at least a bounce. If not, a big sell off should occur…
last post: https://bartscharts.com/2014/04/27/tbt/

TBT w/ time component added
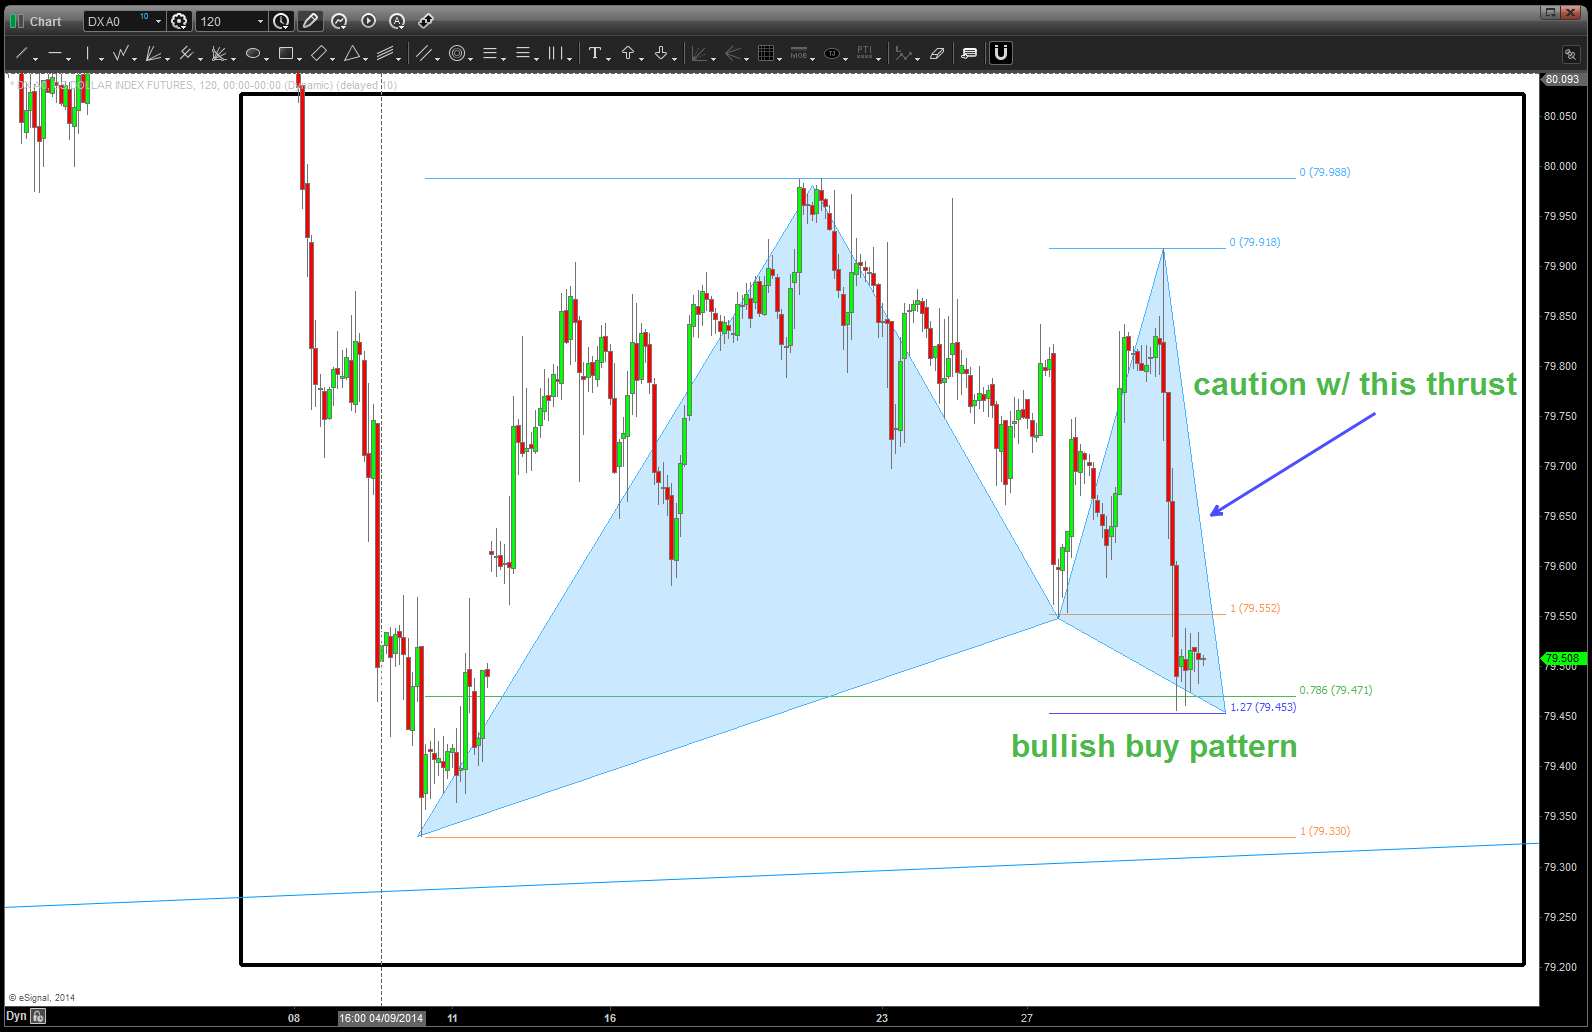
the dollar index is at a very crucial and critical level at 79.45-79.47
Posted on April 30, 2014 3 Comments
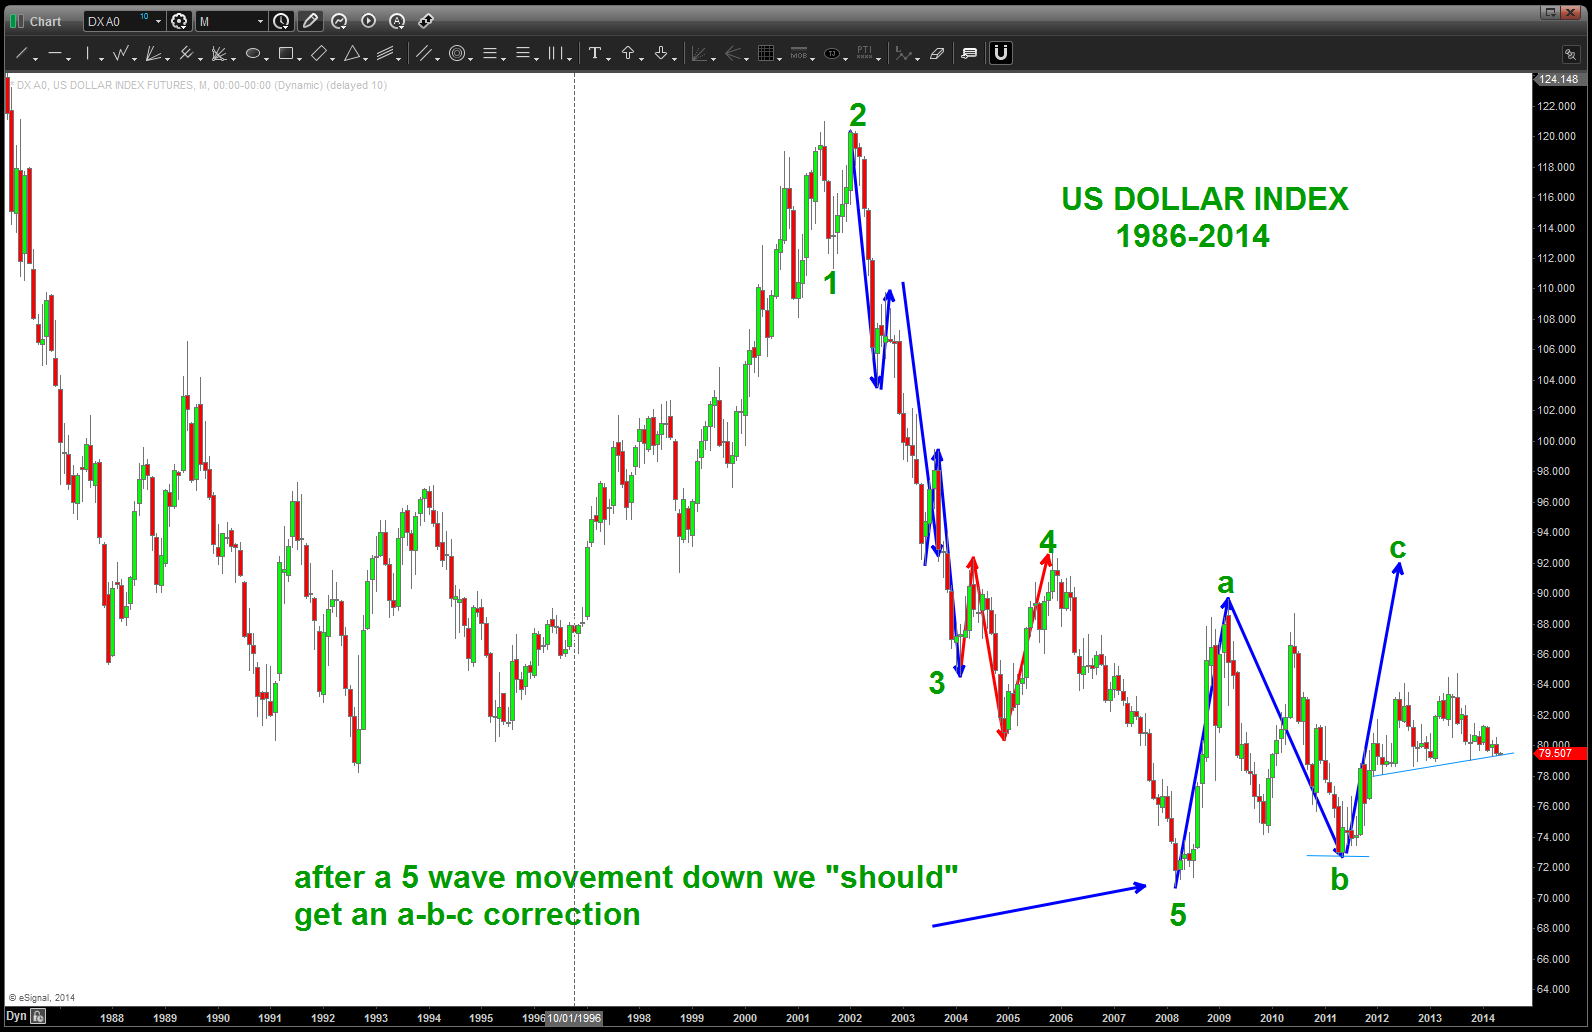
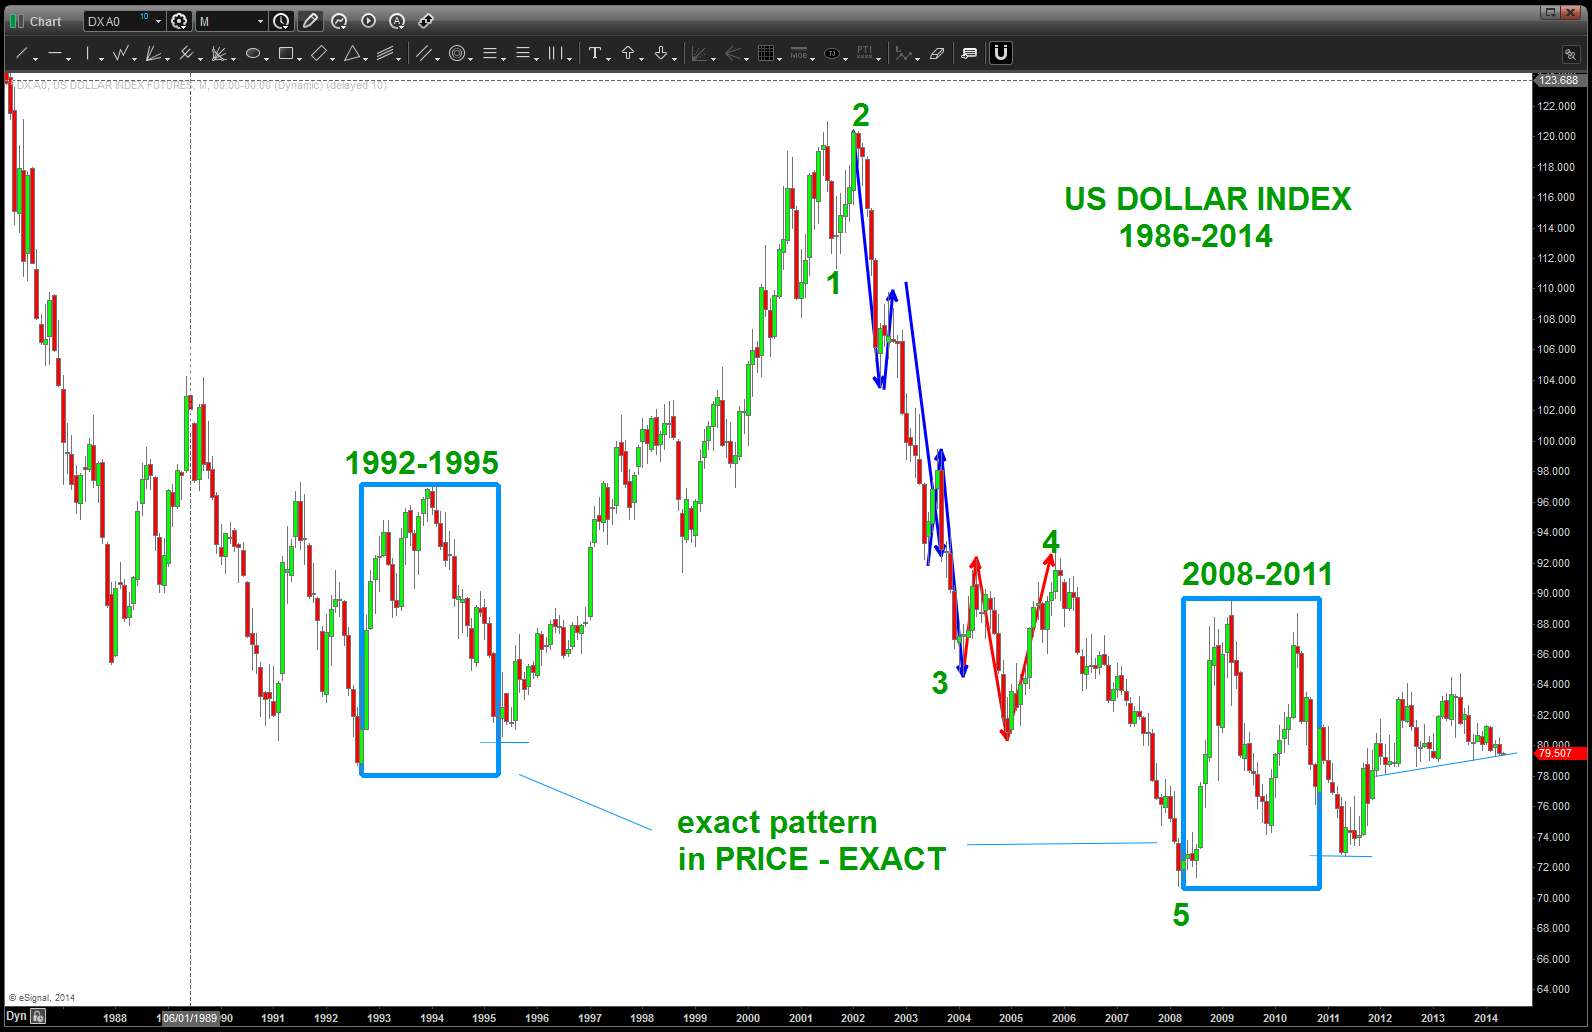
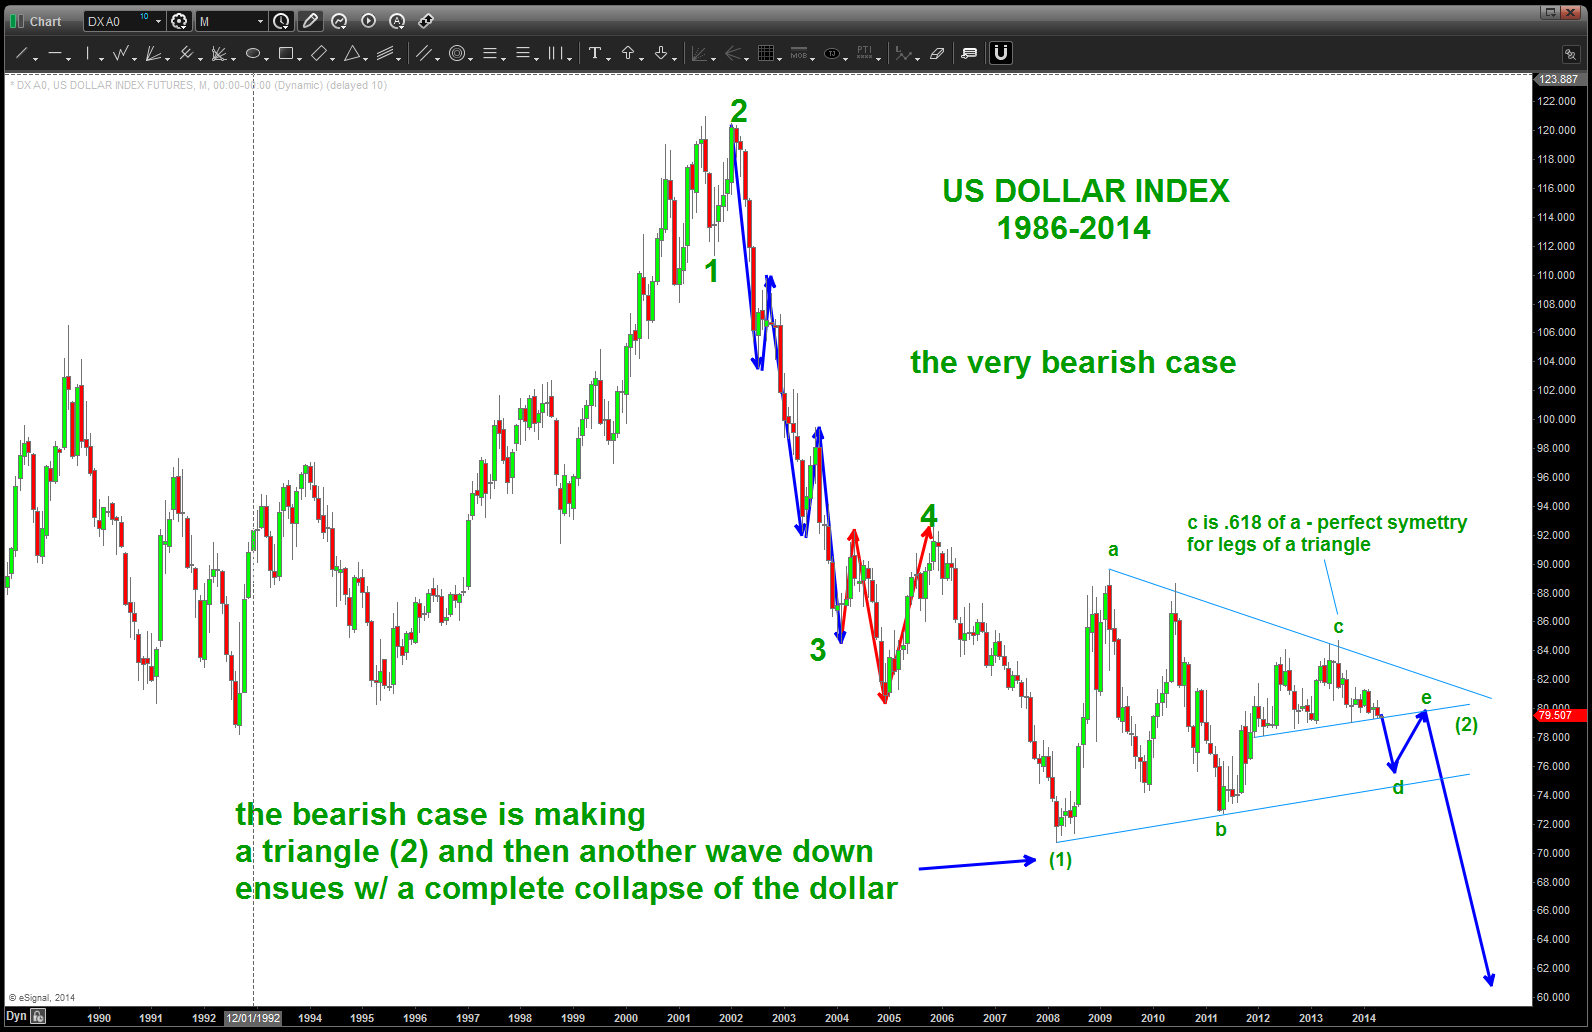
CLIFF NOTES: I have been a dollar bull for almost a year now and while price has made higher highs on the longer term time frame, it sure looks sick on a daily. So to the drawing board I have gone …and, while you will see a very nice an orderly count down into 5 waves, what I decided to do is label the bottom wave a (1) meaning this entire consolidation which I think has kicked a lot of people in the rear (bulls and bears) is making a big multi year triangle and it’s, ultimately, going to crack the dollar wide open. Not good …
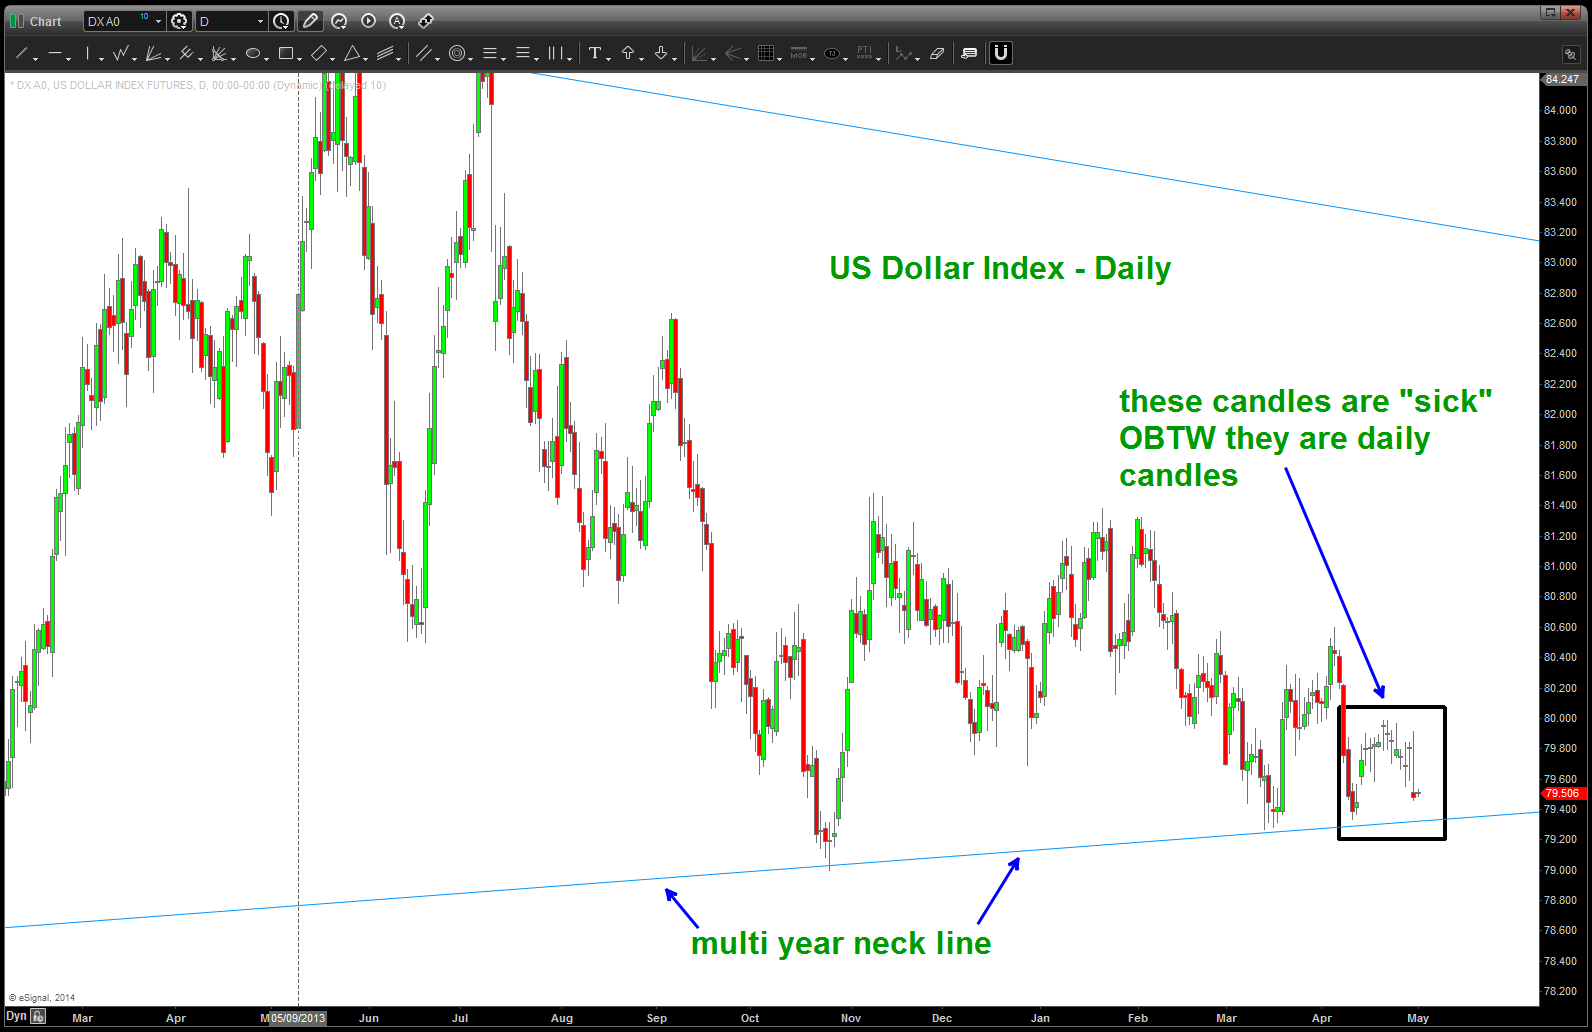
HEADS UP – we have completed a bullish BUY pattern on the dollar index right at the multi month trendline at 79.45-79.47. But caution is warranted as the THRUST into this level is very bearish. If this pattern fails then leg “d” has begun into the 76 level, and we need to come to the realization that the dollar has potentially entered a very bearish scenario. Now, I fully expected us to be zooming away in a C wave up to the mid 90’s as shown but the C wave is described as being “a beauty to behold” or “devastating in nature” w/ thrust and momentum that GOES. Can you say that the chart is telling us that for the last 1.5-2 years it’s been a rocket ship? No chance …this has been one dead puppy. And the “visual” weight certainly looks like she might break the trend line.
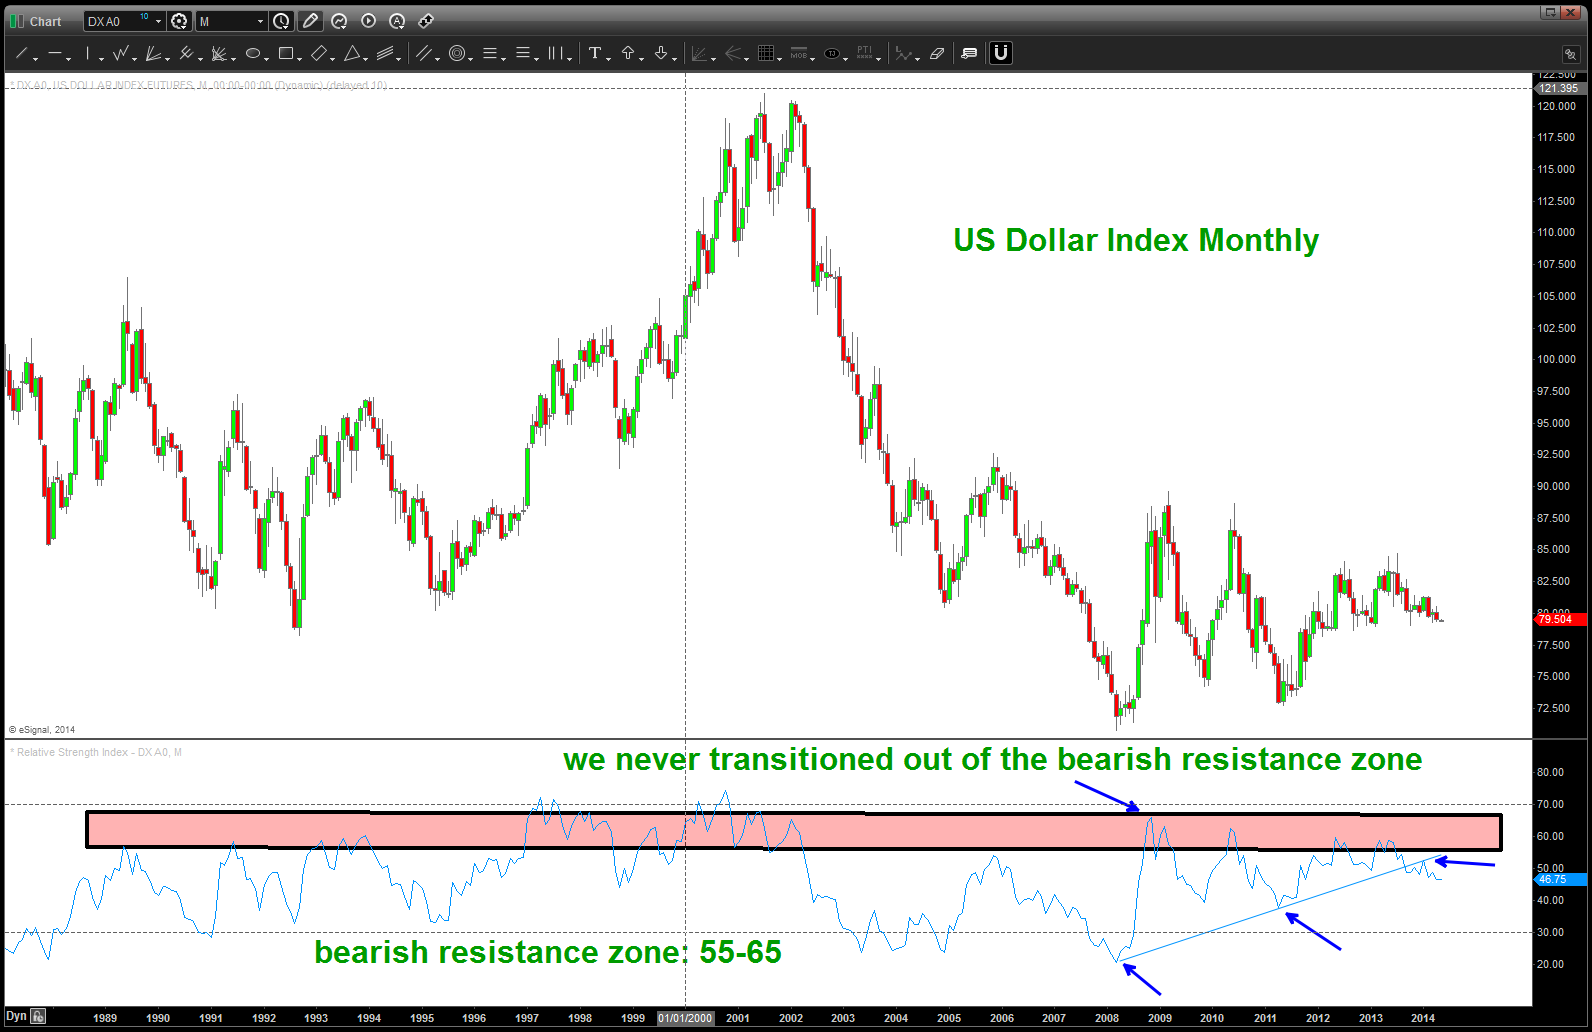
here’s one look at the long term Monthly RSI w/ the bearish resistance bands on the RSI noted. As you can see the BIG POP up never transitioned above the bearish resistance zone. The RSI will tell us when the trend has changed … since the POP it’s made lower highs and just broke the trend line that had held the RSI as support …
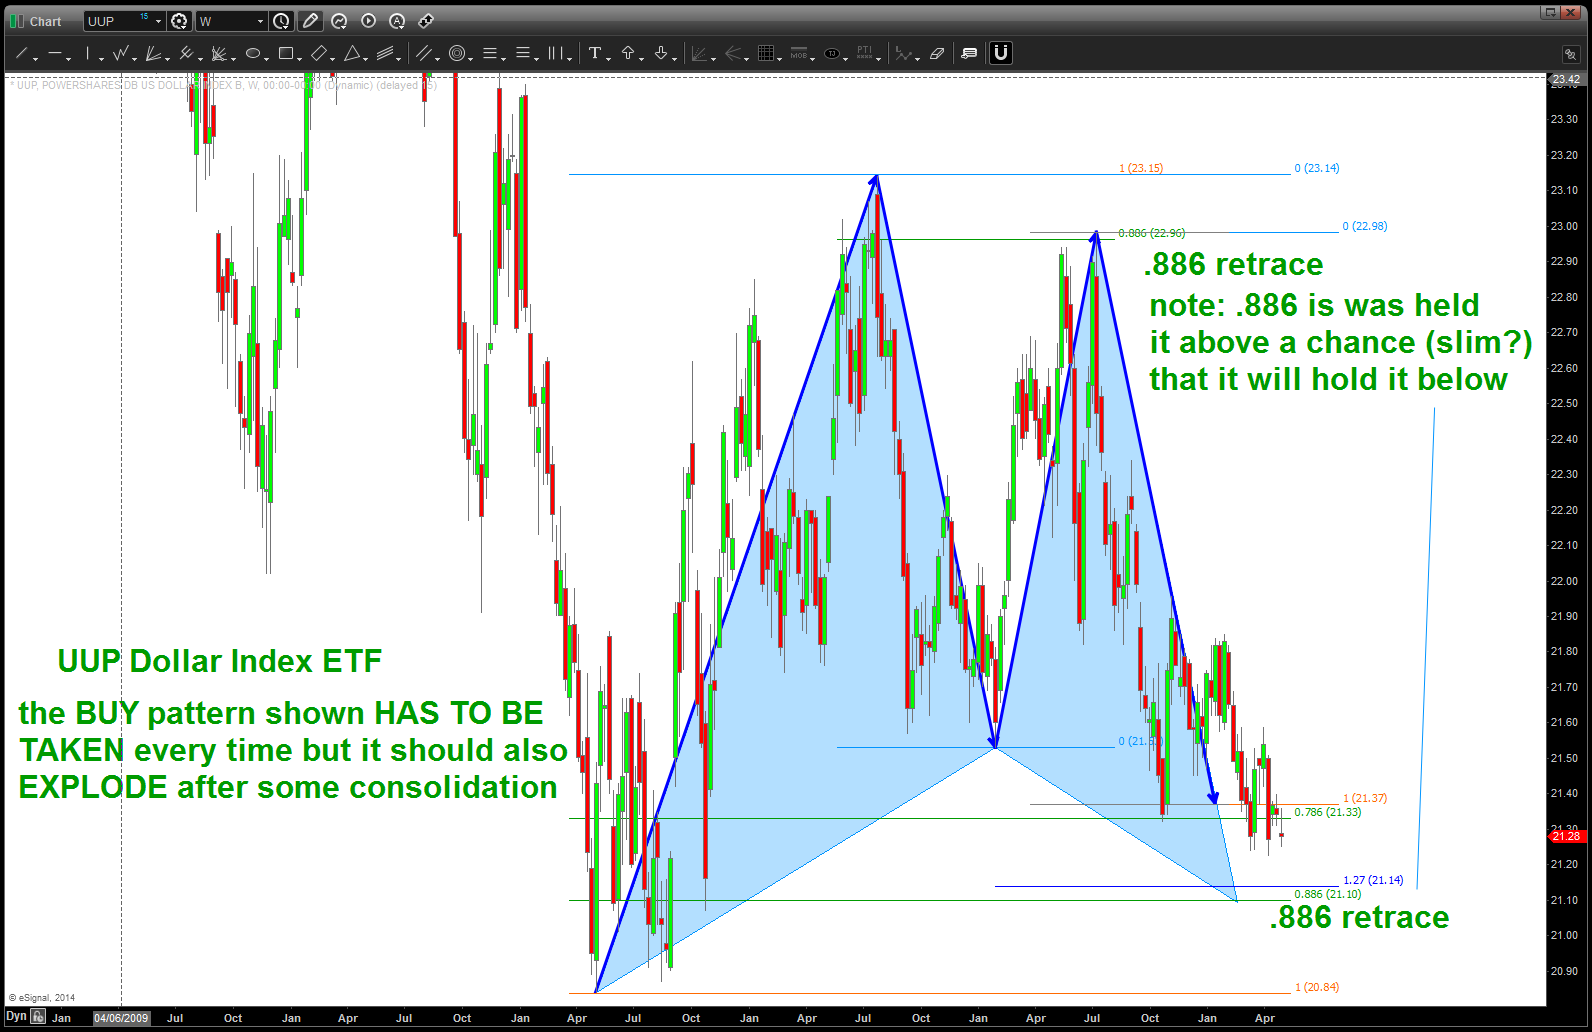
Note the UUP ETF below … folks, as far as PATTERNS go there isn’t a better set-up. NOTE the .886 retrace held it as resistance so MAYBE it will hold it as support? Either way, if we break down below 20.84 look out below. The UUP BUY was such a nice pattern.
BOTTOM LINE: watch the BULLISH BUY pattern .. with this much slumping and also the BIG CANDLES that came crashing into the pattern today if the dollar can with stand this push THEN it will be impressive. Have to put my big boy technician pants on perhaps throw in the towel on my BULLISH DOLLAR thesis that I have clung to for 1.5 years.
We’ll know in the next two days …
Bart
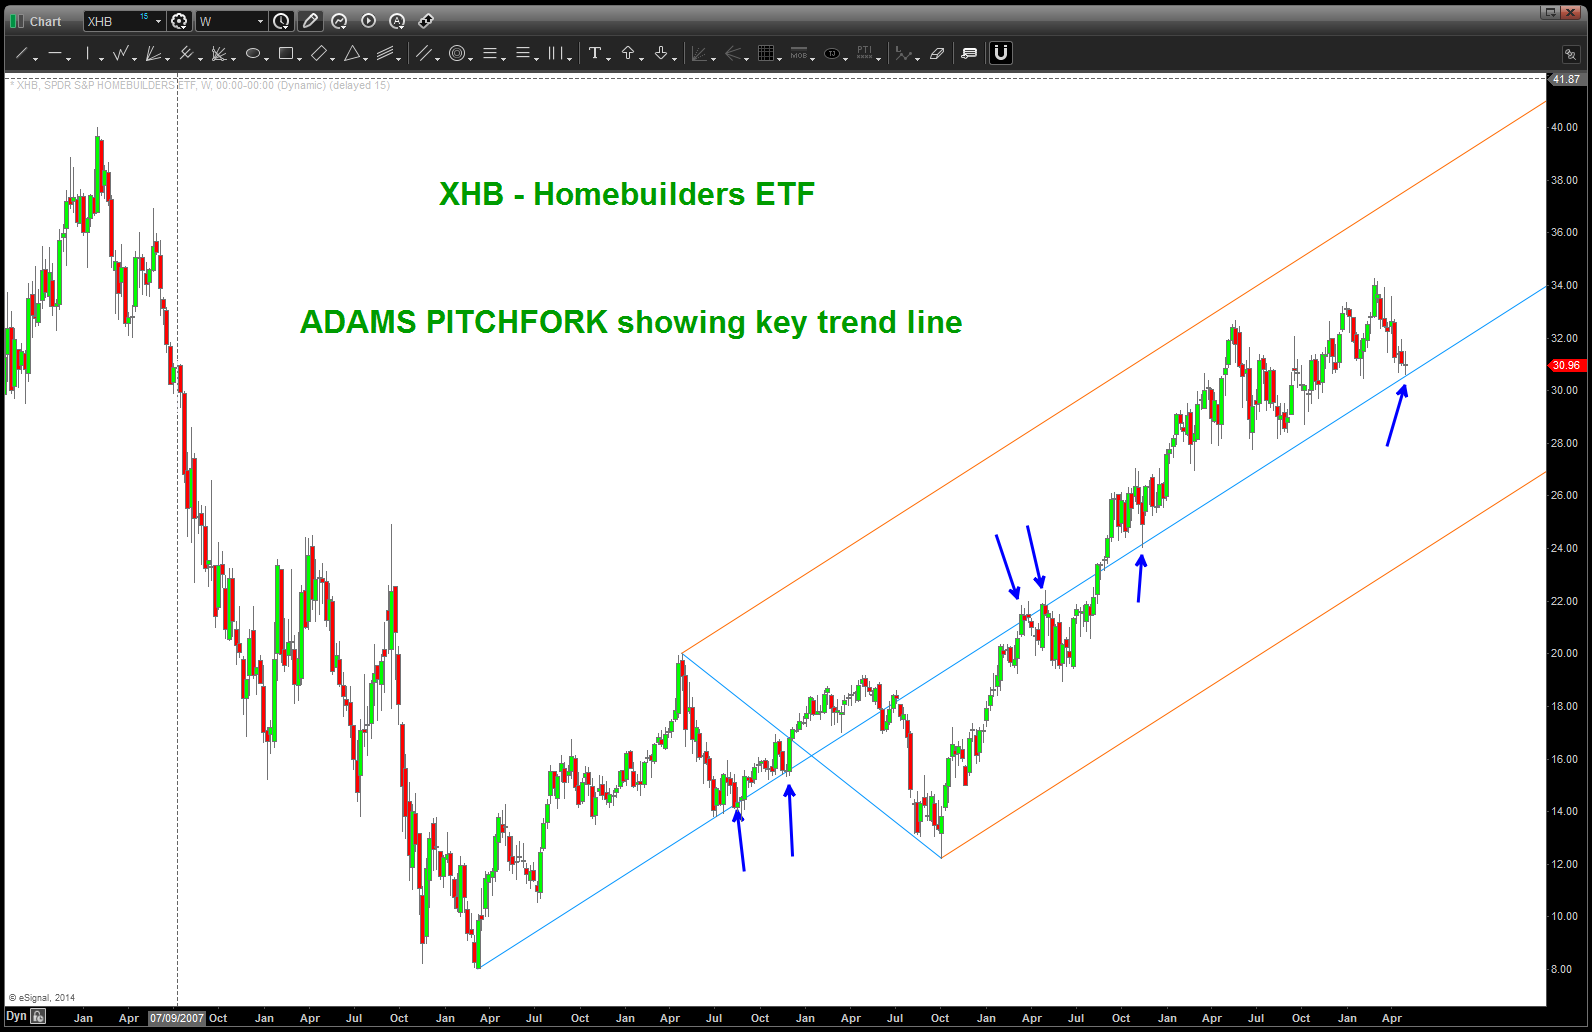
Home Builders relook …
Posted on April 29, 2014 1 Comment
CLIFF NOTES: can see why this current level is important using Adams Pitchfork Method. The Head and shoulders shown in the post below never materialized by breaking the neck line and we rallied a buck or so higher. Still looking for this to be an “end of move” pattern …
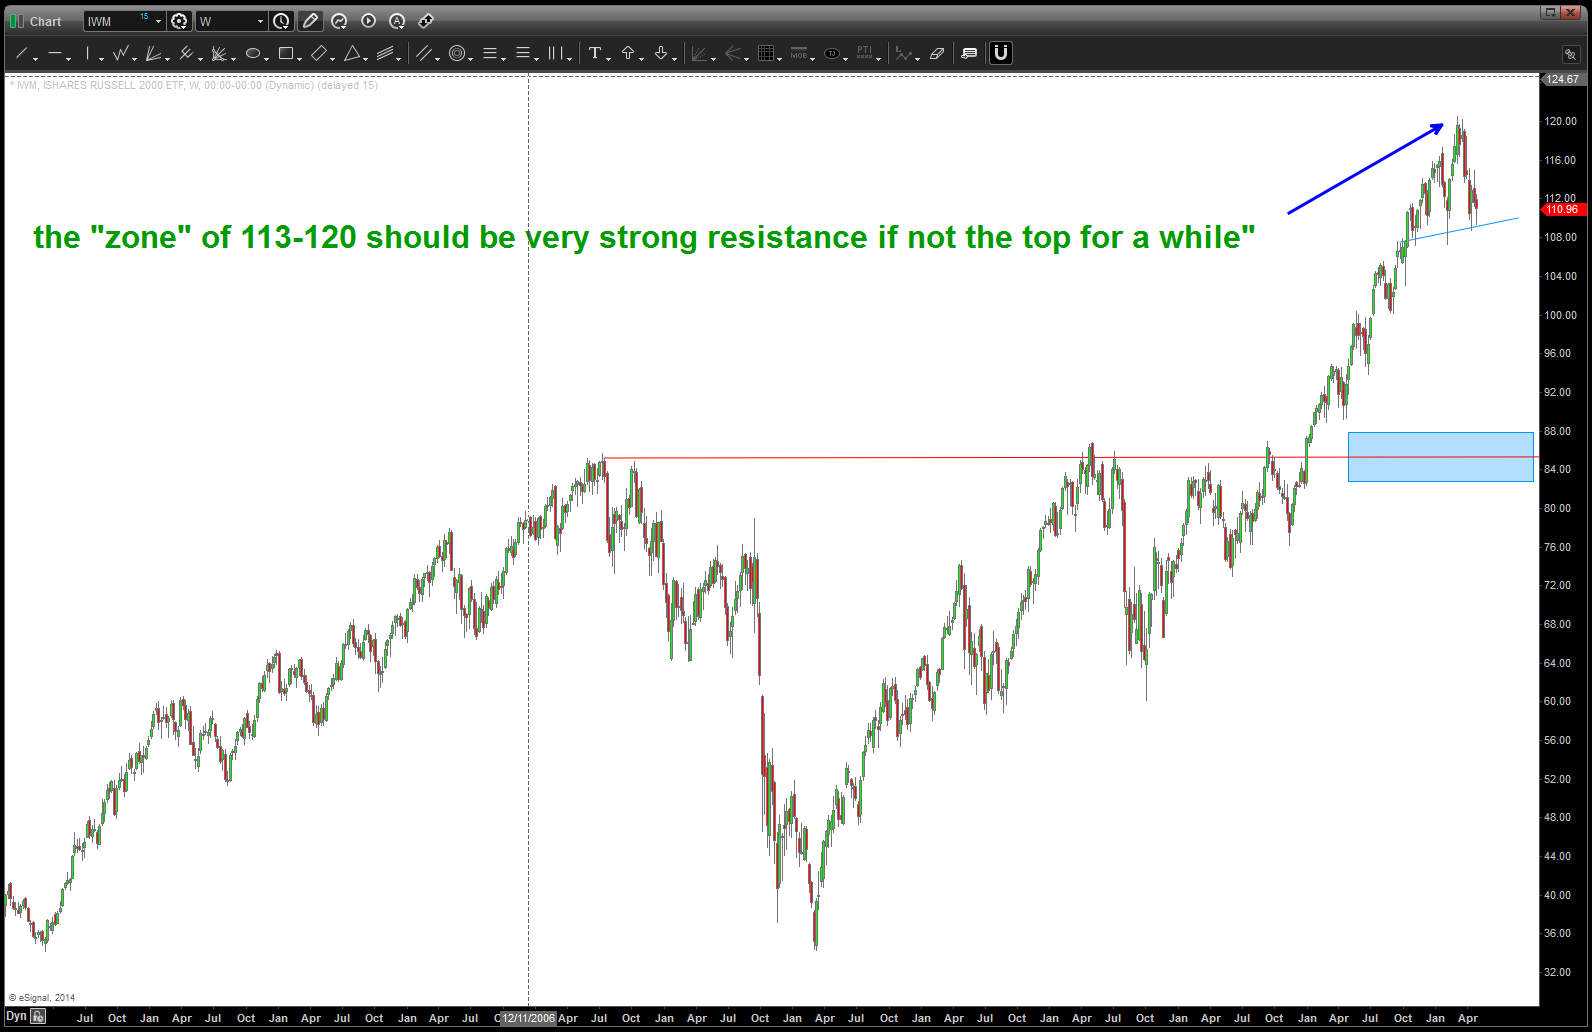
about the zone of 113-120 being a potential top in IWM ….
Posted on April 28, 2014 Leave a Comment
IWM: https://bartscharts.com/2013/11/26/iwm-what-a-perfect-set-up/
IWM
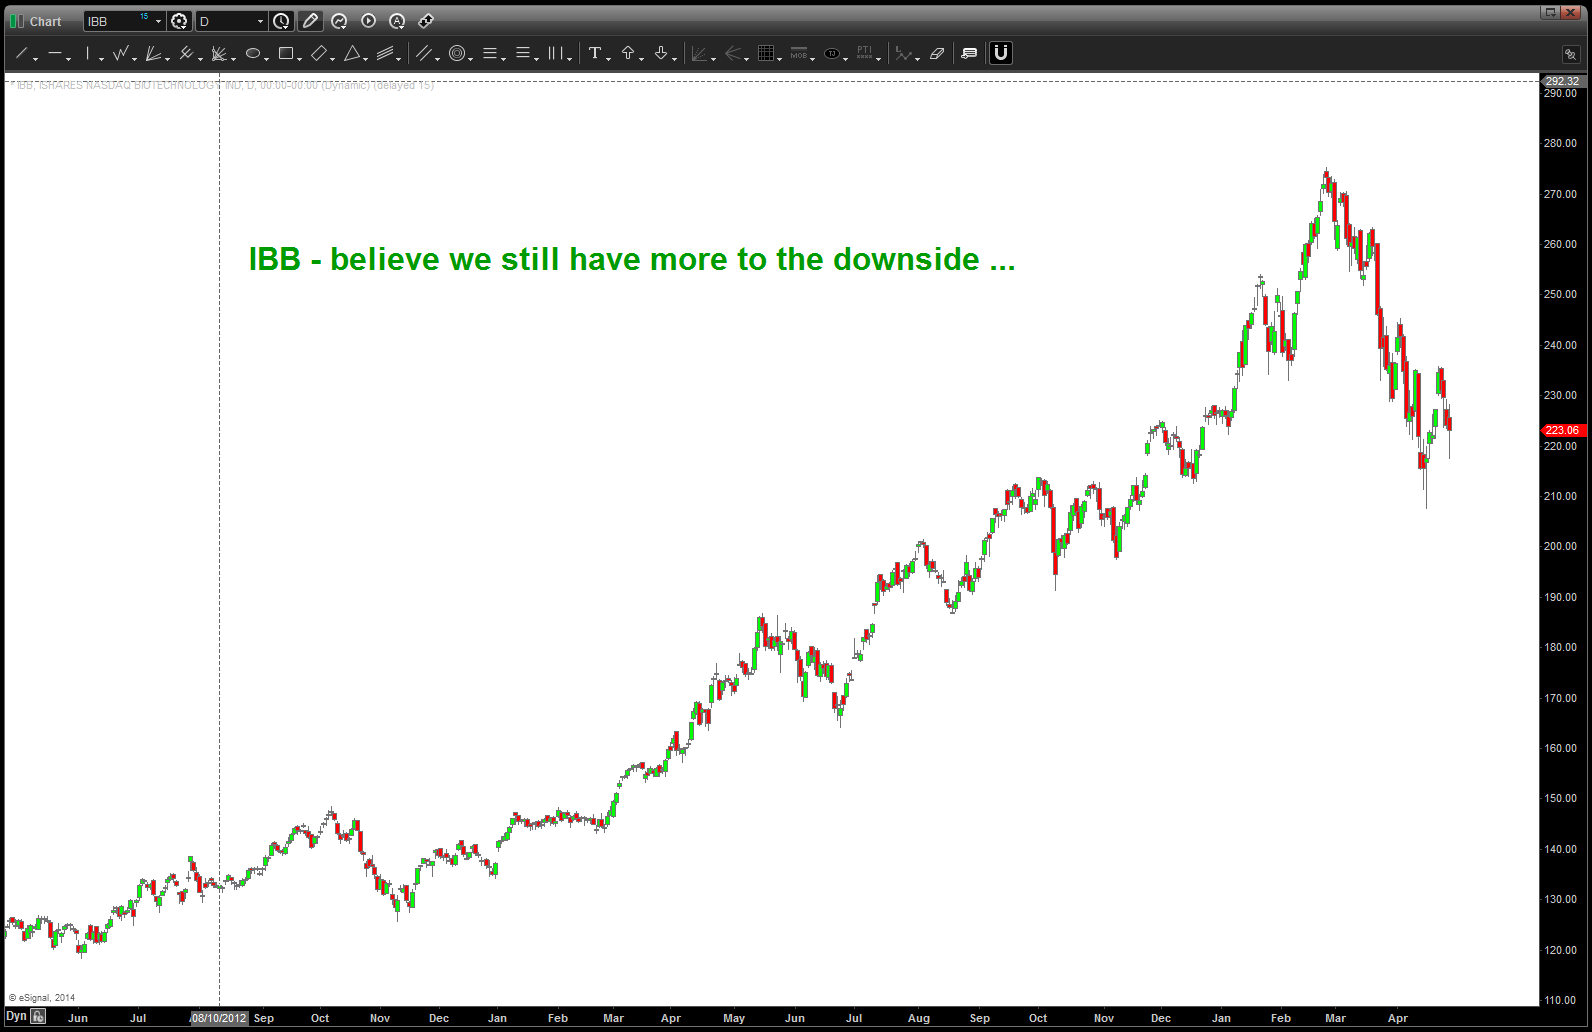
about the parabolic rise in IBB
Posted on April 28, 2014 Leave a Comment
IBB: https://bartscharts.com/2014/02/23/another-chart-biotech-ibb-w-a-parabolic-rise-sir-isaac-newton-is-still-yet-to-be-proven-wrong/
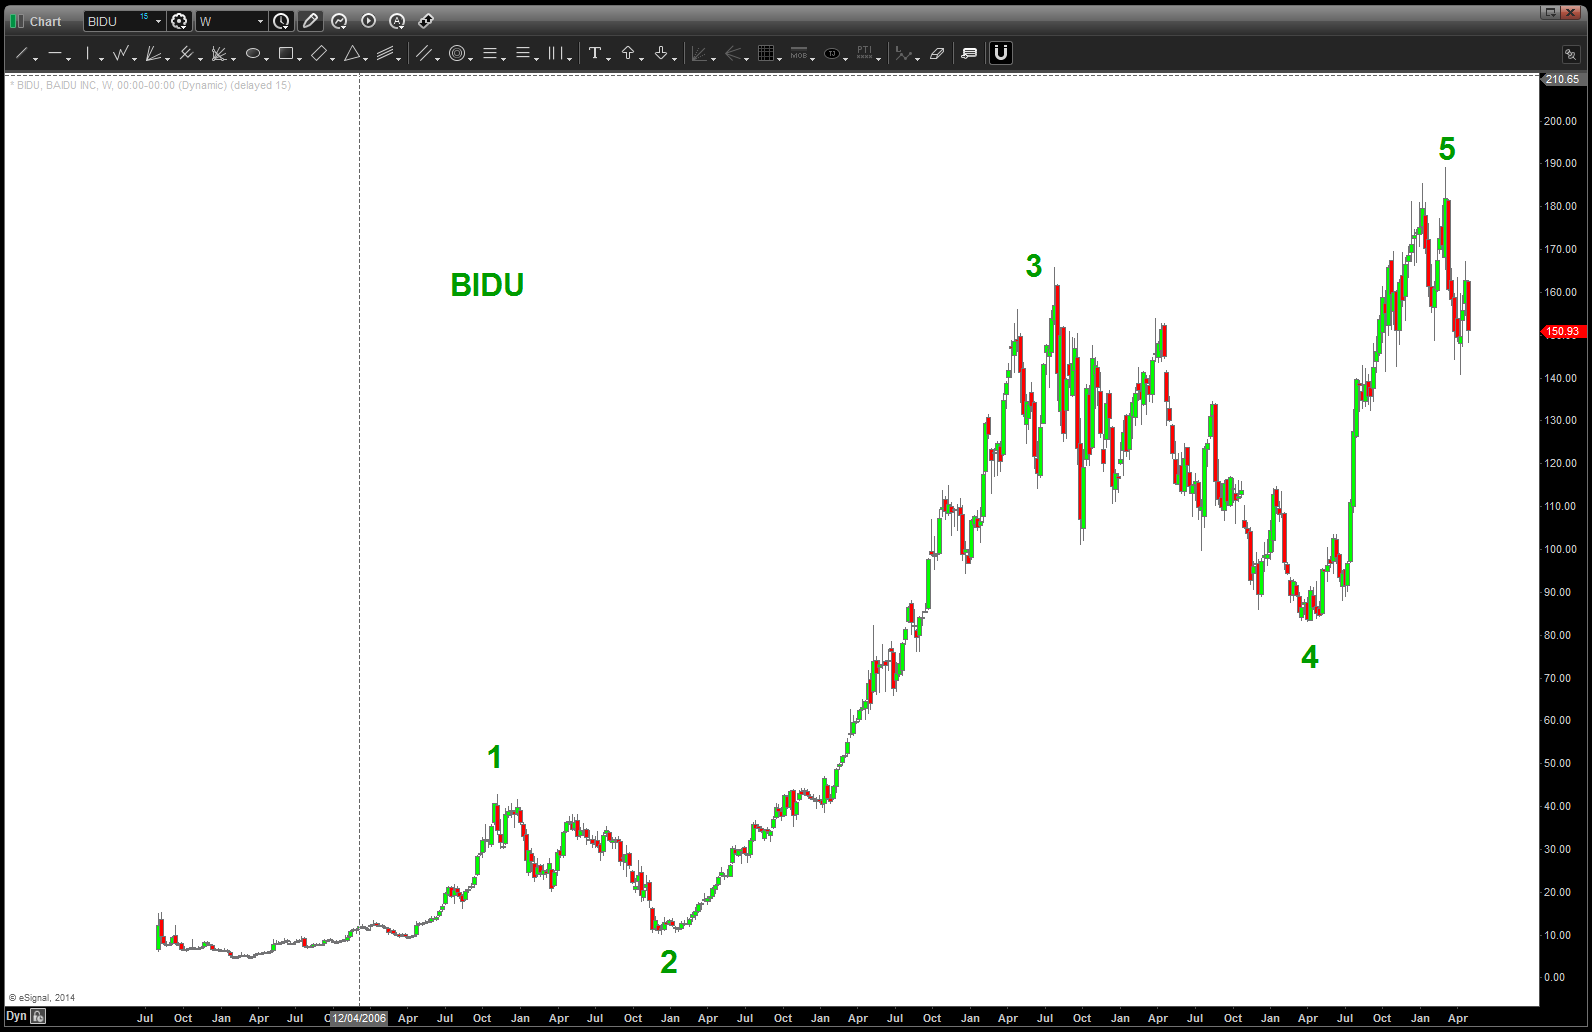
about the BIDU and CMG charts …
Posted on April 28, 2014 Leave a Comment
CMG: https://bartscharts.com/2014/03/22/chipolte/
BIDU: https://bartscharts.com/2014/03/31/bidu-follow-up/

about that LNKD chart from Sept 2013 …
Posted on April 28, 2014 1 Comment
CLIFF NOTES: short term option play expecting support to hold for the gap area 128-140. (?) Note we have gone thru the previous 4th of a larger degree….if the high was 3 at 250 then price shouldn’t go thru 122 ish as a 4th wave correction does not go below wave 1. Interesting to say the least ….post from 09/2013
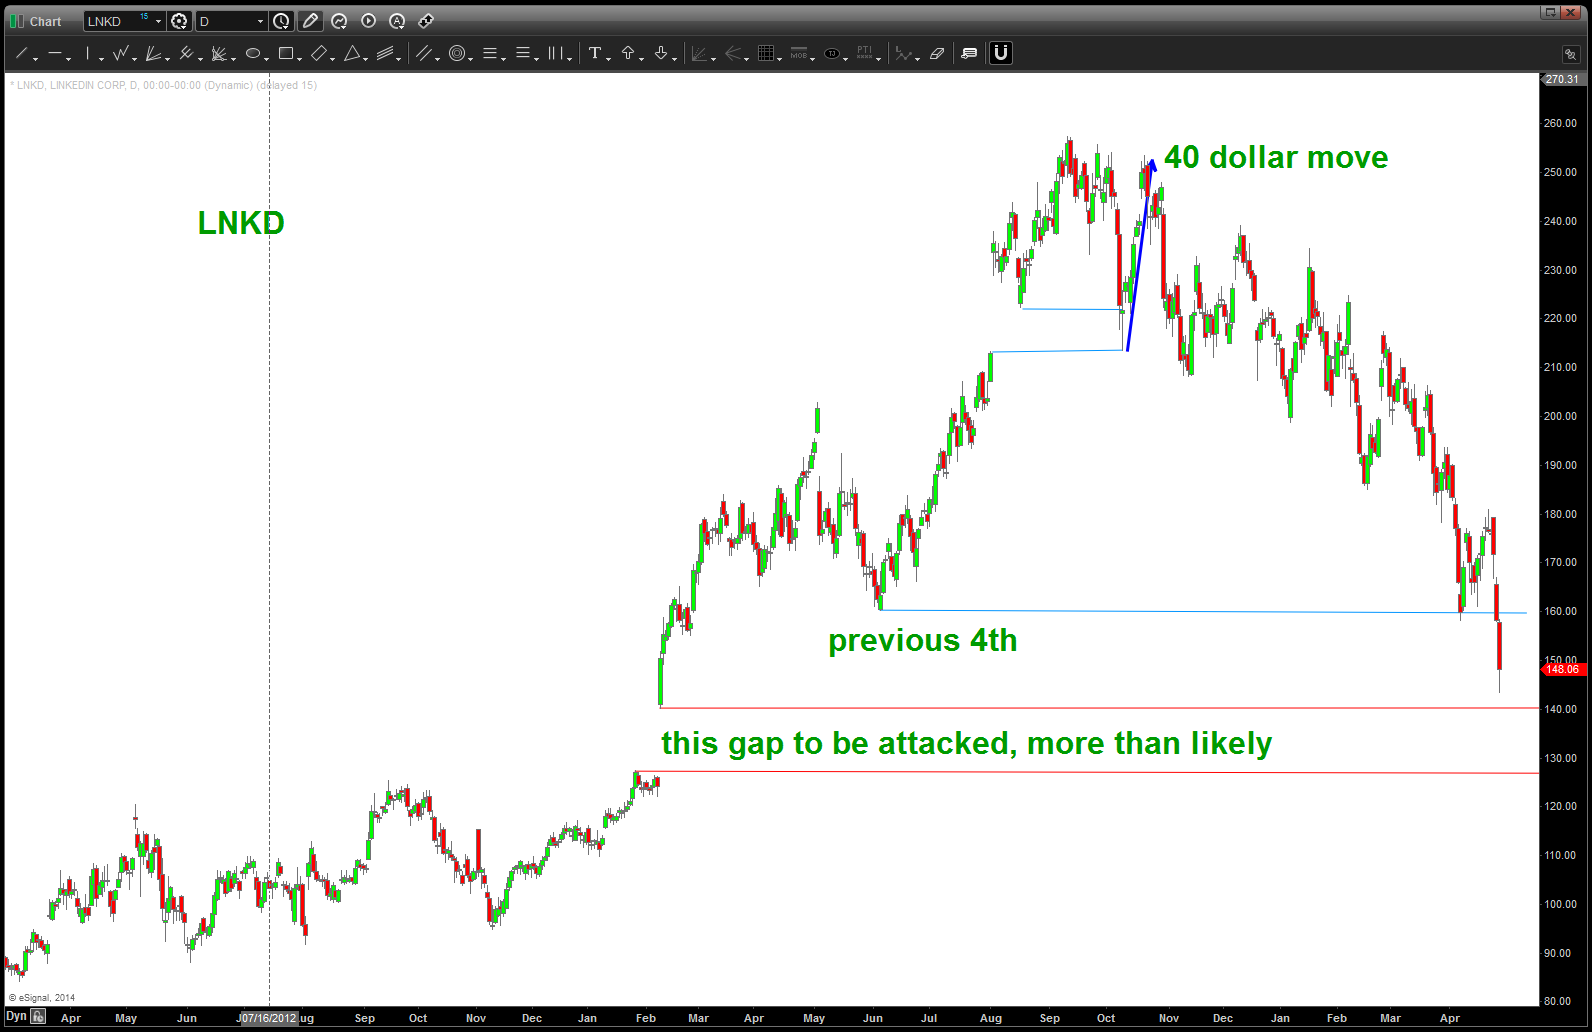
LNKD
now we don’t want to catch a falling knife as I hear that isn’t fun … however, that being said, look at the chart below. Just like we showed parabolic take offs in GOOG, IBB, PCLN, AAPL, etc we have the equal and opposite affect when something is being hammered in a liquidation phase. So, we look for “the start of the campaign” and use that as our radius and basically try to capture the move DOWN and note it’s acceleration at the 3 o’clock position. This can “usually” be a point of looking for the BOUNCE or the SUPPORT to come in and then work a lower time frame chart for the retest. Don’t recommend just blindly jumping in BUT expect the area shaded blue to hold and then try to work a pullback to get long .. certainly is looking beat up, isn’t it?
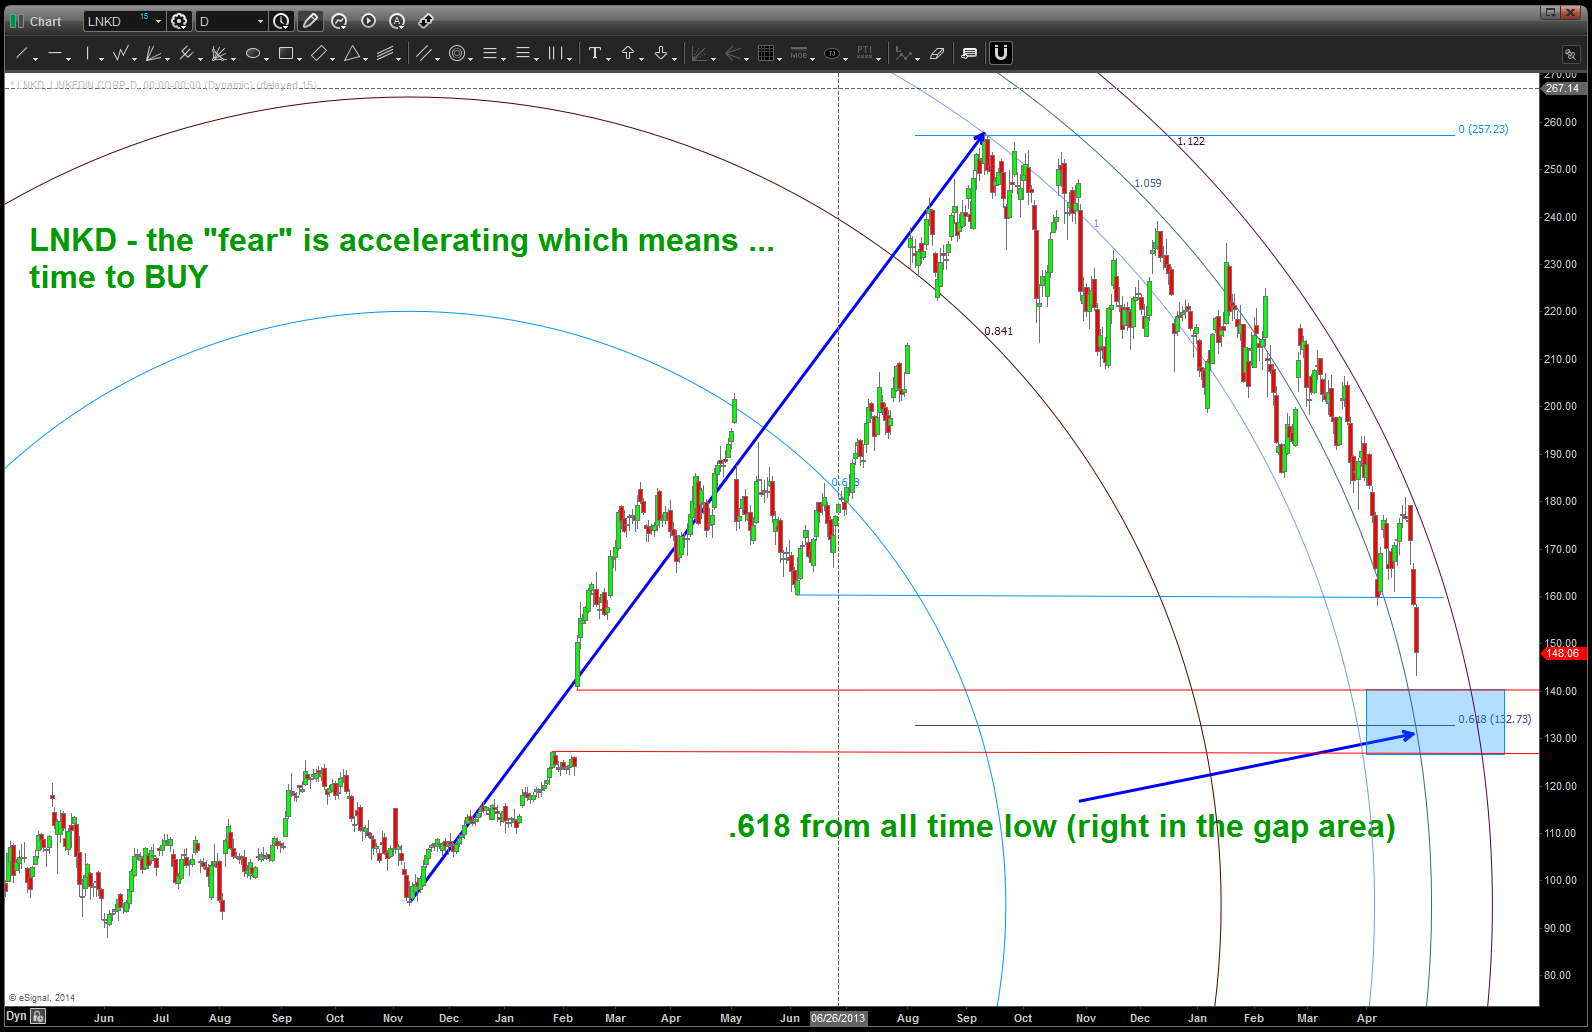
LNKD in “final” acceleration phase
about that SOCL chart …
Posted on April 28, 2014 Leave a Comment
CLIFF NOTES: expect 14-15 to maybe be support but the 5 wave sequence is complete and I consider this space done for a while …My last post on SOCL is below. Missed it by a buck:

