Chinese Yuan weakening … not what we wanted to see
From a pattern perspective there are two scenarios:
- recent up move is a B wave that will complete in/around here and then fall into area located and then up (orange sequence of arrows)
- recent down move (blue arrows) completed the a-b-c correction and the dollar is going UP against the Yuan.
- note: when the candles go UP it’s Chinese Yuan weakness and when the candles go DOWN it’s Yuan strength
- summary: we spent some time last night showing the FXI (China) and Copper correlation .. any chance that the PBOC has a crystal ball w/ regards to their stock market, horrific credit and real estate bubbles?
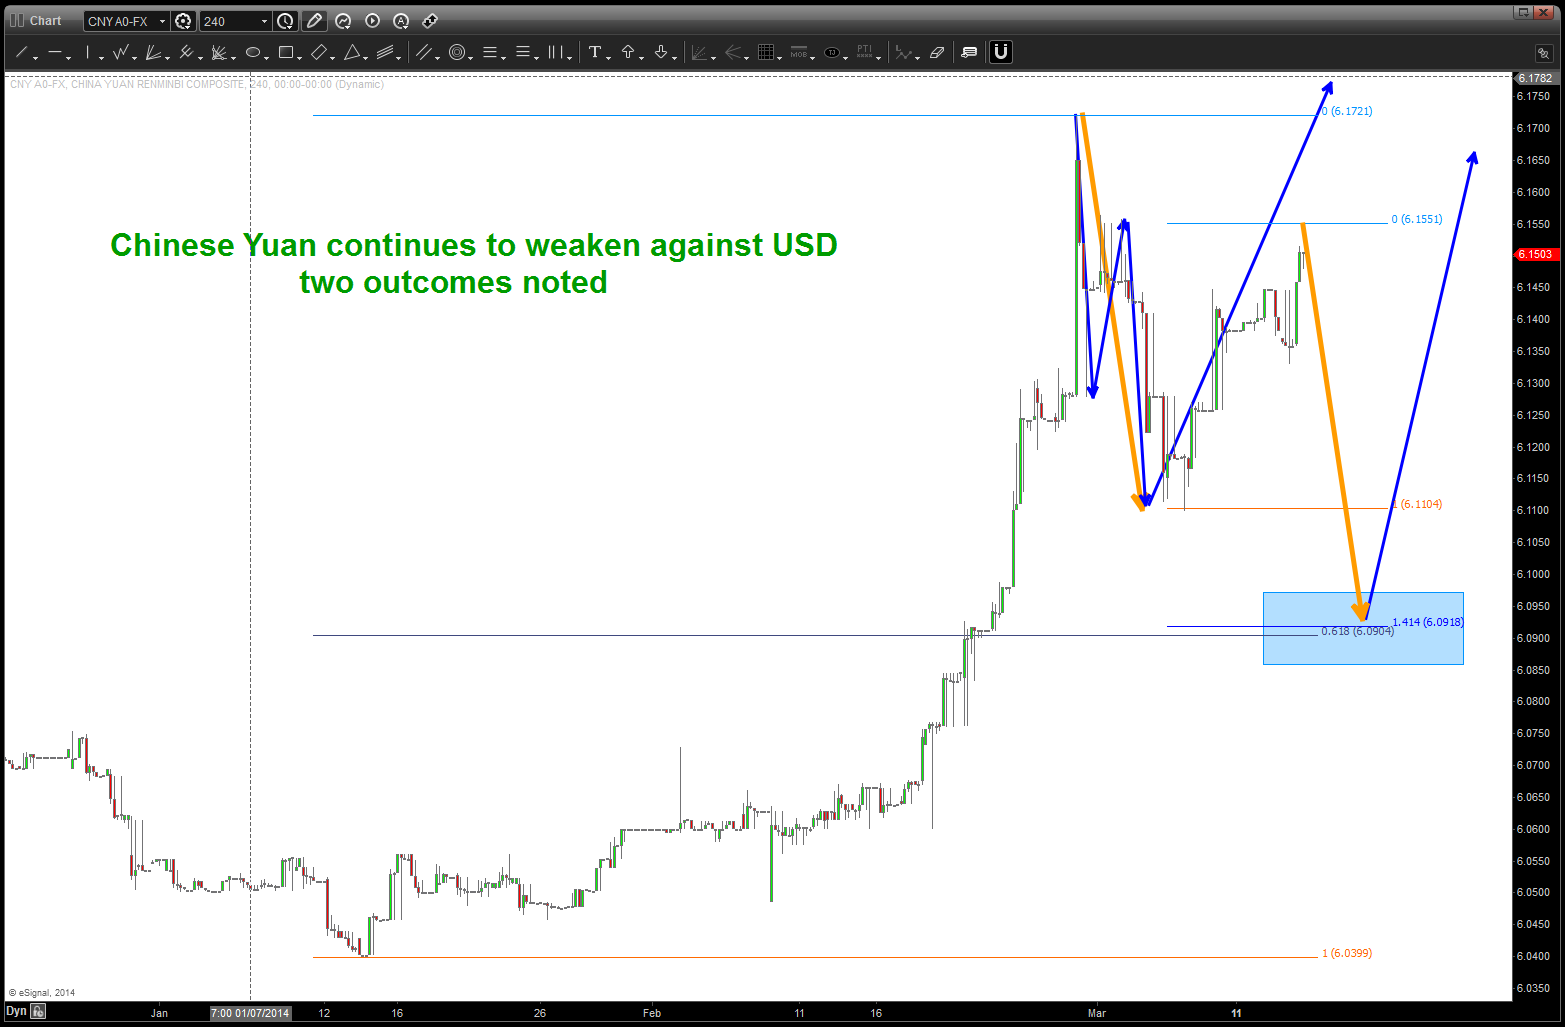
Chinese Yuan continuing to strengthen? two possible scenarios shown
