IWM … read this post to get your mind blown … if you want
last post on IWM: https://atomic-temporary-44460632.wpcomstaging.com/2021/08/30/iwm-and-another-upcoming-chat-w-jc/
holy smokes .. the underlying BULL market that we have right now is pretty amazing …
I went on to chat w/ JC of @allstarcharts.com a couple months ago and we talked a LOT about IWM. we went over the MATH of why it stopped where it did and, folks, the math on multiple time frames and multiple techniques was PERFECT. he still hasn’t “published” our podcast – maybe because he knew it was going to break out? 🙂 who knows …he’s a lot smarter than I am but still a GREAT dude. follow him peeps!
and guess what ..IWM pattern, it wasn’t WRONG but it certainly wasn’tRIGHT.
BOOM- we broke out today so guess what? I have to get my eraser out and start over and, unfortunately, that’s happened many many times. 🙂 why should I be surprised? well, keep reading.
the market went up to our target area and hit in/around 233. as we describe above, in an irrationally exuberant bull market, WAIT for the SRC and the signal reversal candle was finally hit the week of my birthday (note a fun fact – the HIGH on crude oil hit on my birthday 7/11 – shown below- synchronicity?)
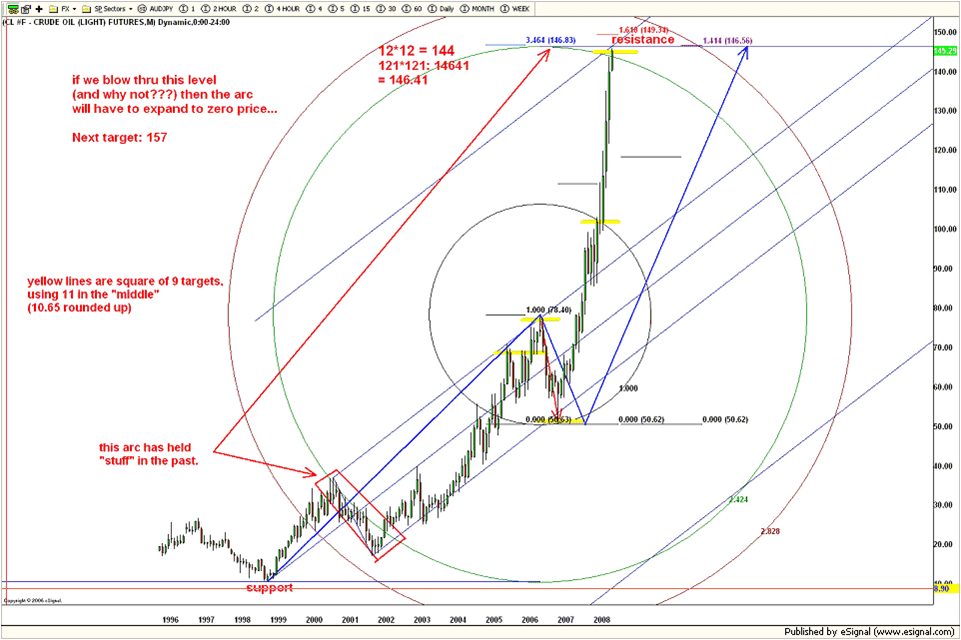
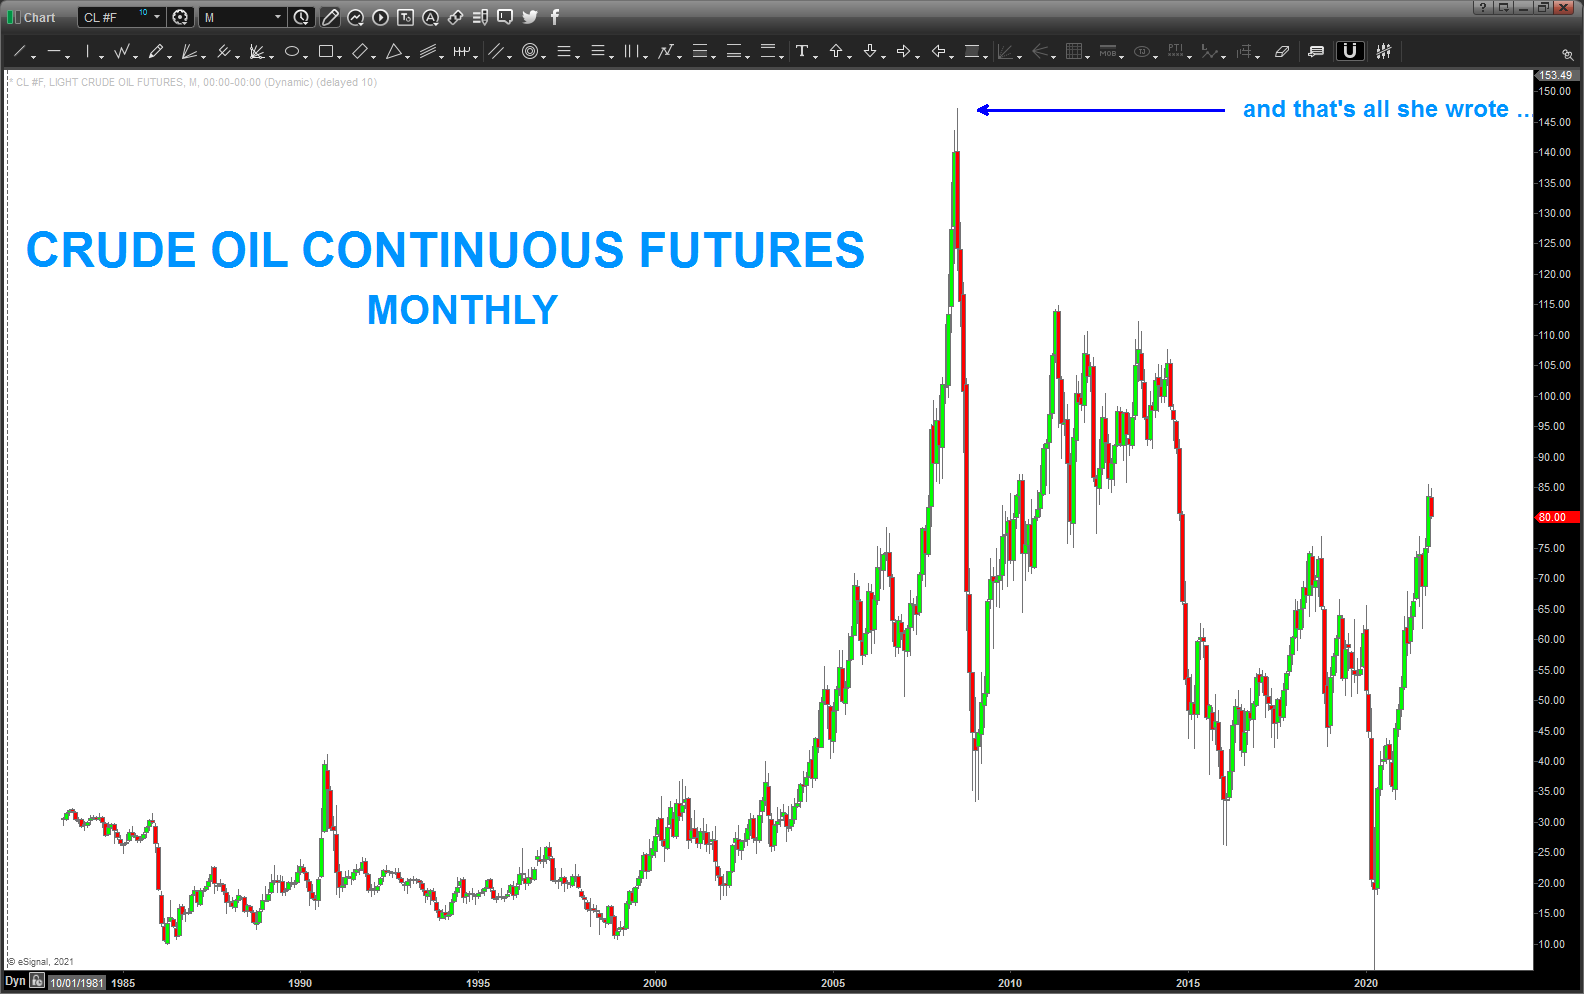
I show the Crude because of my birthday but also because of the PROBABILITY of what can and can’t happen when a TON of math comes together.
folks, MORE math came together (see the last post linked at the top) on IWM .. so only being human I EXPECTED it to dump and the rest of the market to, well, at least follow along … ? unreasonable?
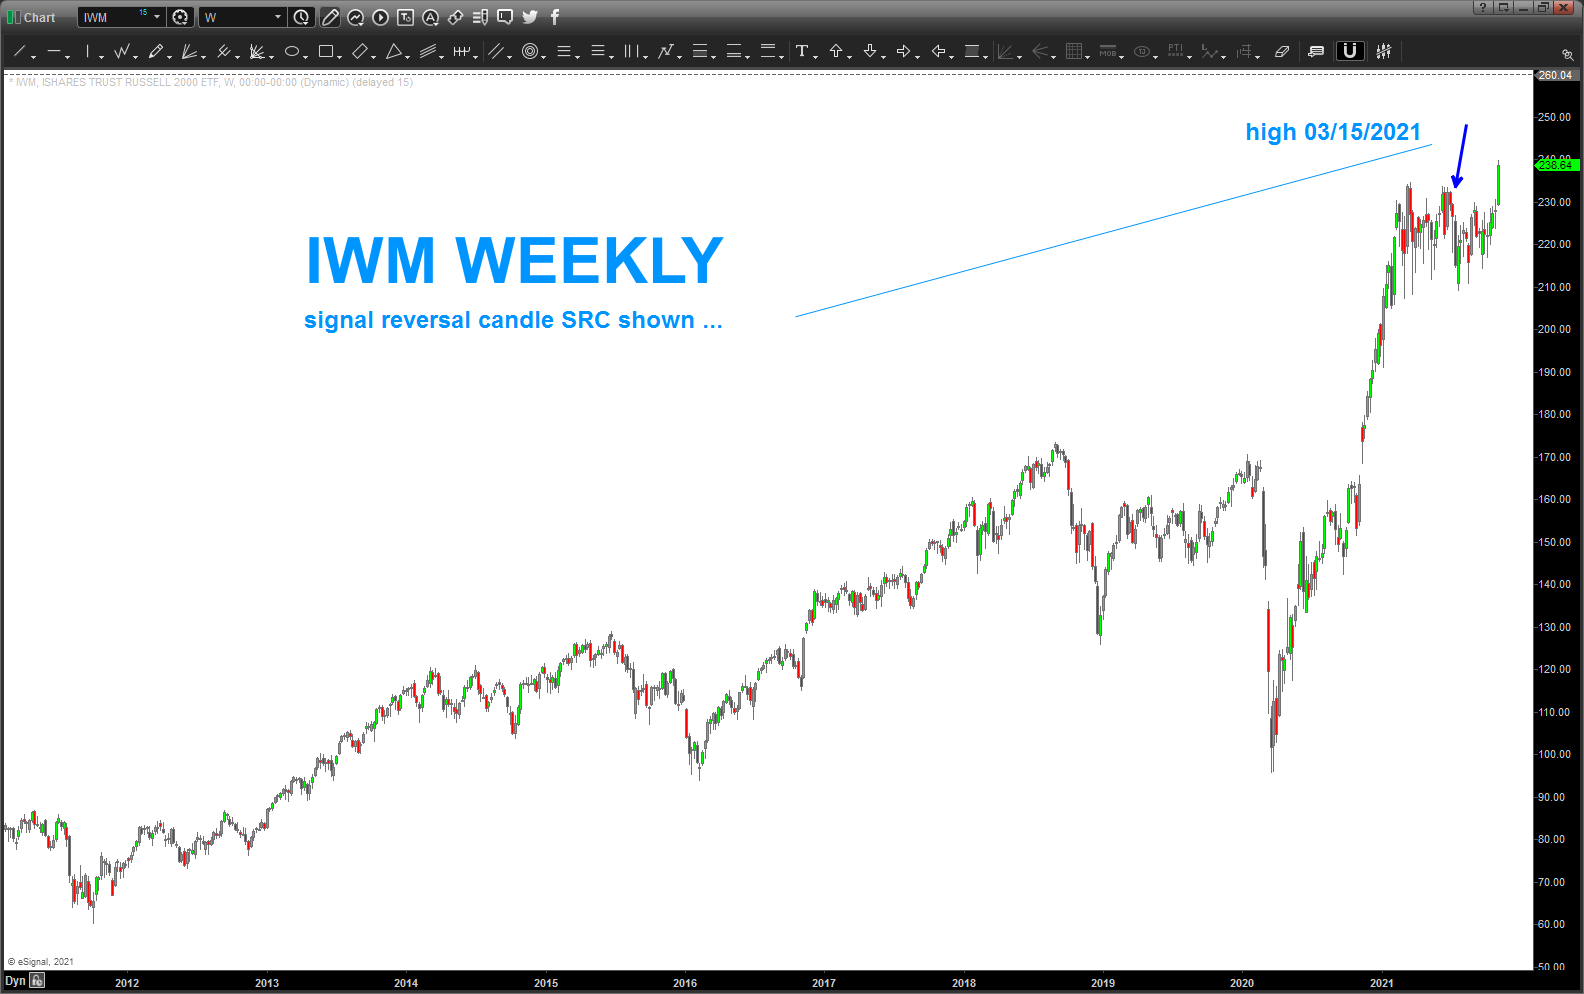
well there it sat … and sat … and then an SRC
Here is the SRC for IWM:
more than likely, a short would have been initiated and we would have been stopped out ….
end of story – right? well from a P+L perspective, yes. folks that is ALL that matters.
from a form and harmony and balance perspective this IWM continues to amaze me.
please see the chart below:
if you have been reading the blog you know we had been targeting this price zone for a while and when it hit you know I (most of the time) say WAIT for a signal reversal candle because it’s probability – right? of course … so sometimes the pattern will act as support or resistance (this is what IWM did for 233 days but ultimately it failed.) and sometimes it will work and inflect to your favor or it EXPLODES continuing the trend … it’s all probability. but I think I’ve shown that “stuff” happens around the patterns – fair enough?
what’s key for me, even though we are dealing w/ probability, is I KNEW there is still a “beat” or “rhythm” to it … that’s why the patterns help you manage risk, right?
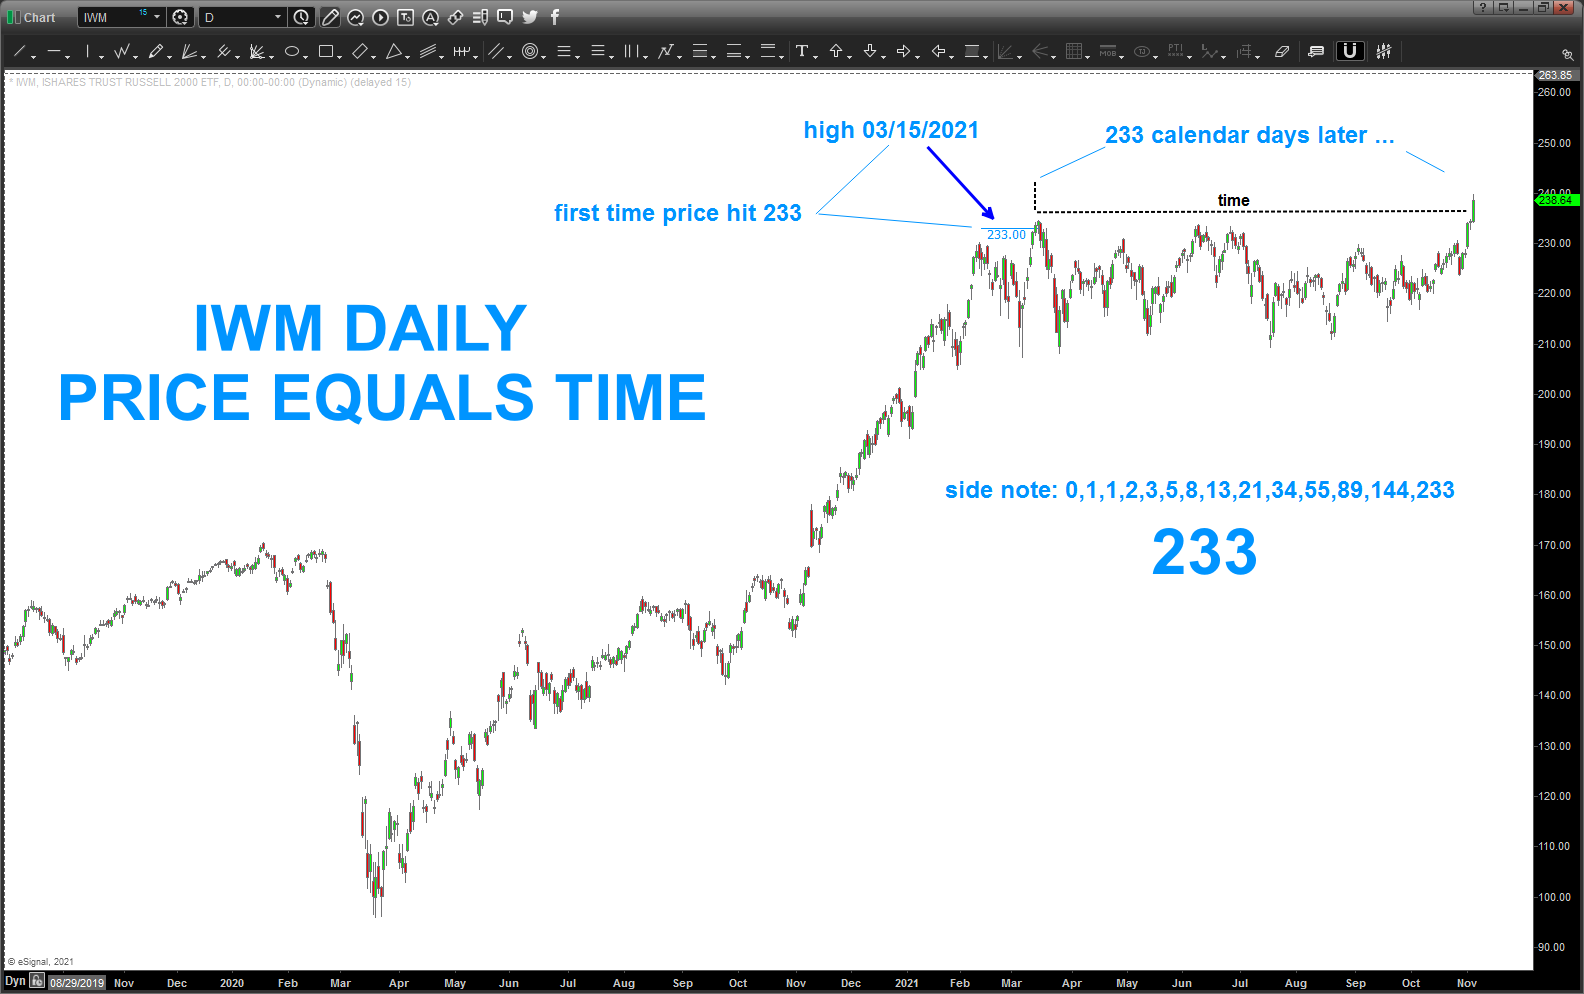
so, at the end of the day today, I saw that the market was up again and I thought … “I bet (no kidding, I KNEW this was the case in my gut) we made the PRICE high the same many days (TIME) ago … “
there you have it above … 233 calendar days ago the price HIGH was hit and is it any coincidence that we BROKE OUT when PRICE equals TIME? NO – that is how it works. our job is to figure out what the key master has in store for us regarding the harmony and balance of what we are dealing with … it’s all based on math and music but it’s also a multi dimensional chess game …
why would I type that last sentence?
well, 233 is a Fibonacci number as shown on the chart above … the Architect, what a sense of humor she has ….
Bart
