The Markets – March 24, 2024
The NYSE Index HIT the square out at 18, 059 and reacted very very minimally (which surprised me to be honest) and is walking up the wall of worry. Today that level is at 18,070.
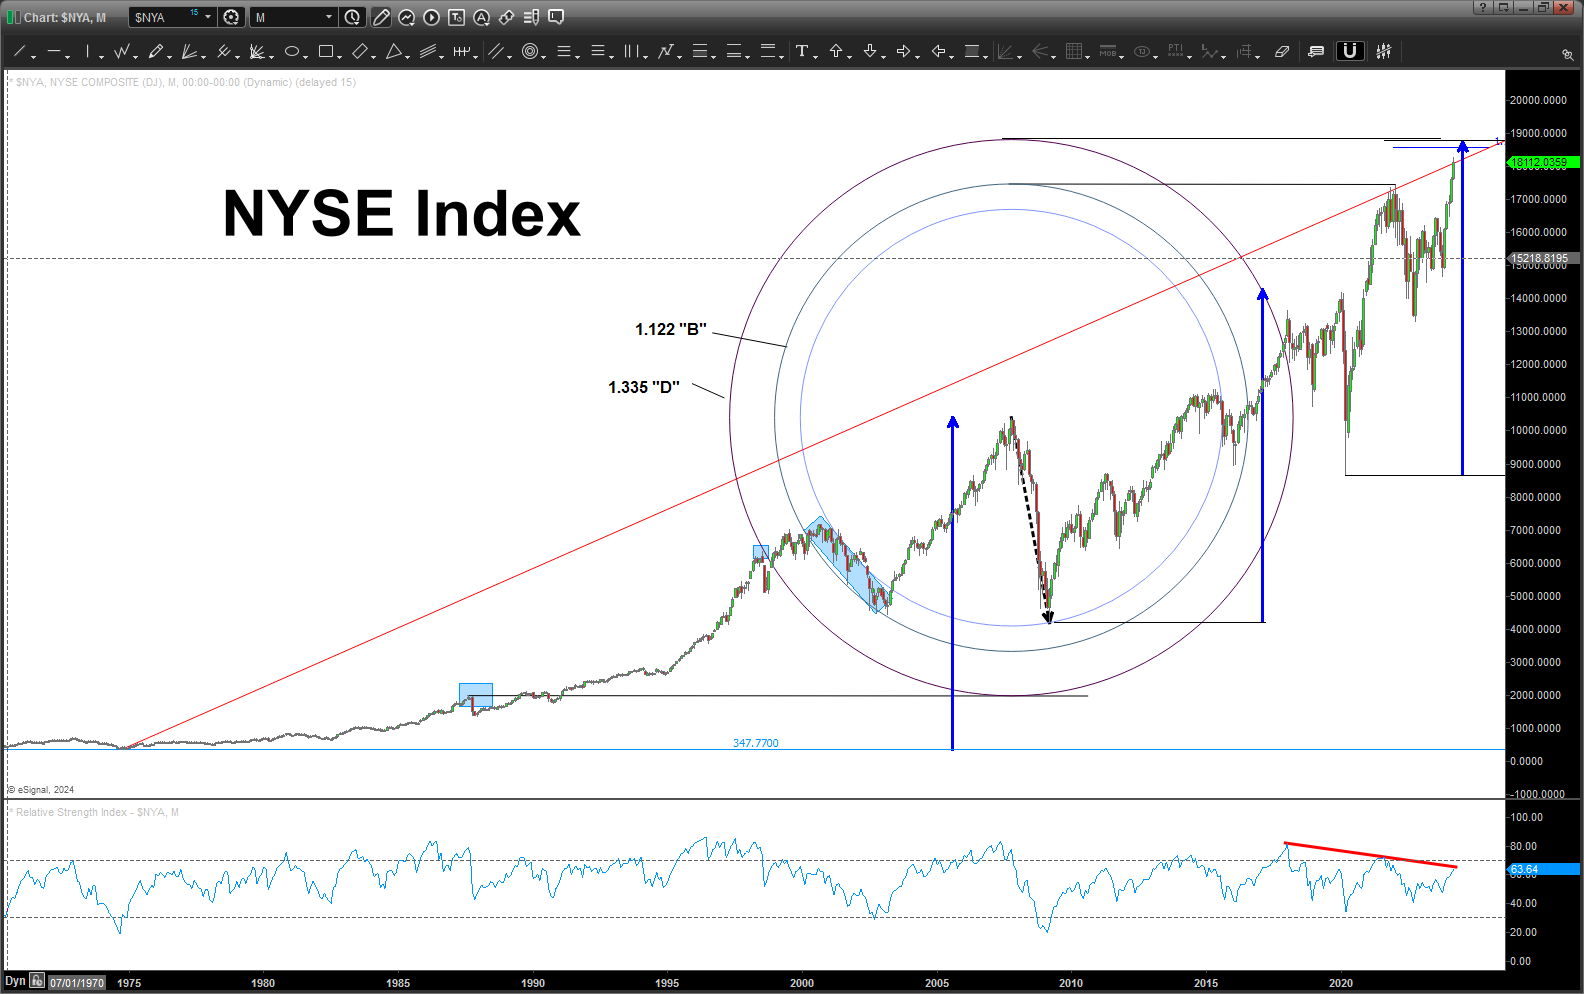
As you can see above, we have not CLOSED ABOVE the 1:1 trend line from the all time low and I suspect that it will continue to provide MAJOR resistance BUT as it happened last week, it can keep squaring itself out until it reaches the ‘final’ square out. As long as we do not get a close above (monthly) the 1:1 trend line this market remains vulnerable (very ?) to a pullback that could last, at a minimum, a couple months.
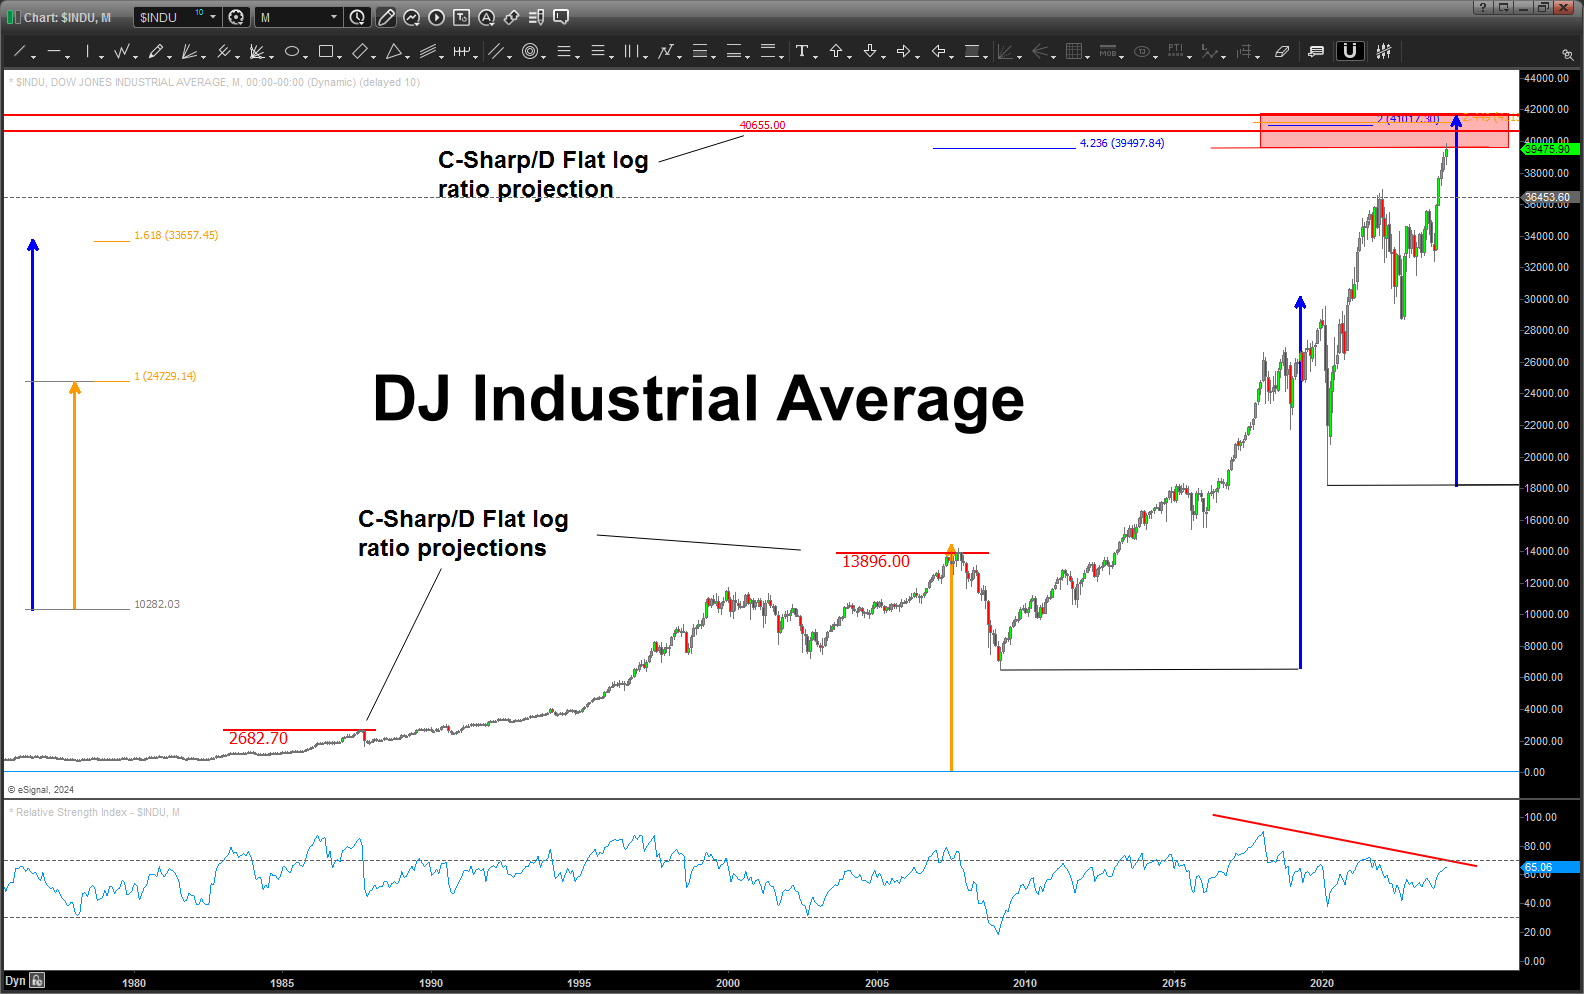
Here’s the DJIA approaching or hit an area of MAJOR resistance.
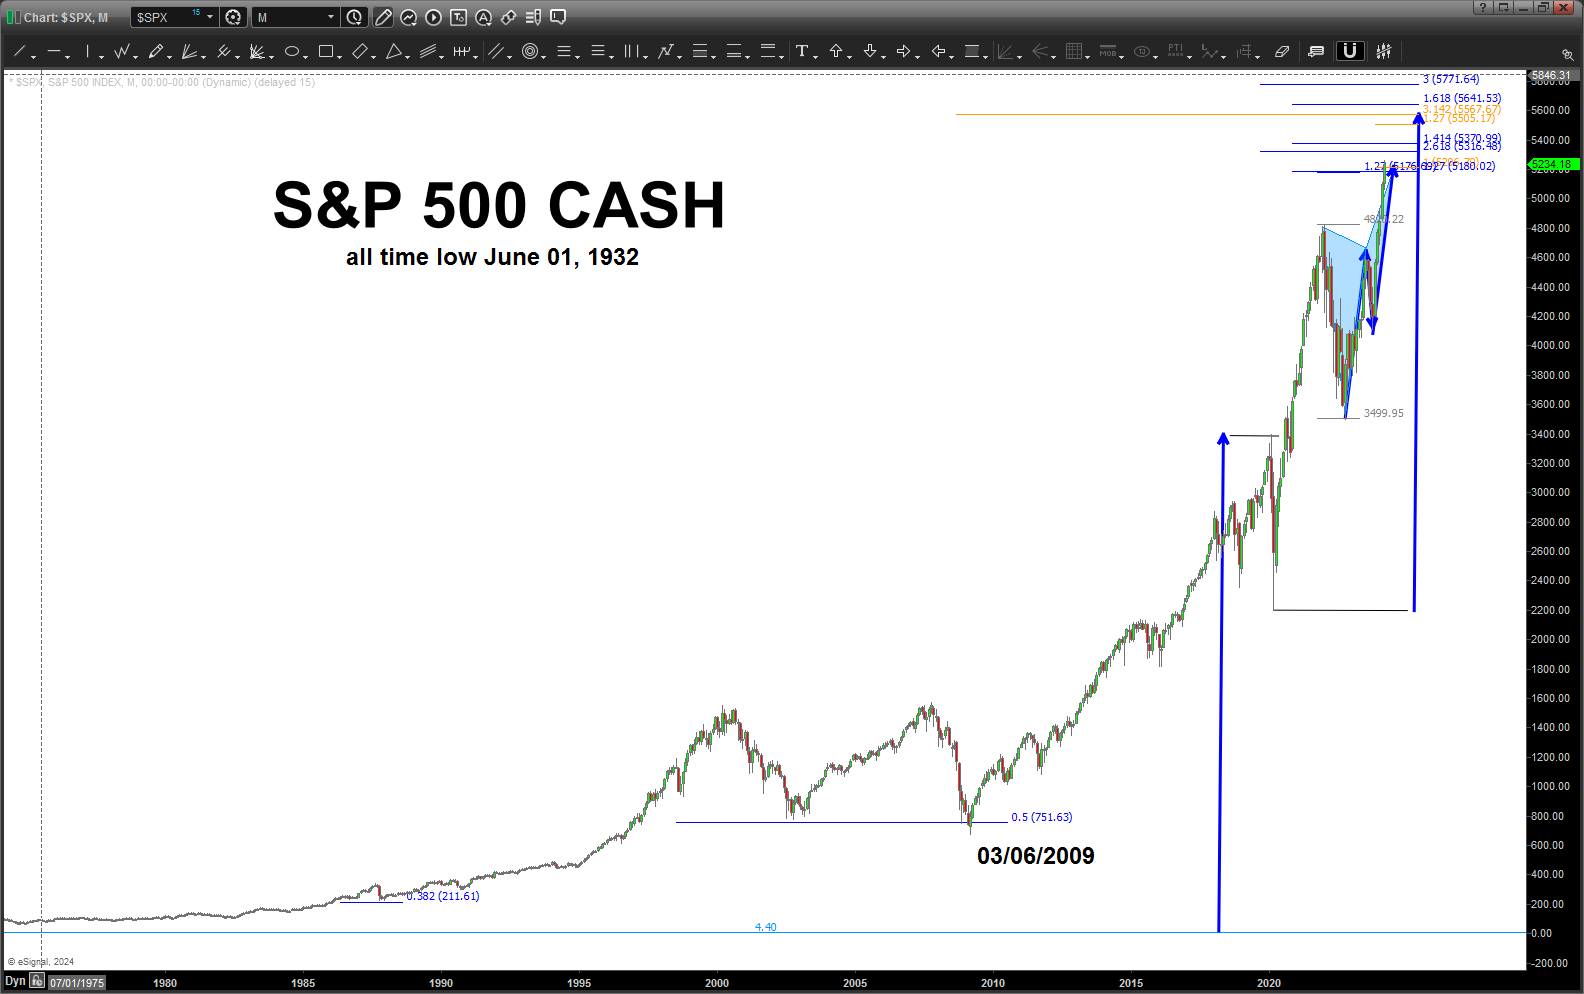
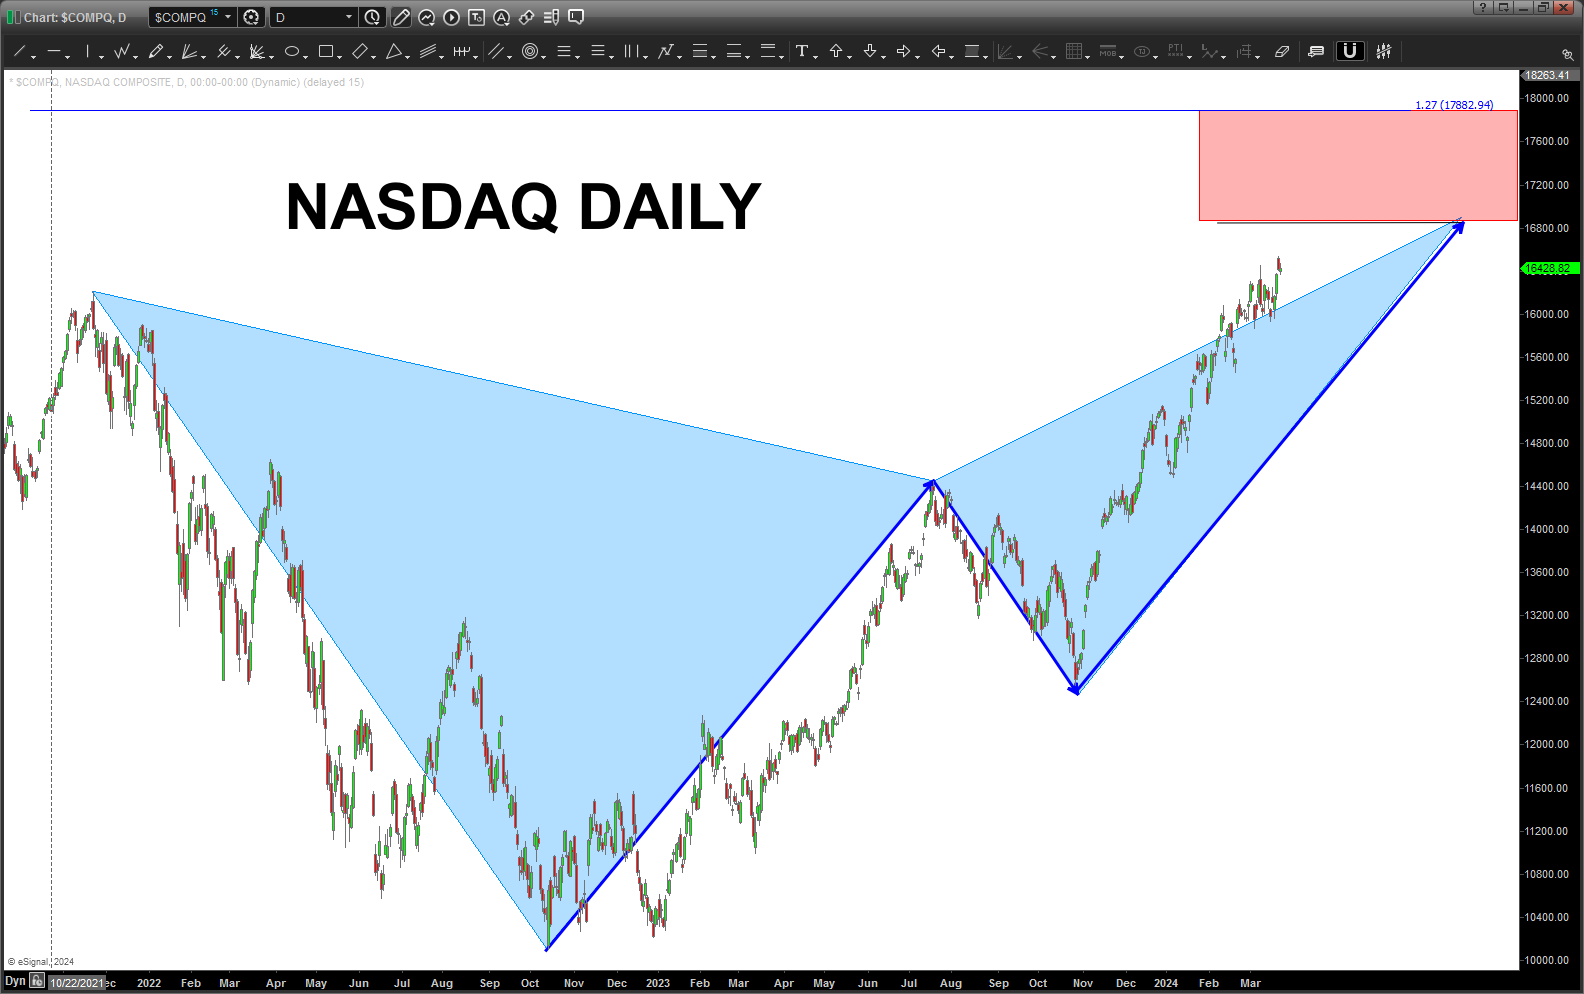
Same story w/ the S&P 500 and the NASDAQ:
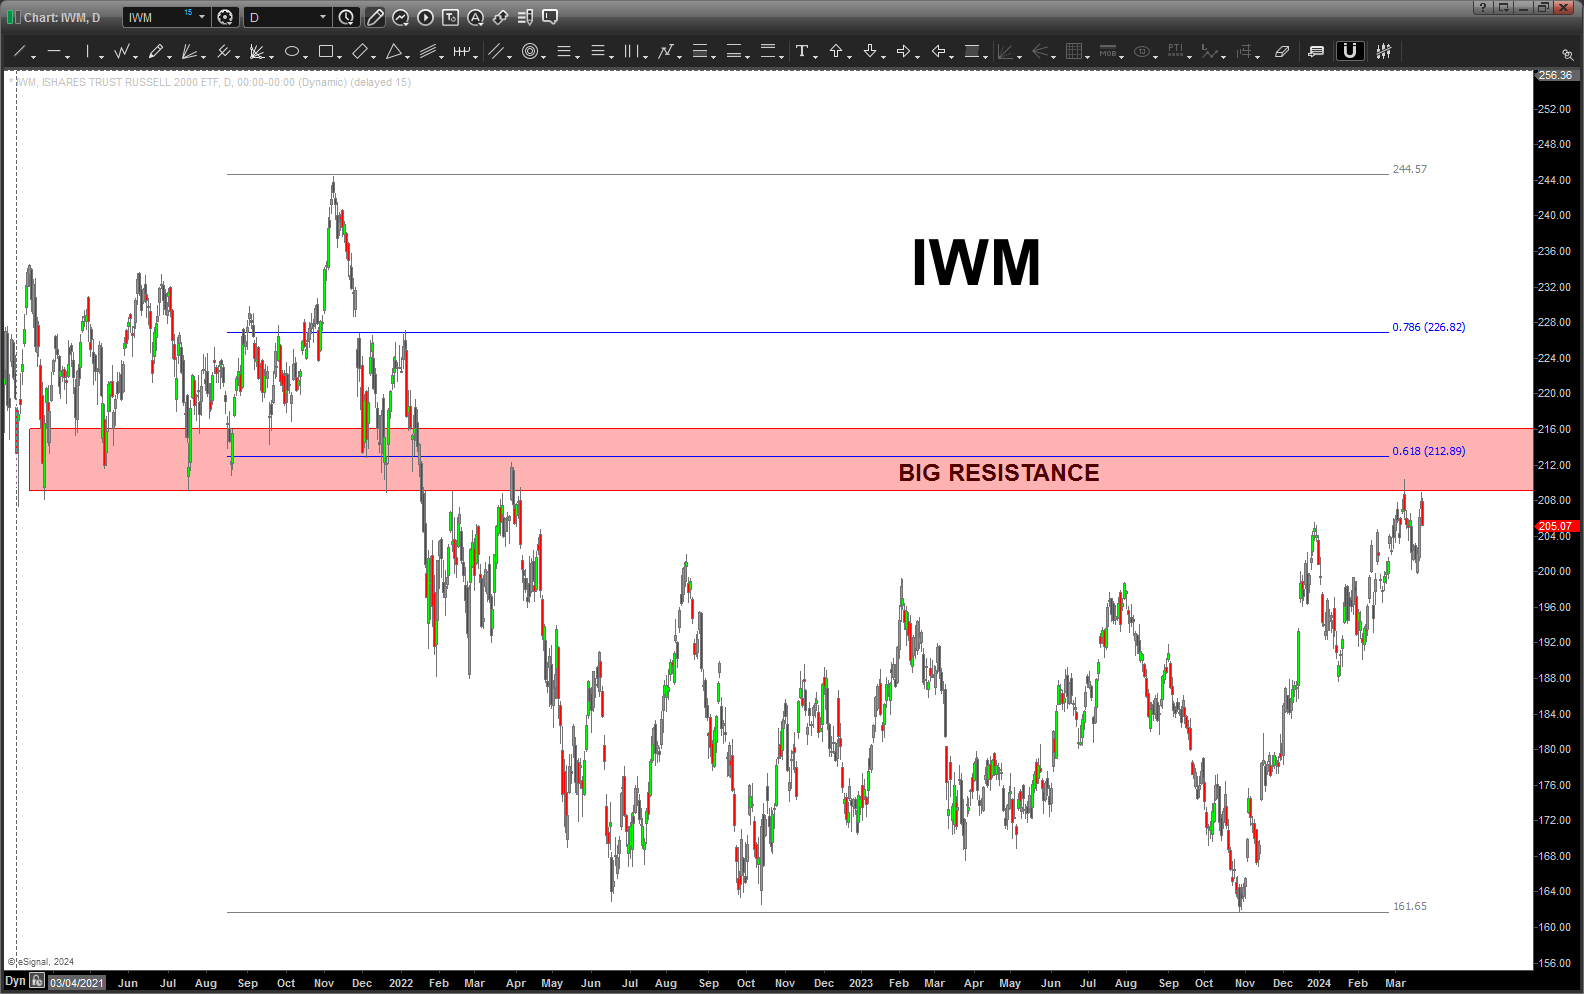
The Russell 2000 is VERY weak compared to the other indices:
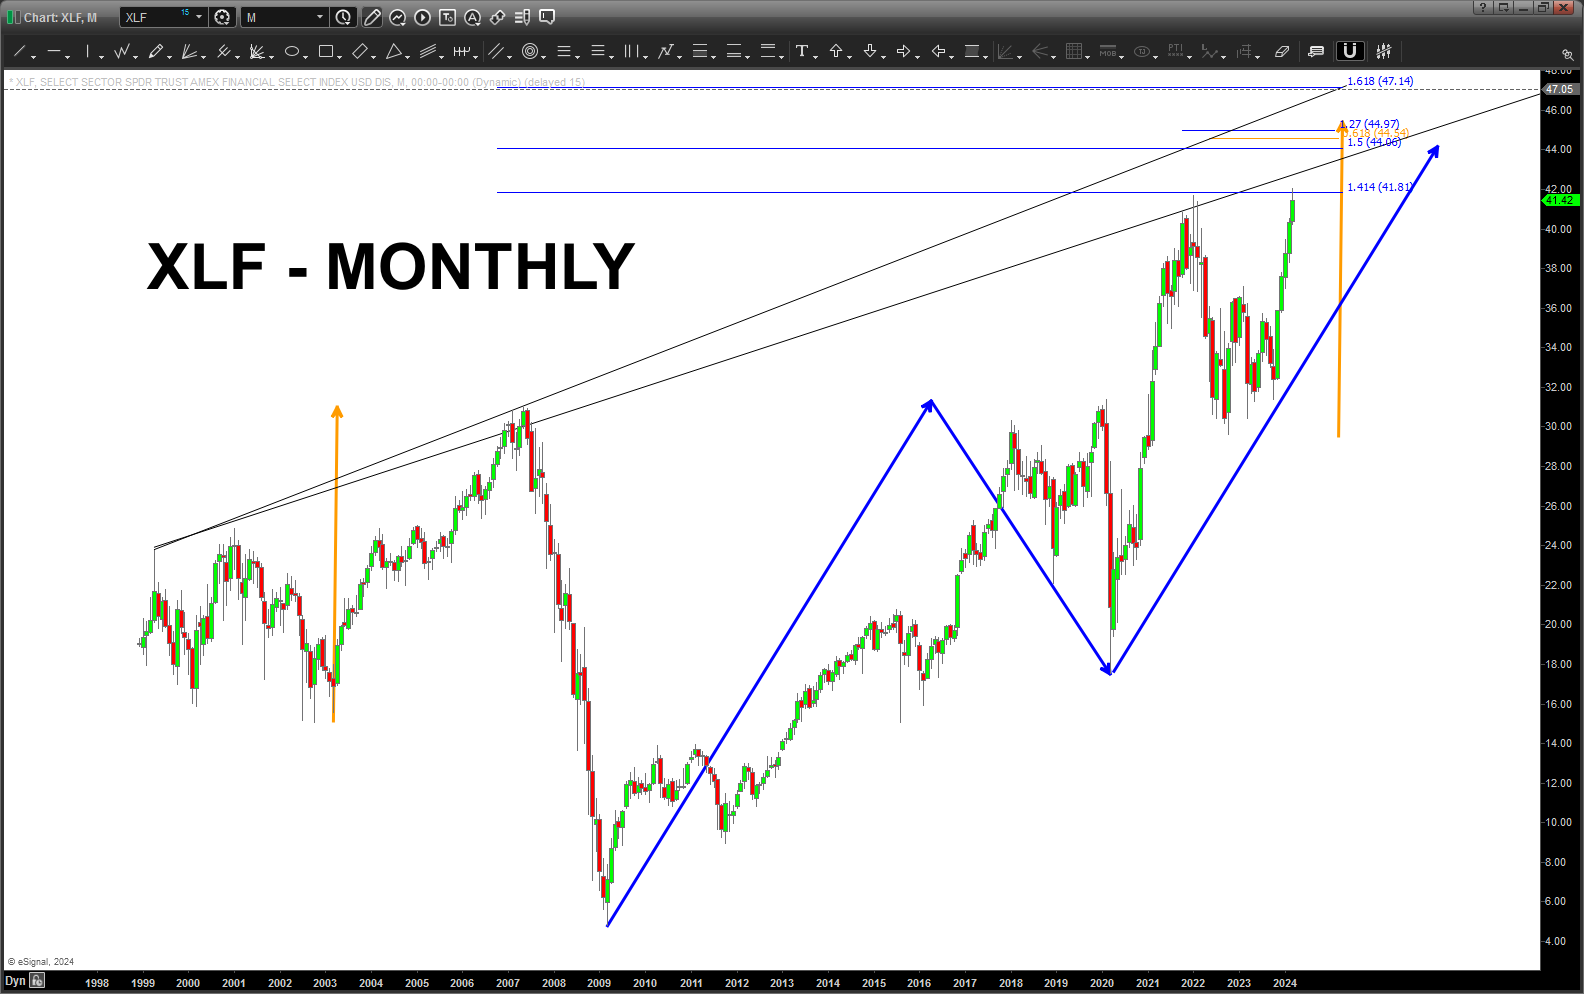
On prior posts we have focused on the Banks/Financials … the XLF has outperformed and made new highs … the overall market has followed. We are VERY close to a BIG ABCD completing on the XLF. If you remember the post on the Banks/Financials a few months ago, the XLF pattern failed and the market kept going higher.
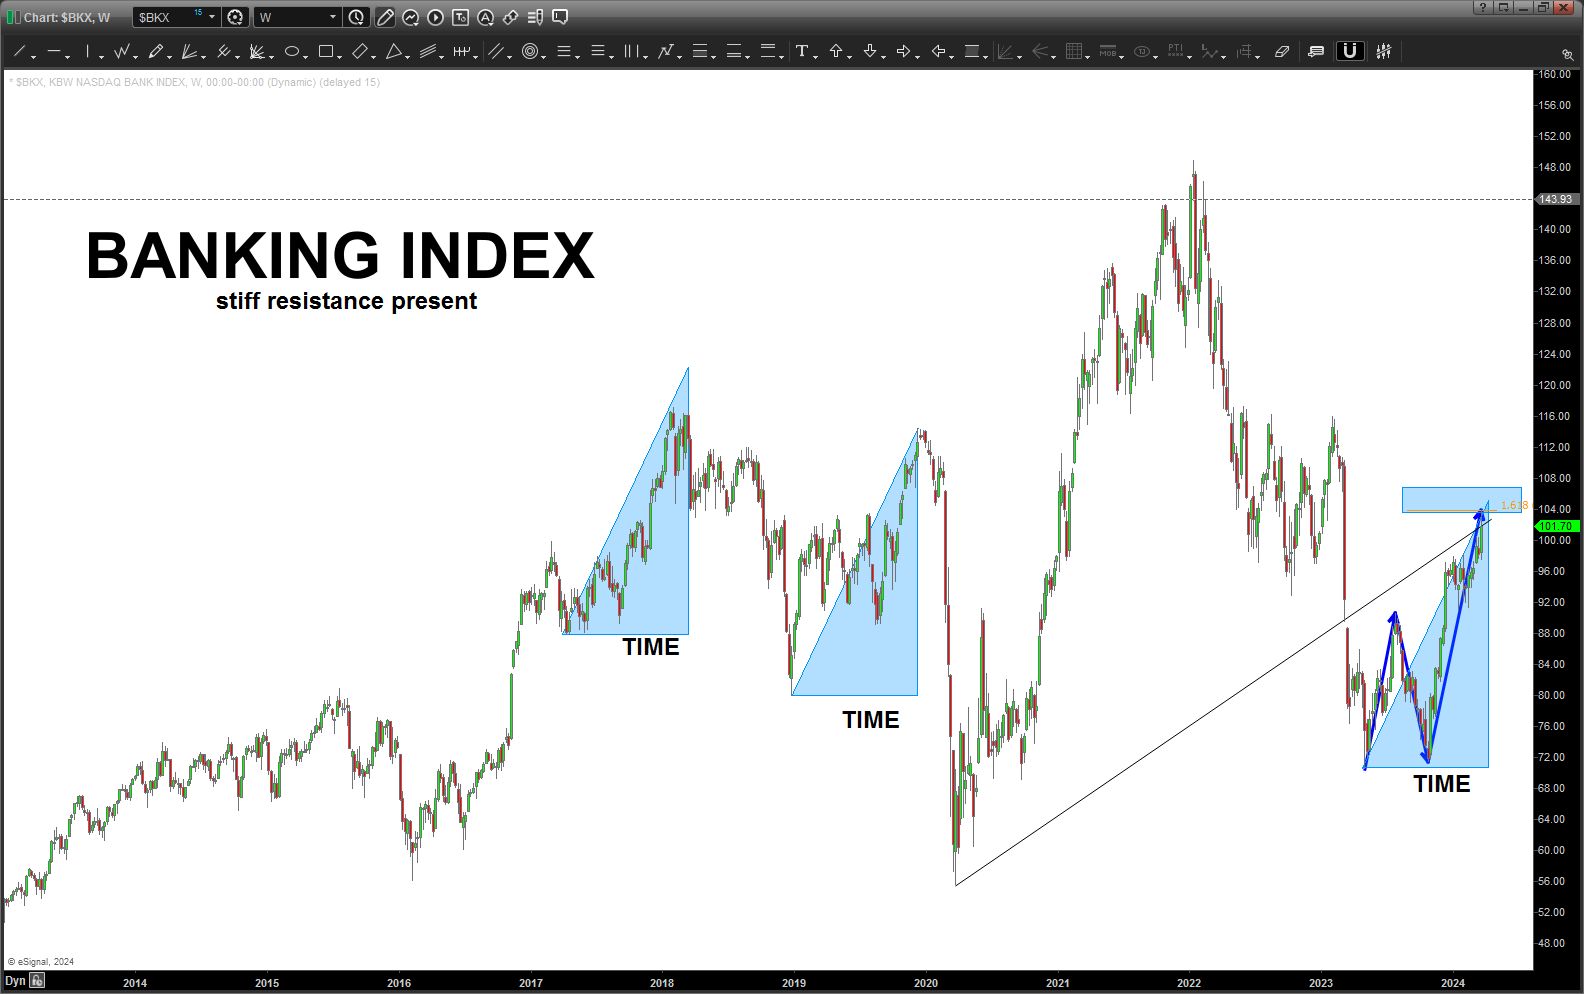
If we take a look at the Banking index (NASDAQ) you will see it has been lagging badly compared to the overall general market. REAL leadership in the Banks/Financials would have this MUCH higher.
Sure looks like a zig-zag correction and 1.68AB=CD was hit Friday.
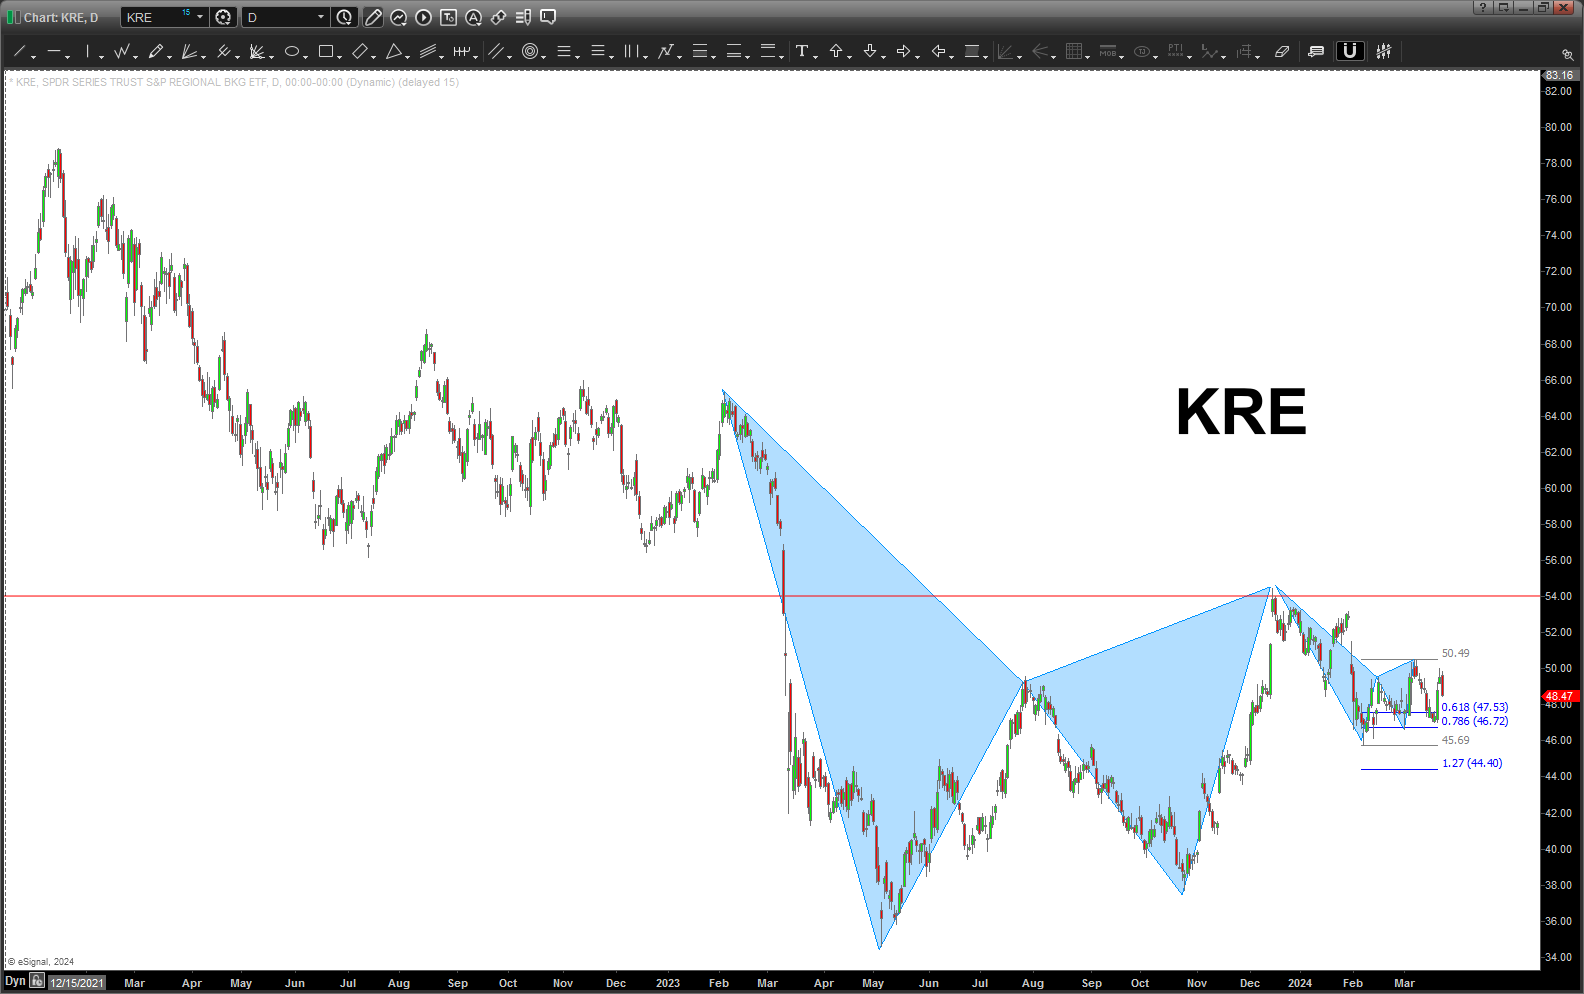
Where are you Mr. KRE?
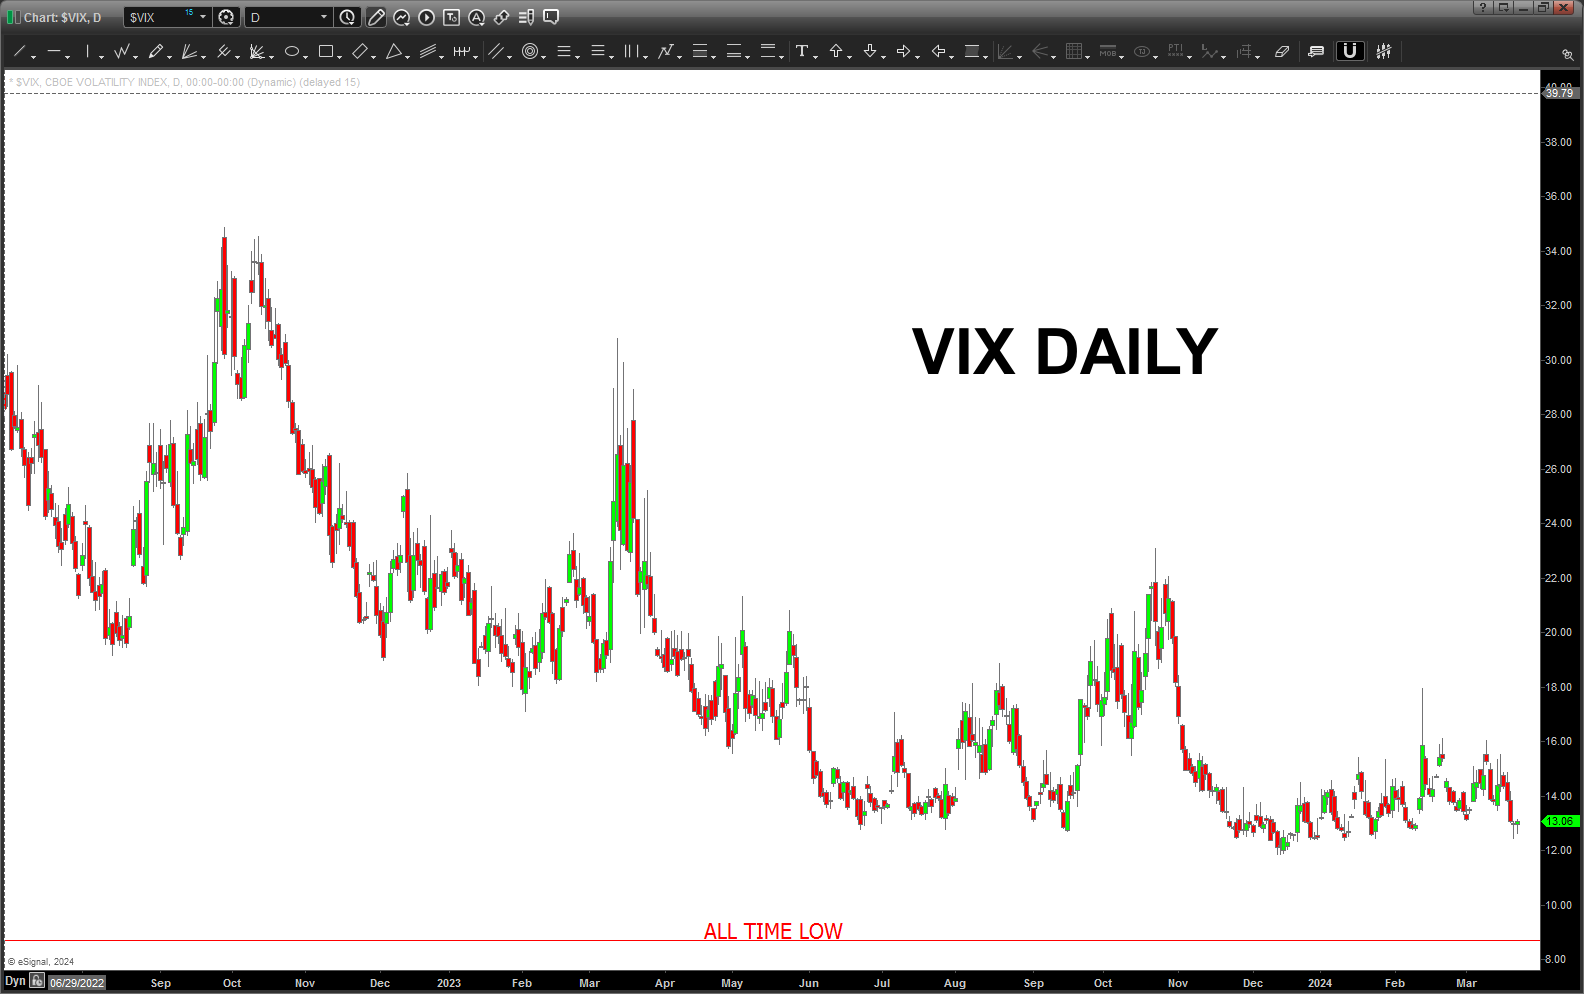
The VIX is/has been flirting w/ going single digits but, it’s been LOW for a very very long time. There is NO FEAR in the market right now.
The sentiment/ fear-greed/bullishness is at MAX levels … NOBODY is bearish.
I was on my good friend Larry’s show and we were discussing he unrelenting advance present. He mentioned, in some weekend mail traffic that the last week on WED-THS there was the HUGE rallly of over 1o0 handles in the S&P500 while awaiting the FED’s decision/action. On both of those days the cumlative net open interest dropped.
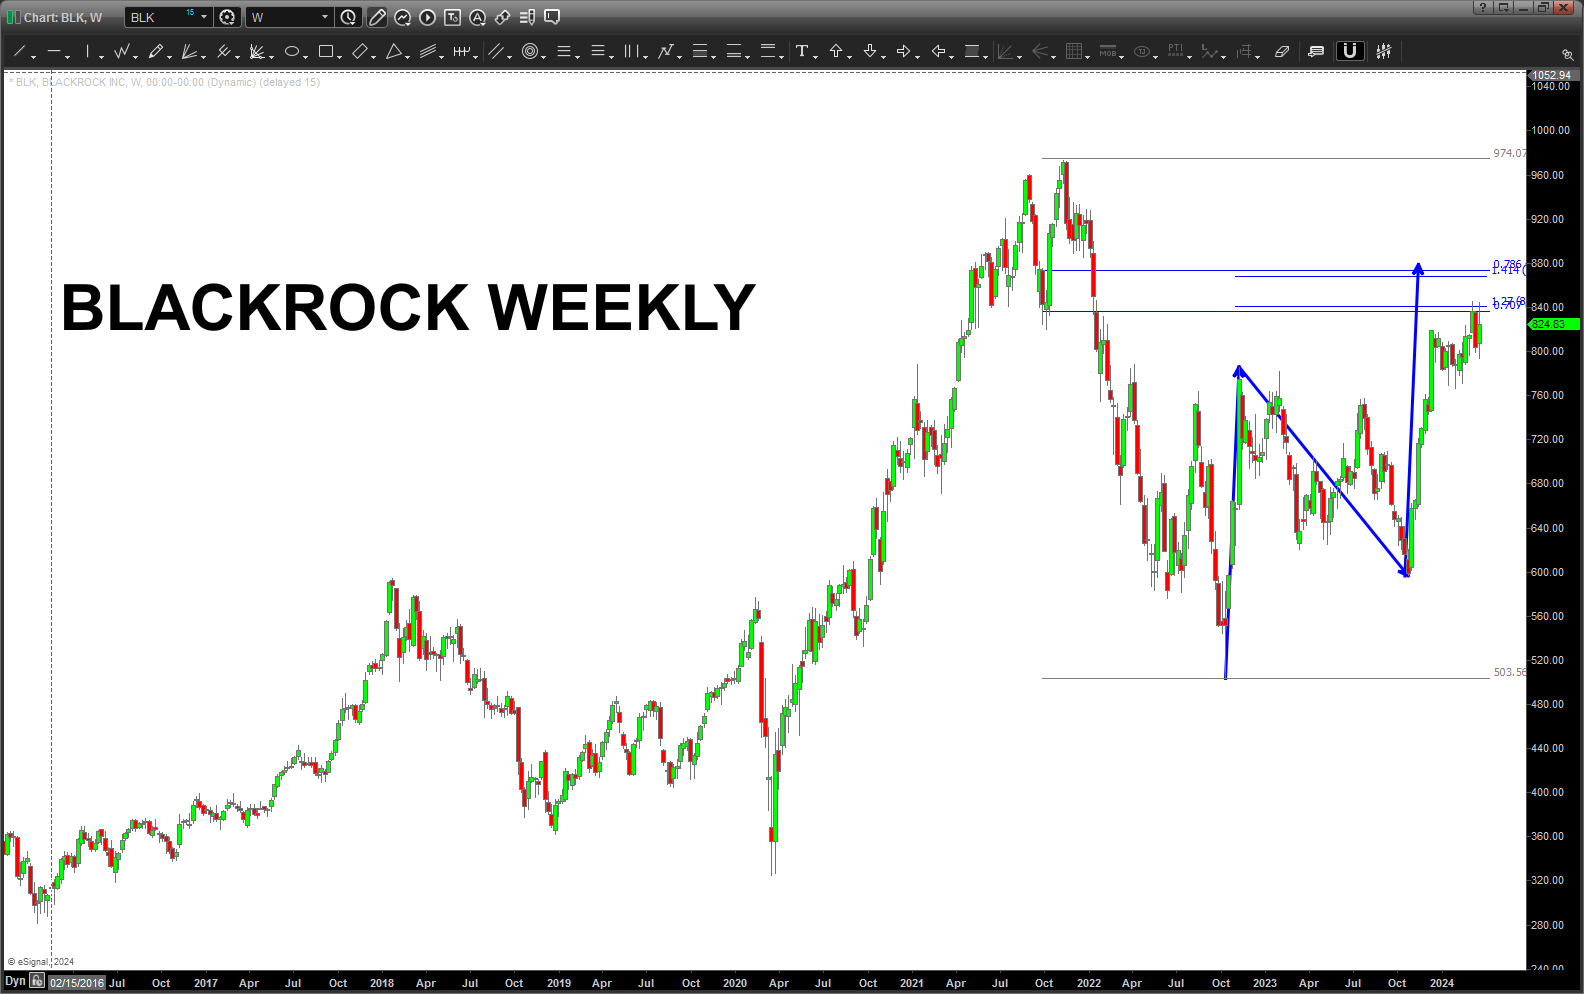
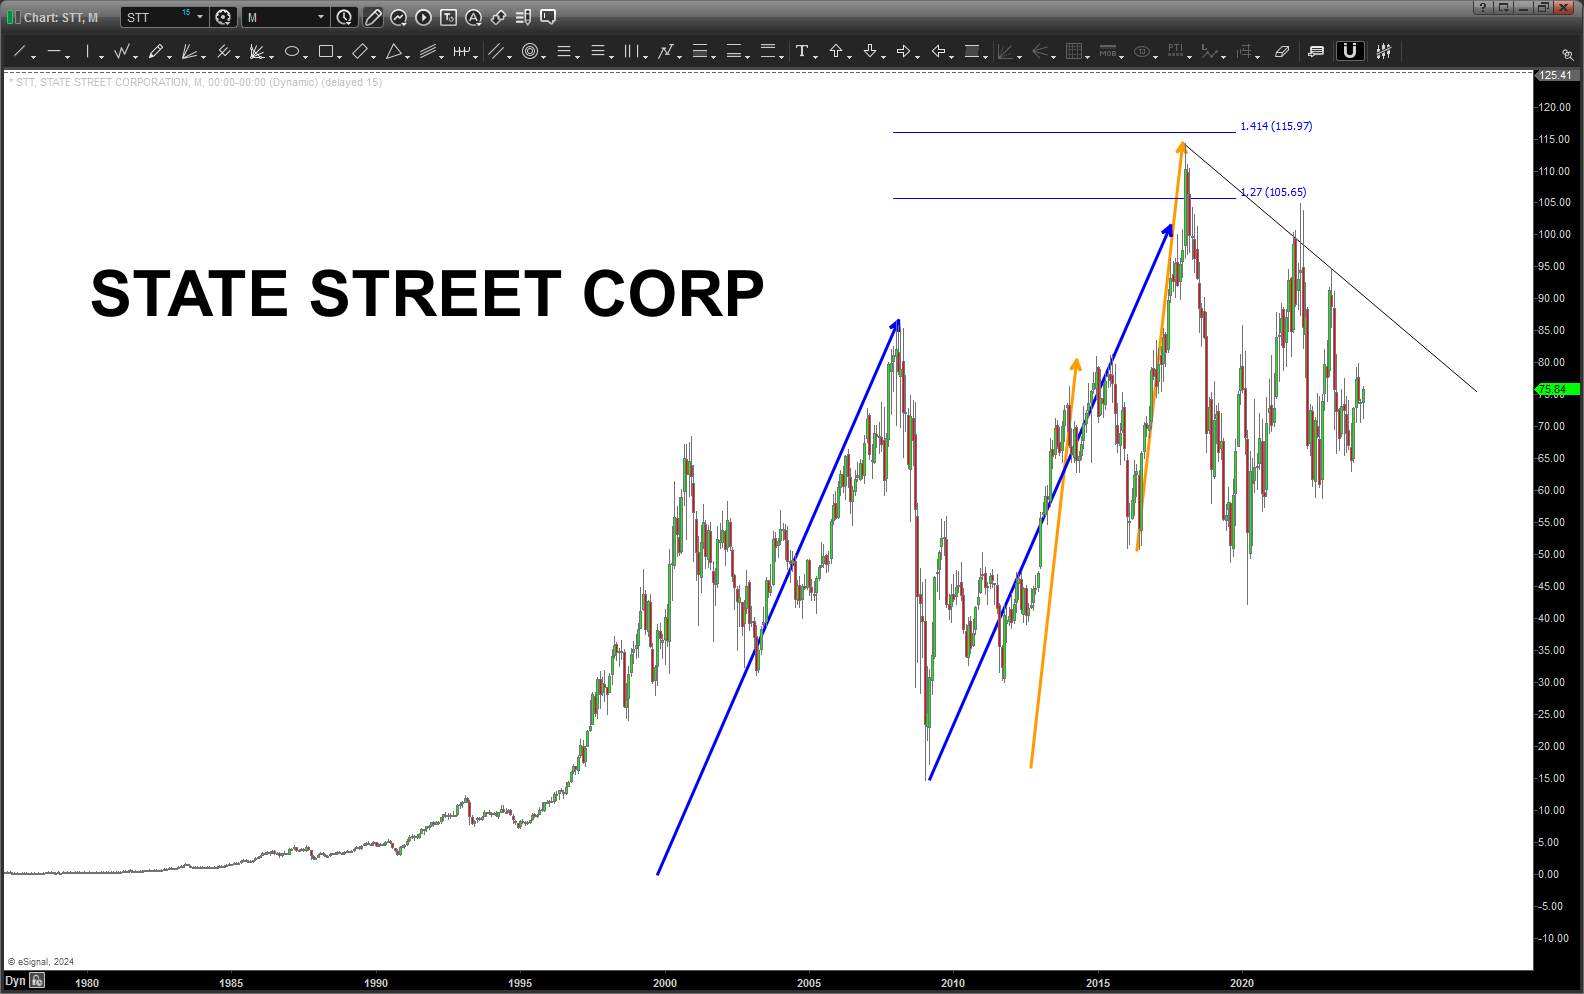
We need to also pay attention to the companies that are, basically, controlling the market as custodians. Vanguard, State Street and Blackrock control roughly 70% of all trading going on … One would think that these would be at new highs …like everyone else?
Larry showed this over the weekend:
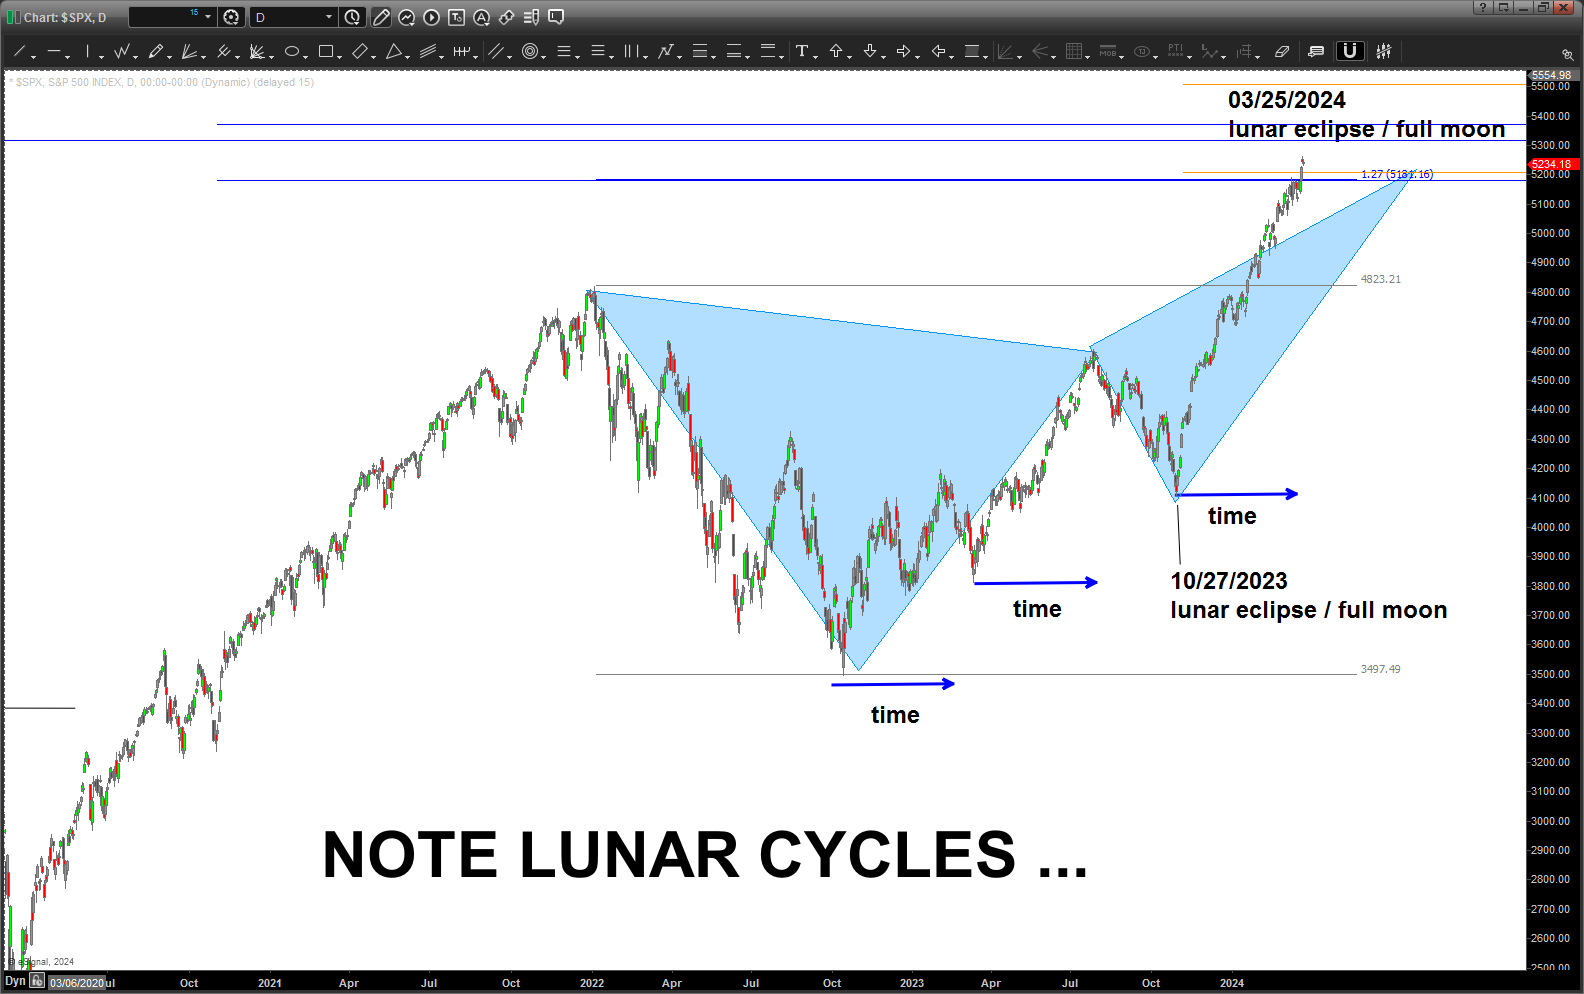
when we look at the shorter term cycles … we can see this one going on w/ the S&P500. Notice the harmony w/ the lunar eclipse and the moons synodic cycle:
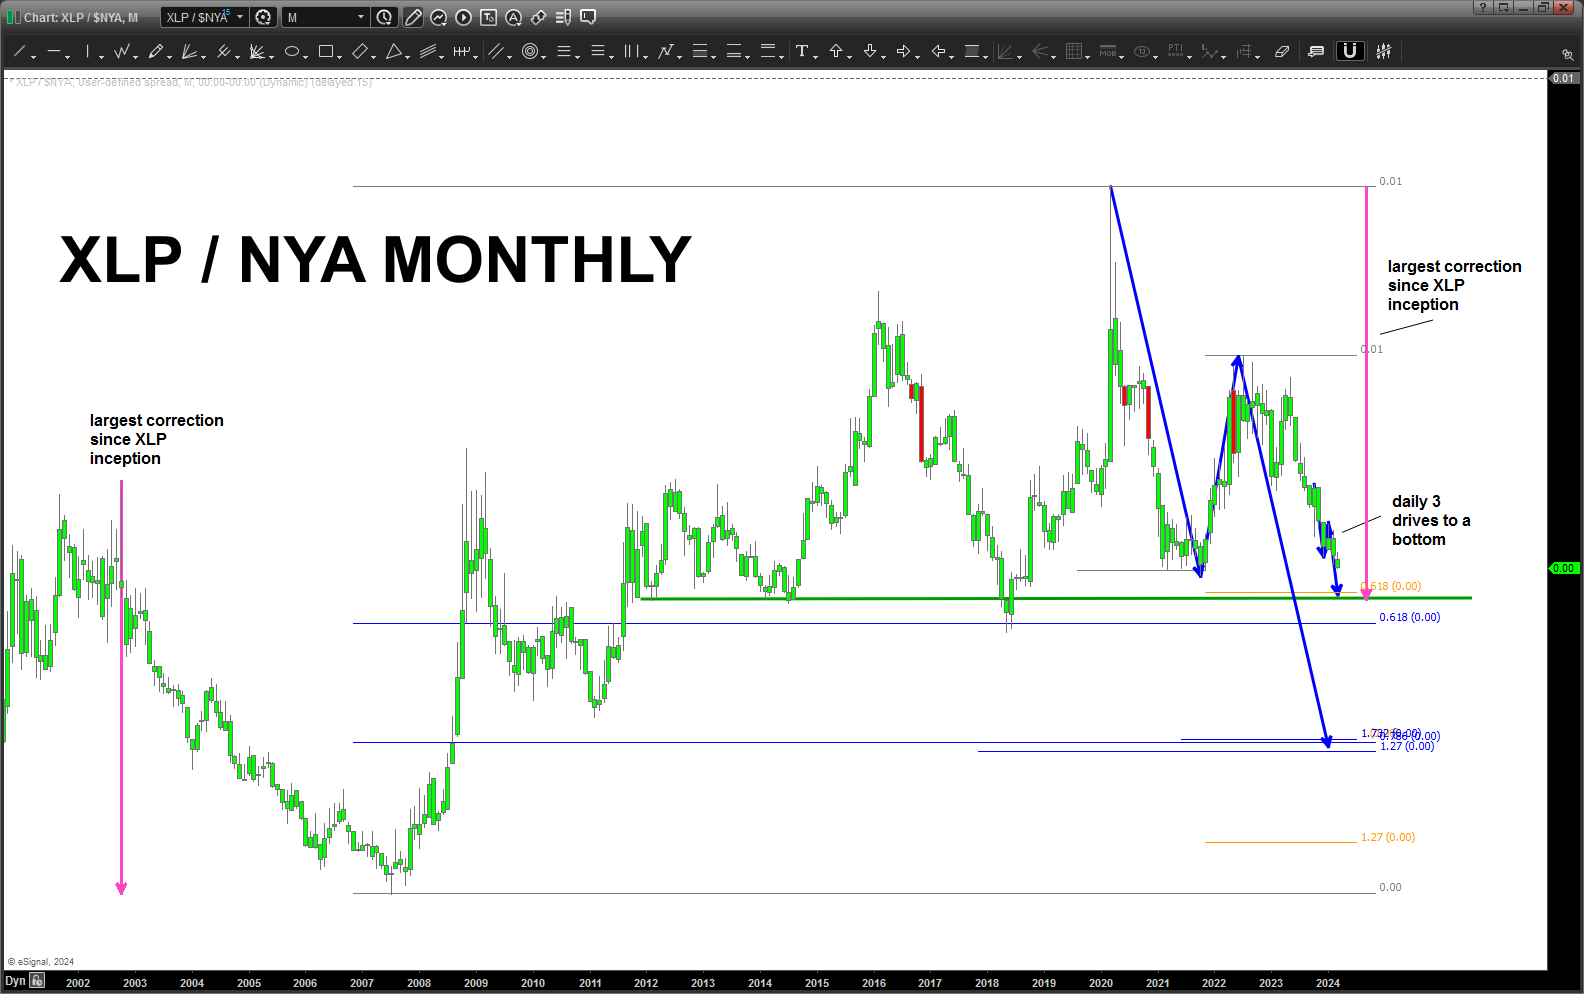
A non-correlated, but a goody, at looking for both bullish and bearish inflections in the market – ratio analysis of XLP/NYA is VERY close to MAJOR support which, in the past, has been “bearish” for stocks. Again, it’s a “institutional gauge” of risk/risk off.
When it’s risky – the smart guys like Tim but toilet paper …the XLP does WORSE (from a relative strength standpoint) than the overall market and vice versa.
The target appearing on the XLP/NYA is the LARGEST MEASURED MOVE correction in the ratio since the inception of the XLP. PAY ATTENTION TO THIS LEVEL and the .618 retracement (from the all time low) a little lower.
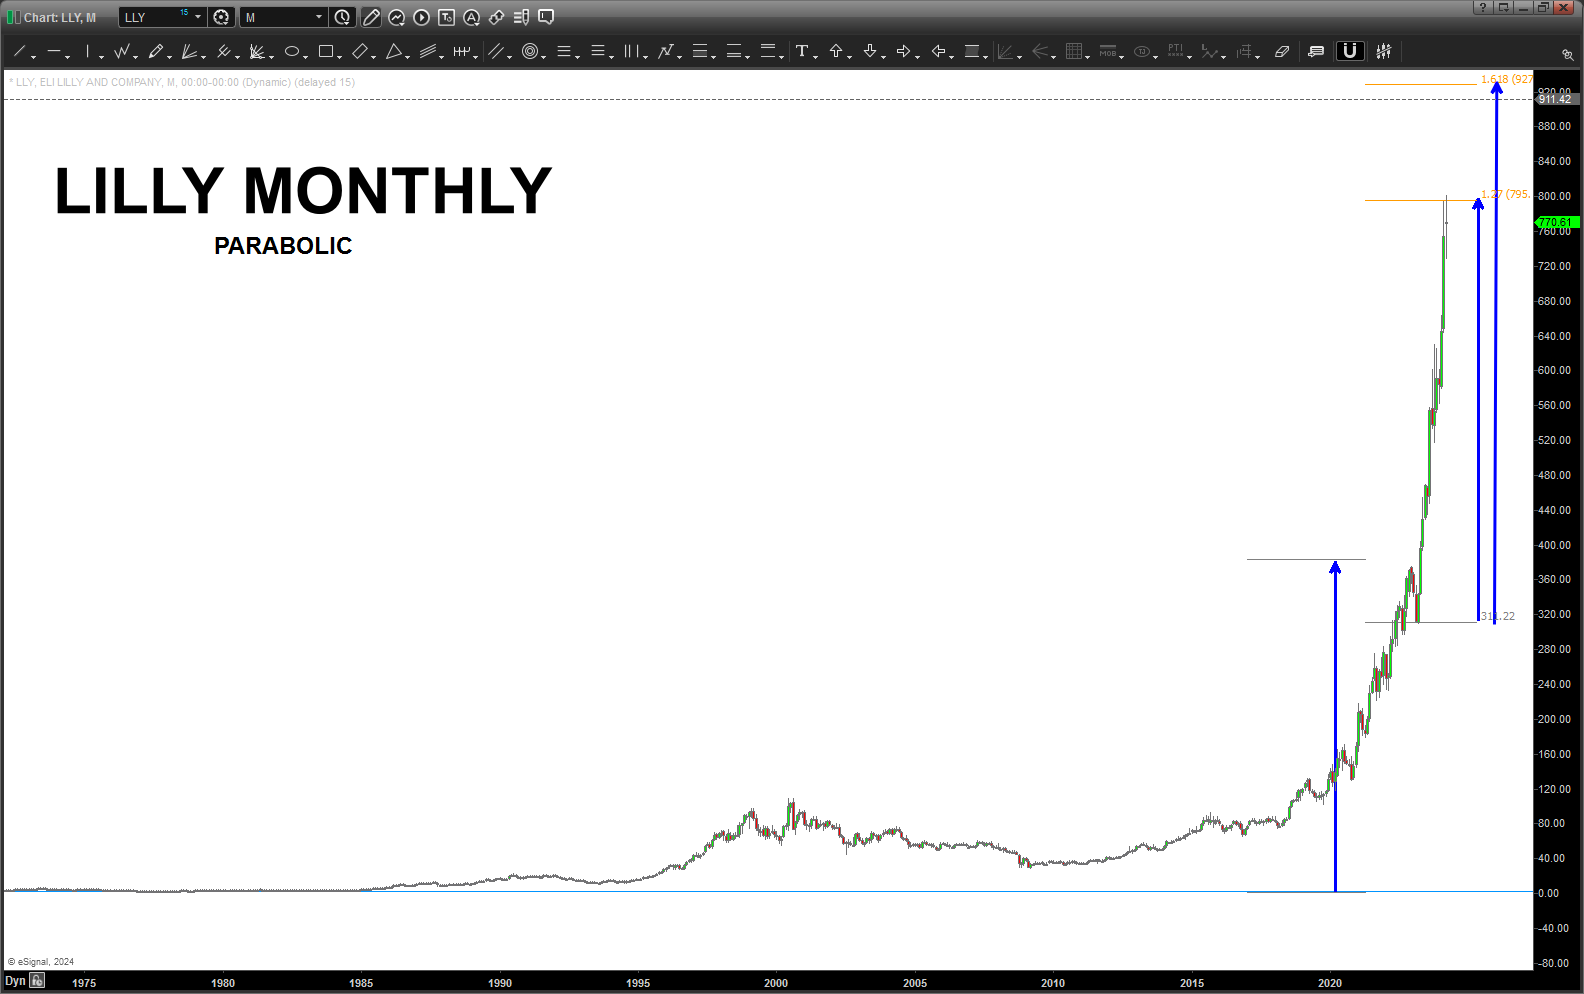
There are MANY stocks that are manically parabolic … stocks like LLY will crumble and fall like a stone. As demonstrated before, the parabolic moves, from a pure subconscious level, have to balance and that massive move up will be followed by a big correction. It happens, every time …
NVDA will do the same … yes, I believe NVDA is going higher BUT I think we need a good ole’ corrective move to cool everything down.
Here’s LLY parabolic:
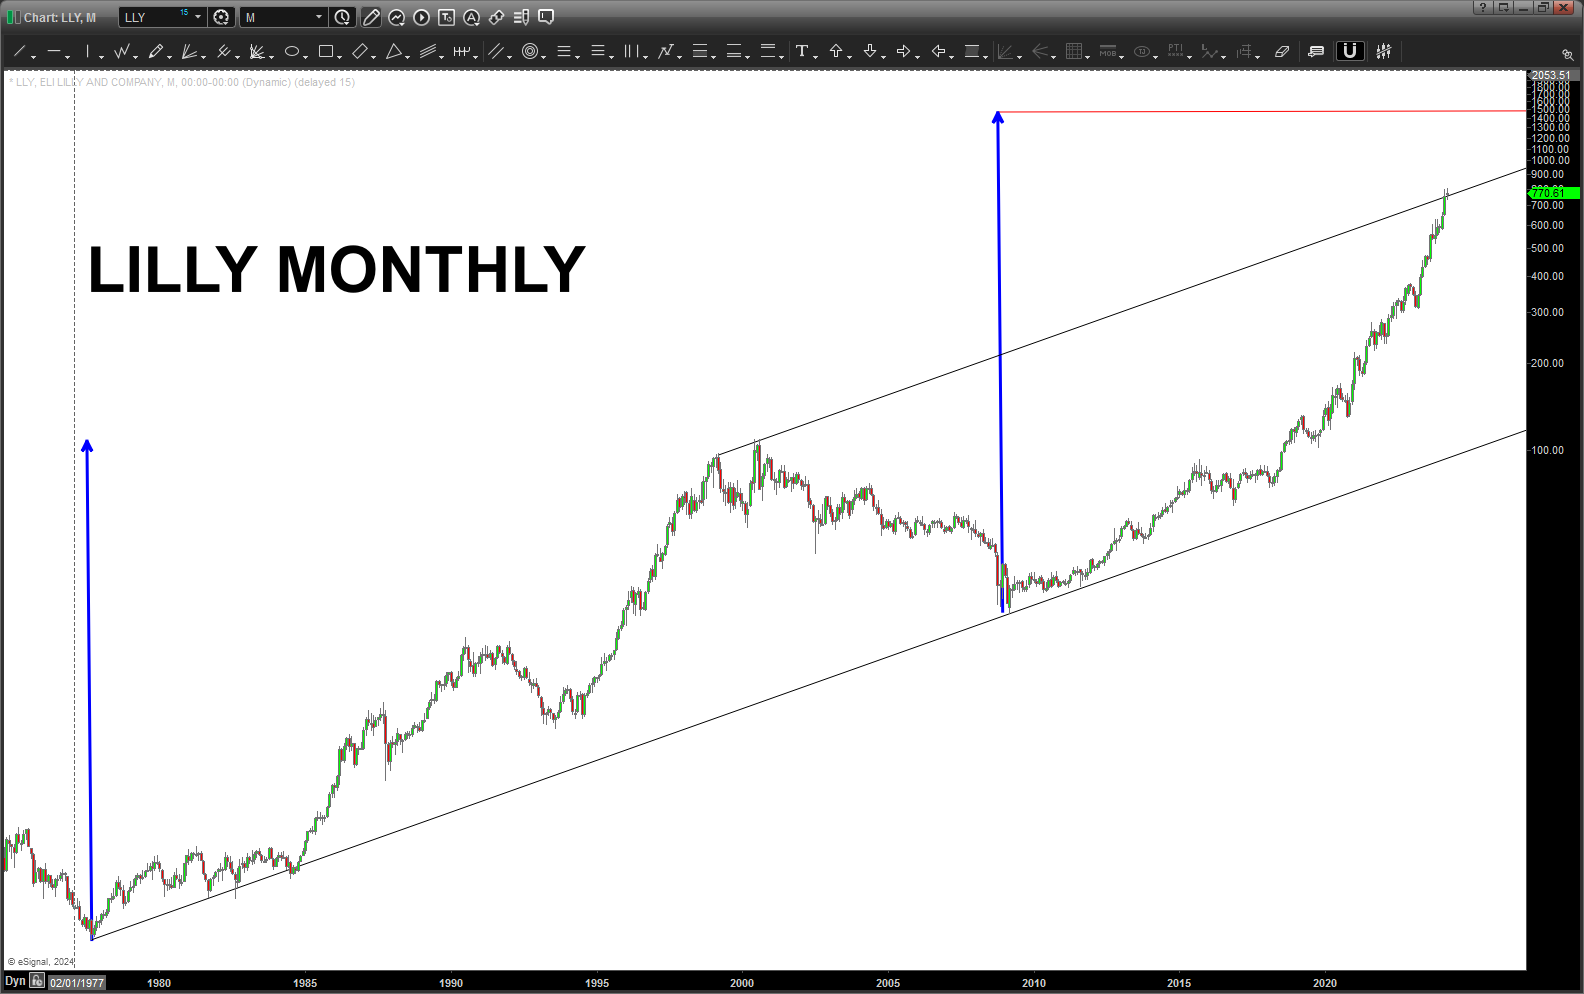
Here is LLY in MONTHLY LOG scale .. bumping right into the upper channel:
The market is overextended. Large, monthly targets are being hit.
If a perennial bull – think of taking profit or have some sort of “loss” stop in mind. Some are calling for a MASSIVE TOP and others are saying this bull market continues for years.
I try, the best I can, to just look for patterns.
ACROSS THE BOARD SELL PATTERNS HAVE AND ARE APPEARING …
IF they work, THEN – at a minimum – expect a good 6-8 week “pullback” that must be bought. LET’S JUST WAIT FOR THE FIRST BUY PATTERN TO APPEAR AND LET IT RIP.
IF the fail, THEN – this market could explode higher … into a parabolic run up that will put the 2000’s to shame.
MANAGE THE RISK … that’s all we can do.

Howdy my dear friend, that is some fancy chart work there. I wholeheartedly agree with you before seeing all your data. BUT until then we are just trading what we are given, when it is given….and making good money in the process! Keep on truckin’, enjoy your waves, and give me a call one of these days! Miss your laughter!
May your angels always fly above you,
Tamara – DVQueen