Goldman Sachs
well, look at this ….
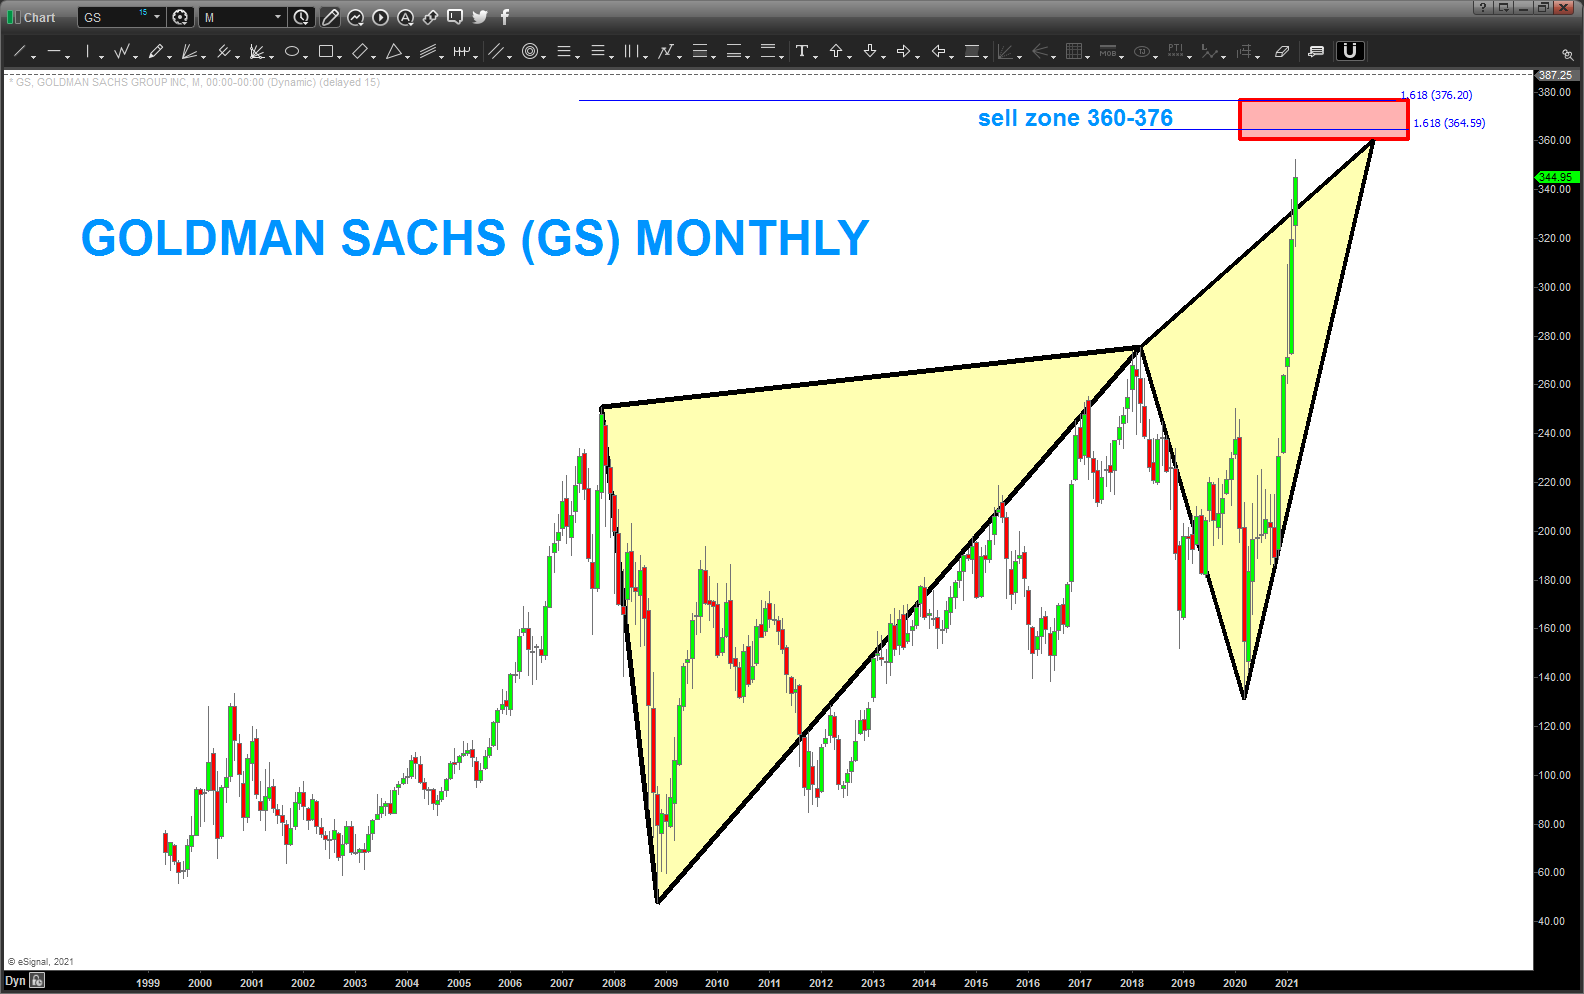
this a MONTHLY BUTTERFLY SELL signal on GS. Target zone is 360-376. Since it’s so large would WAIT for a signal reversal candle before entering a short …the AB=CD is at 360 (bottom range of the zone)
well, look at this ….
this a MONTHLY BUTTERFLY SELL signal on GS. Target zone is 360-376. Since it’s so large would WAIT for a signal reversal candle before entering a short …the AB=CD is at 360 (bottom range of the zone)

Pingback: GS Goldman Sachs Target HIT – Bart's Charts