S&P 500 – September 14, 2023
Extremely important pattern appearing on the S&P 500 / ES tonight. As I was cruising the charts I noticed this SELL PATTERN on the cash S&P 500:
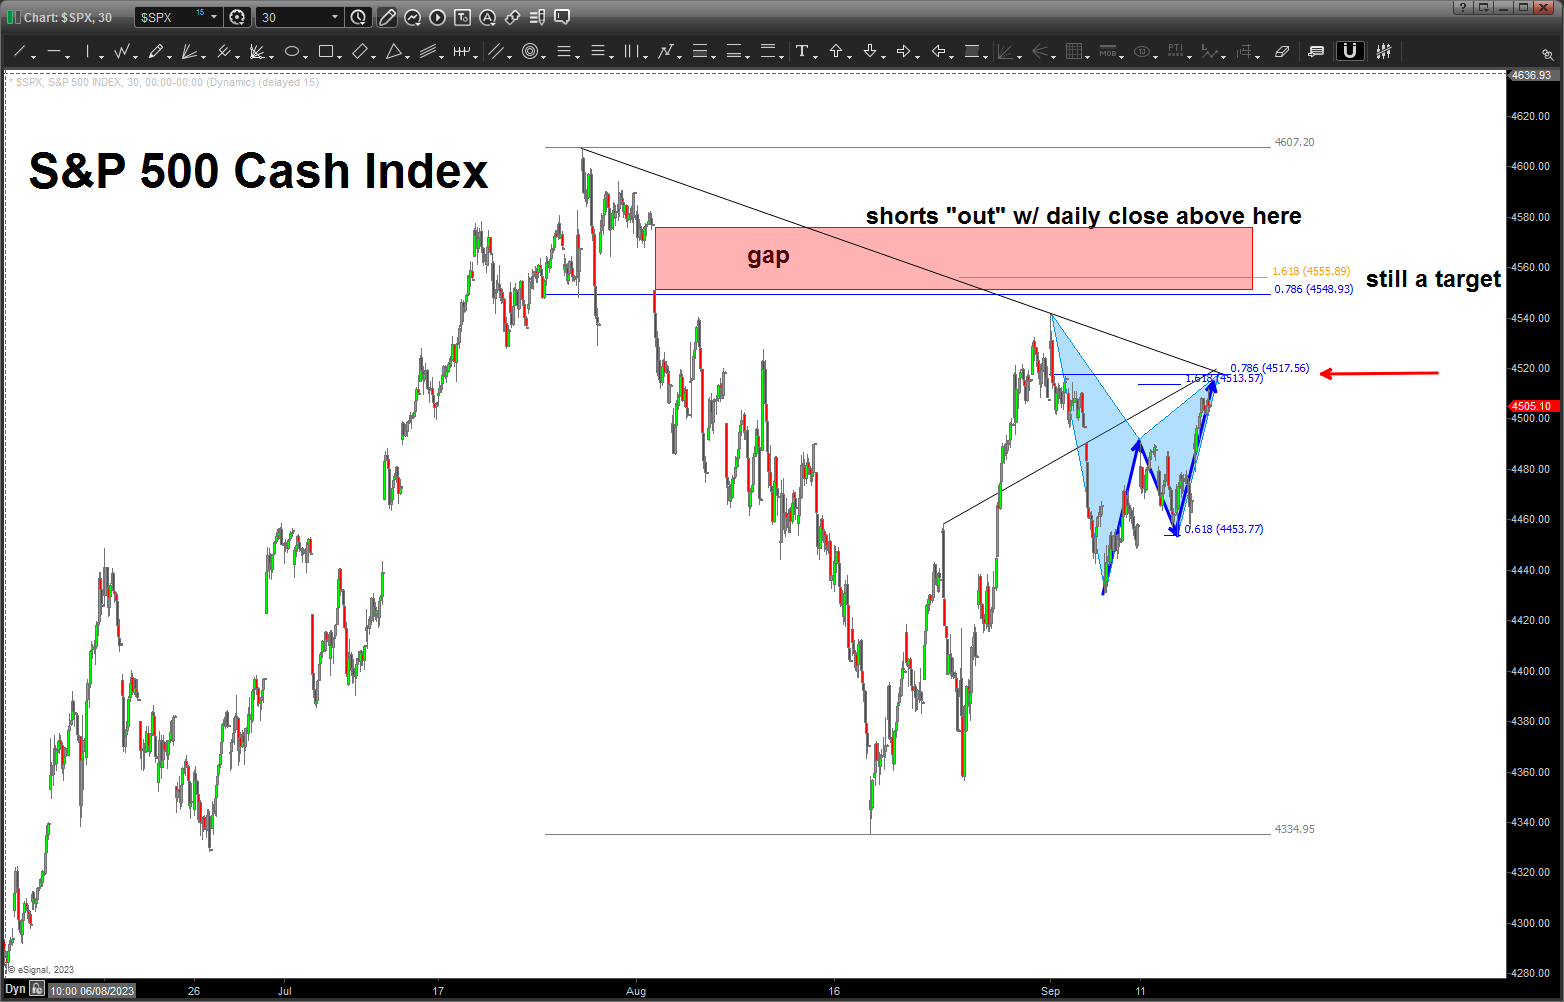
The reason this is so important is the most recent high is “supposed” to be the second wave / b-wave high and we “should” be going down … failing this pattern STILL gives weigh to the higher target shown and we have that BIG GAP to fill so it’s not a “sure thing” for the bulls but I live and die by the PATTERNS and this one is a nice one … if you see (not labeled) the 3 wave move to the recent high that we are shorting fits ‘nicely’ into a 2nd wave and, again, we “should” be going down in/around here and pretty much, now …
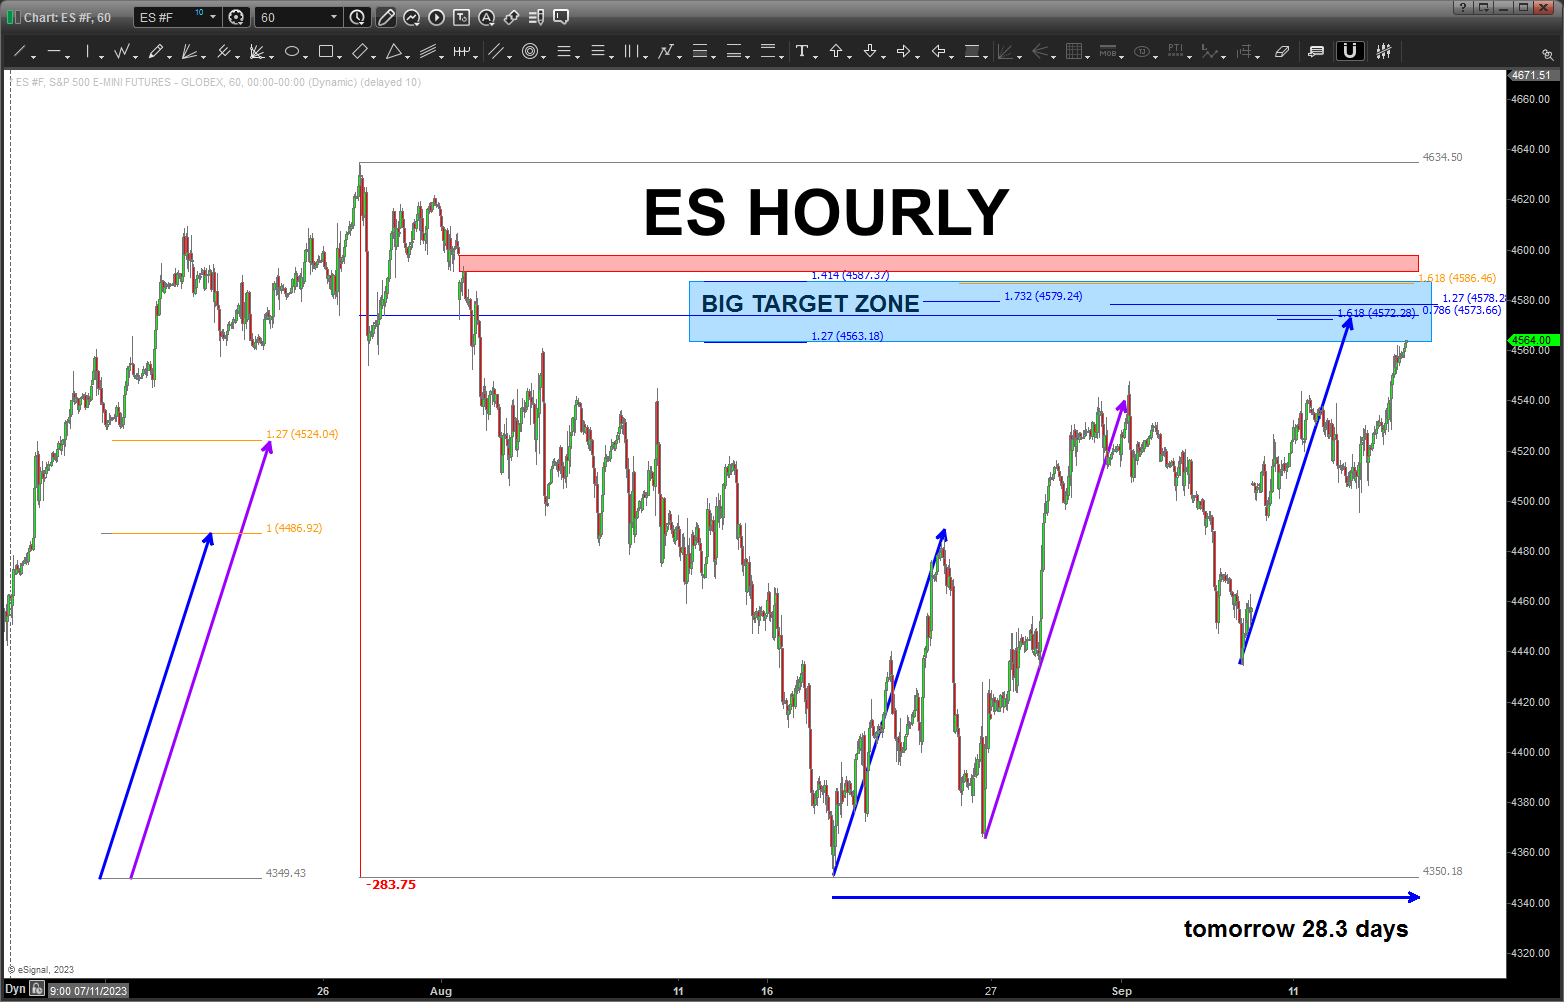
why now? let’s go to the ES
I like the “concept” of square outs as it’s pretty simple … price equals time. so xyz many points down converts to days and then you use calendar days (in this case) to project a future “square out” of price and time.
in this case, the market fell 283.75 points and, moving a decimal (trust me we can do that – go read or follow Mr. Robert Edward Grant – he’ll explain it. Too long to do here … anyway that becomes 28.3 calendar days and, from tomorrow 09/15/2023 if you go back that many days you get the low at 4350 on 08/18/2023. A “square out” takes place on the E-mini tomorrow and it’s up against a BIG resistance zone – sure looks like a short too me? Doesn’t it?

hi Bart can you point me out which book from Robert Edward Grant he got few book out
thank you will watch you on Larry P. today
Enzo – great to hear from you. Try Philomath to start! Trust you are well!