XLP/NYA ratio analysis – an update
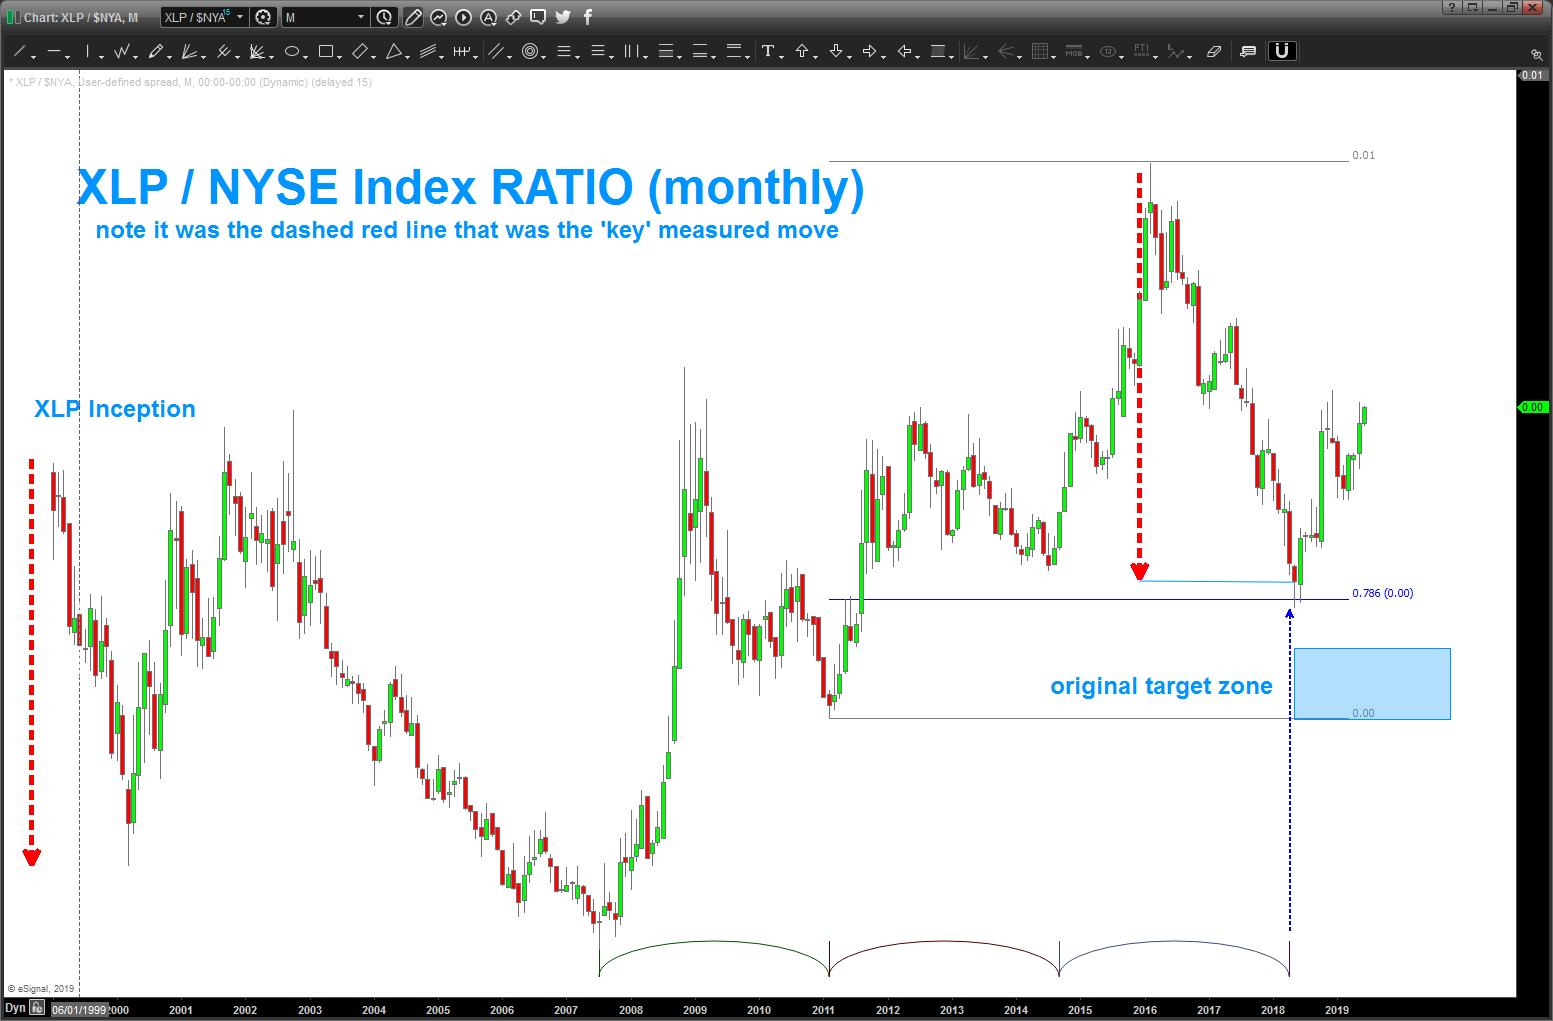
06/09/2019 – back to our old favorite. you know I’ve been watching this one for a while. I was hawking a low in the ratio in mid-2018 but missed it from a time perspective … then, in retrospect, easily saw the measured move and the .786 retrace. I’m human, I missed it. should have been more diligent – especially w/ the time cycles coming in from the 2007 low. the TIME had worked as support before so why not now …? Oh well.
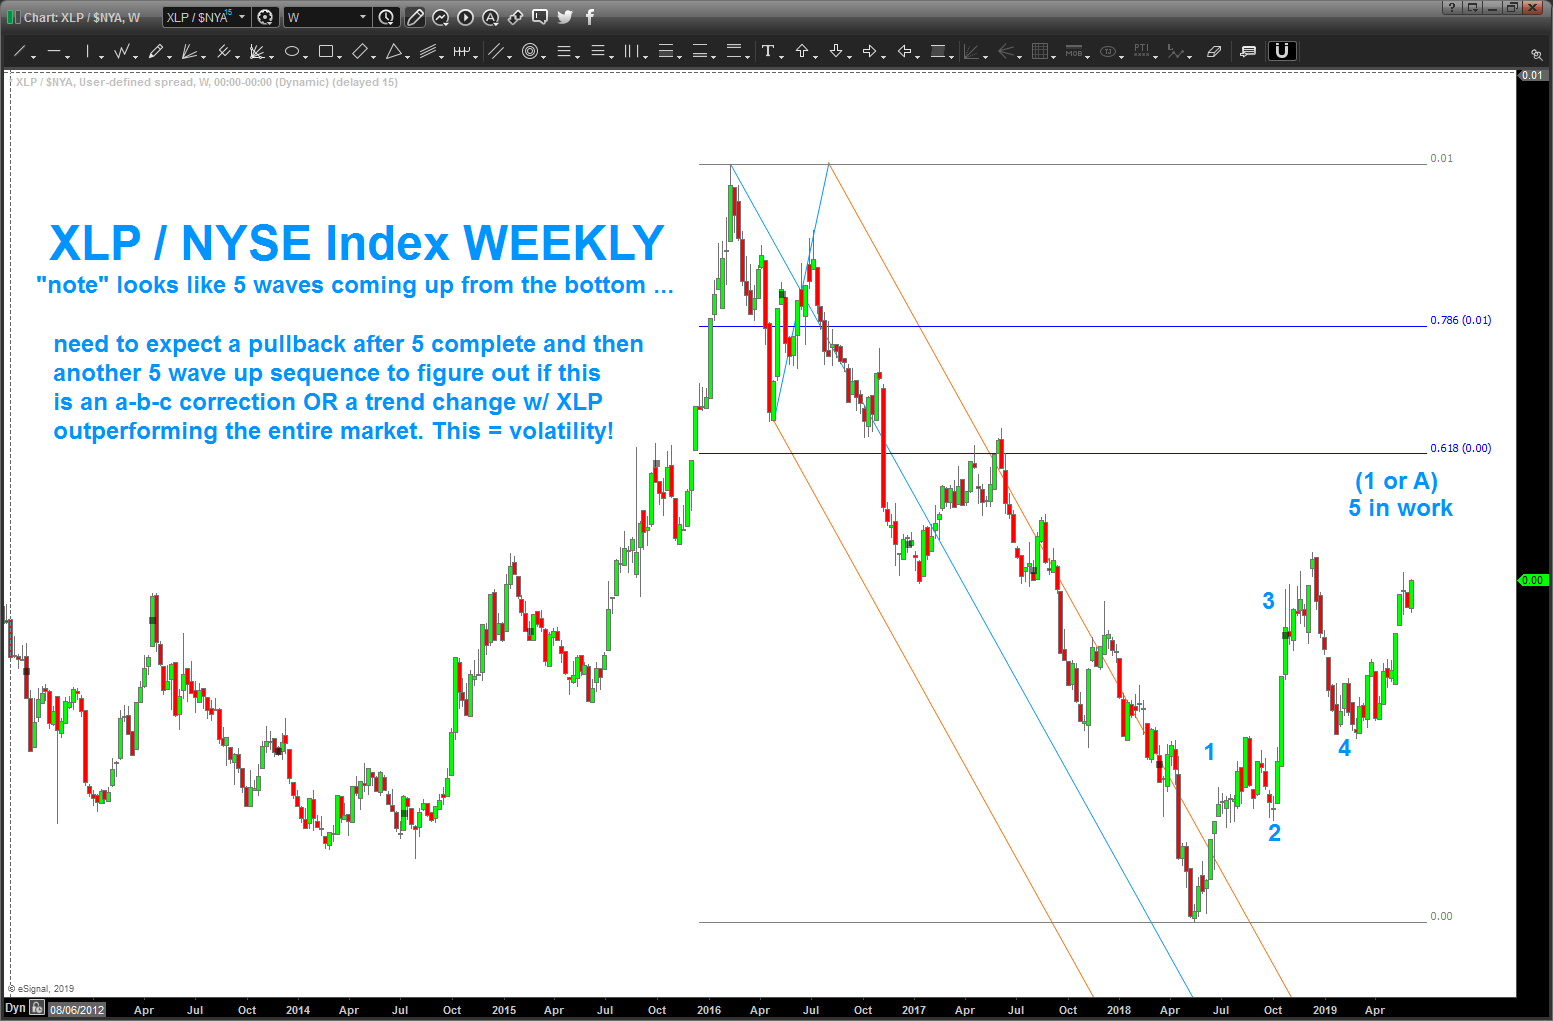
now, we can pretty nicely see 5 waves up and we are in the 5th wave up .. could be a 1 or an A. only TIME will tell. I feel reasonably certain that after a pullback on the ratio (less volatility, higher stocks) there will be another 5 wave move higher if this analysis is correct.
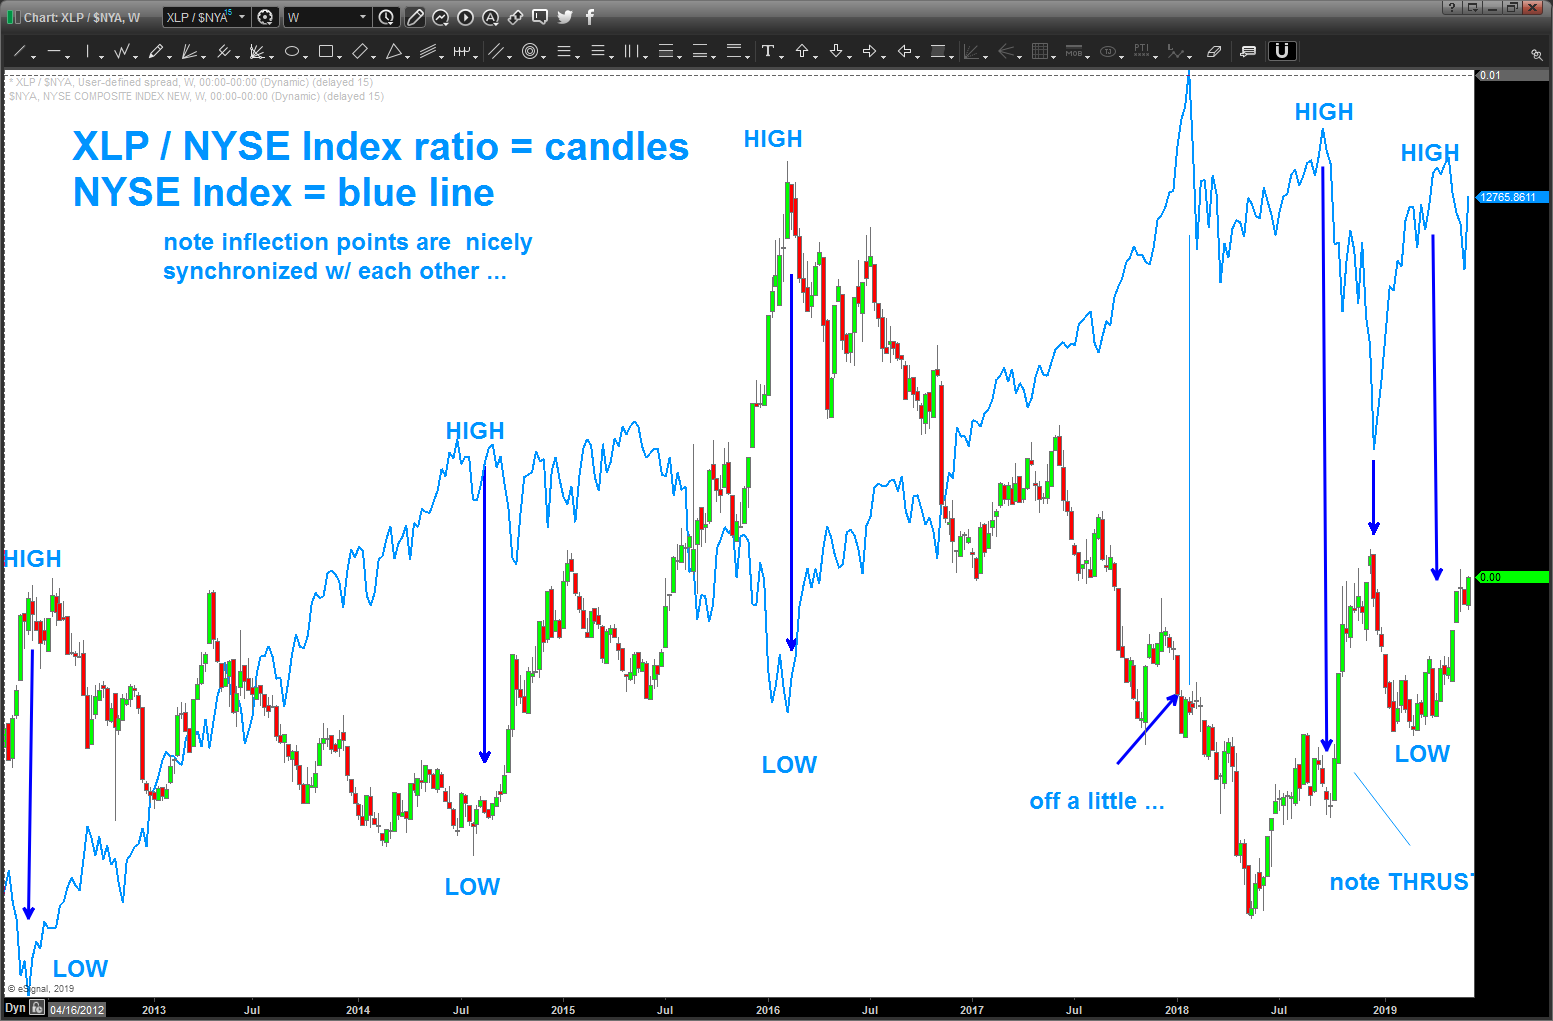
I’ve also included an overlay of the NYSE Index and the XLP/NYA ratio to show the thesis that – by using patterns to ratio analysis we can find potential inflection points. in this case – staples (XLP) represent a risk off mindset (volatility/selling) when they outperform the overall market (the ratio goes up). when the overall market (NYSE Index) outperforms (the ratio goes down) then risk is on and the market volatility should go down and prices go up. Seems to work …
so, 5 waves up from the bottom, 3 wave pullback and 5 waves up … that’s what were looking for, right now. TIME will tell.

Pingback: monitoring the NYSE Inex | Bart's Charts