Value Line Geometric – updated 08/14/2019
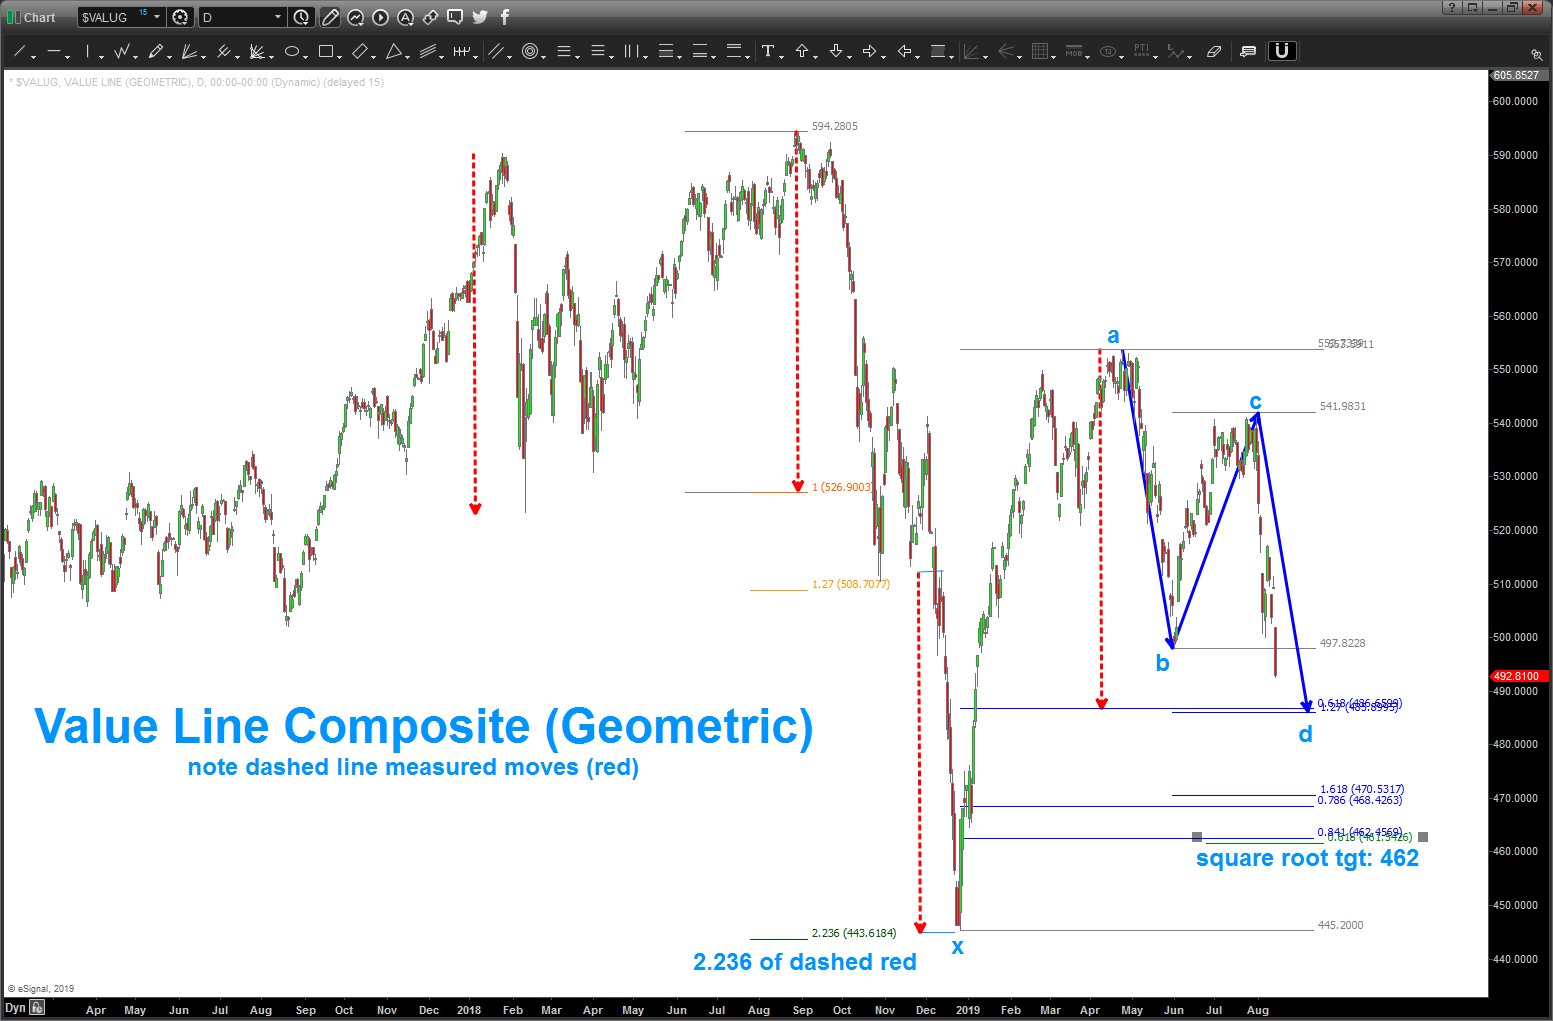
08/14/2019 – a very important BUY PATTERN is appearing on the Value Line Composite (Geometric). Again, it’s all PATTERNS and we don’t know which ones work or which ones will fail … but we can do IF and THEN statements to get an idea of the trend and where are …
in this case we have a PERFECT BUY pattern.
B = .5 XA and C= .786 AB.
D = AB=CD, .618 XA and 1.27 BD
folks, look how the numbers are ALL on top of each other ….also, take a look at the dashed red line which shows pretty much all of the corrections (measured moves) since early 2018. the entire big correction was 2.236*dashed red (square root of 5) and note the dashed red line hits EXACTLY at our PATTERN BUY level of 486-487.
IF we lose this level then the next logical stopping point is 468-470 and/or 461-462. this level represents .618 projection of the big correction, a .841 retracement (musical note) and also the square root target from the 553 high.
What is a reason to be cautious? THRUST .. that’s ugly looking bearish candles of late coming into our pattern level so make the market prove it to you by looking for a signal reversal candle UP …
Expect the market to find support on one of these three levels .. if not, lookout below.
Bart
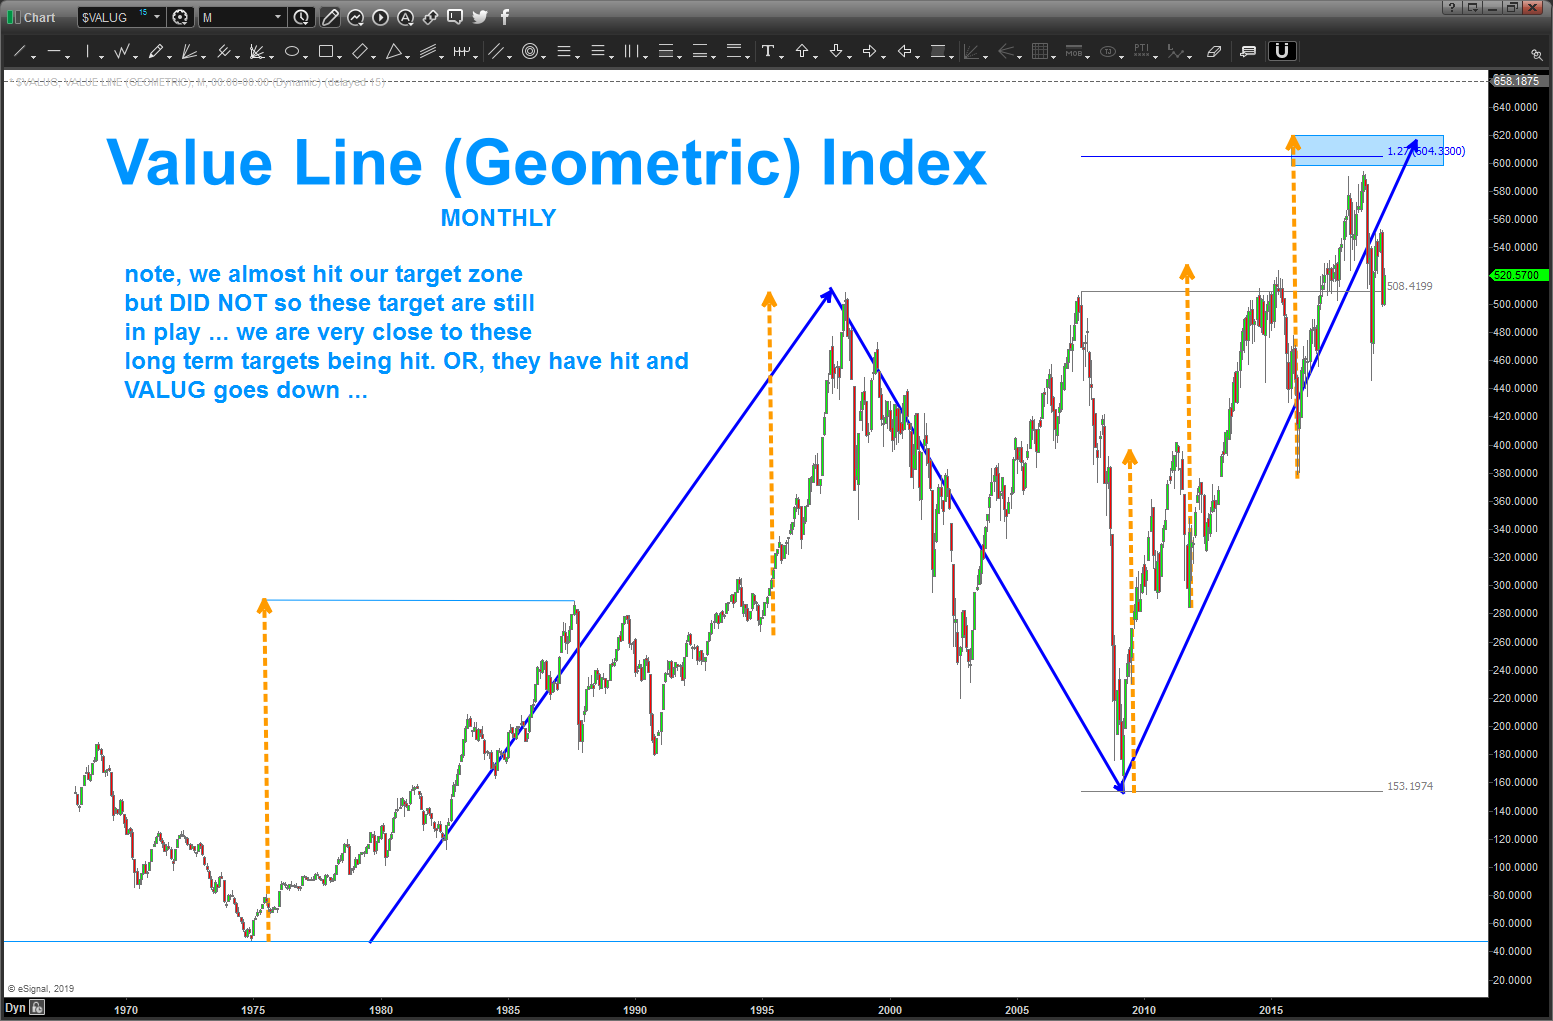
last time I blogged about the Value Line was here: https://atomic-temporary-44460632.wpcomstaging.com/2018/03/04/value-line-geometric-index-another-10-to-go-updated-03-04-2018-2/ note the target zone of late. it STILL hasn’t been tagged so those targets are still out there … I’d put this one on your radar as we got REALLY close to tagging the lower end of the target zone and sold off … any rally above the old all time highs should be met w/ caution due to the presence of the long term targets overhead …
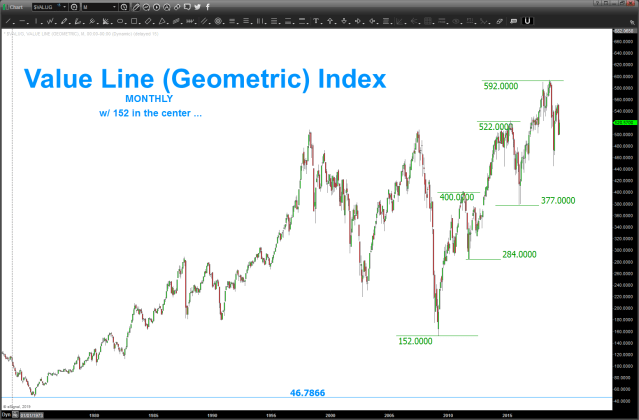
this is a great index to watch for the overall health of the market … In basic terms, the Value Line Geometric Index eliminates an illusion created by cap-weighted index components.
here’s some harmonics using the all time low of 47 and the square of 9
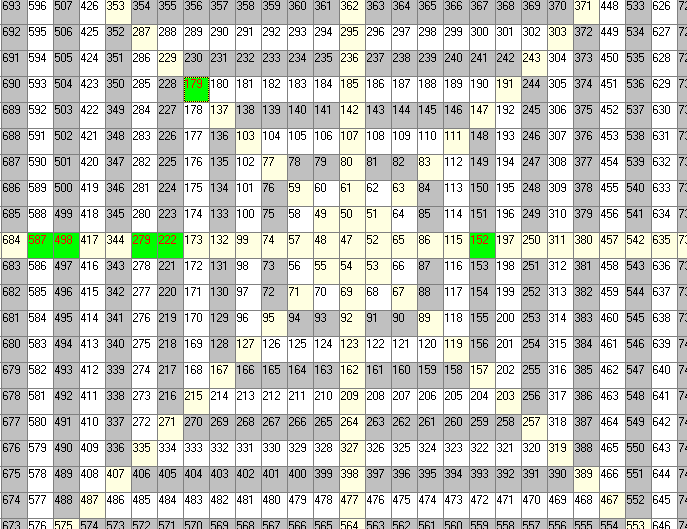
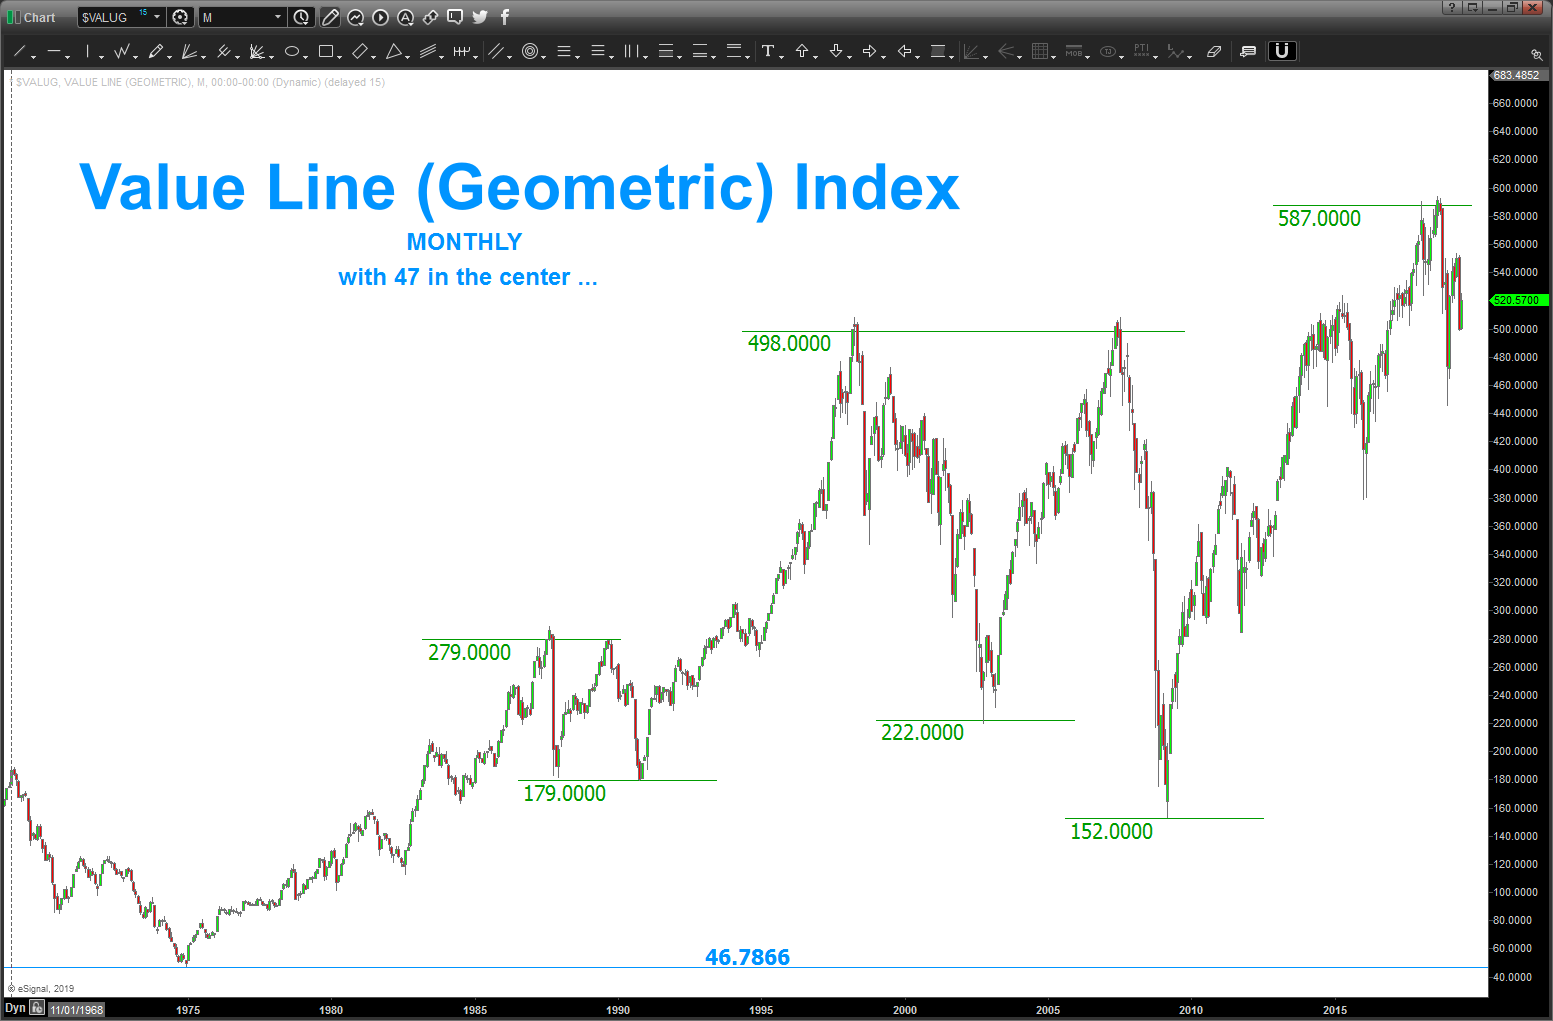
this last leg begins at 152 so I’m going to put that in the center …and I did NOT do this before and then show it .. I’m doing this real time. Just looking to see IF the highs and lows correspond to 45 degree angles on the square of 9 from a PRICE PERSPECTIVE. Since we (at least me) believe that PRICE equals time there is a time component to this puzzle that can also use the square of 9. That’s too much for this blog for now .. but, do yourself a favor and ‘pull’ the middle number UP and then you’ll see a pyramid (yes I’m making reference to the GREAT PYRAMID in a blog about the Value Line) I wonder if the ancient Egyptians tracked planets and seasons and TIME via these same 45 degree increments? Perhaps? Perhaps not …there’s some other neat stuff to do w/ the square of nine based on ‘other’ numbers that are ‘interesting’ or ‘important’ for certain dates or angles. Study ‘cycles’ and you’ll see.
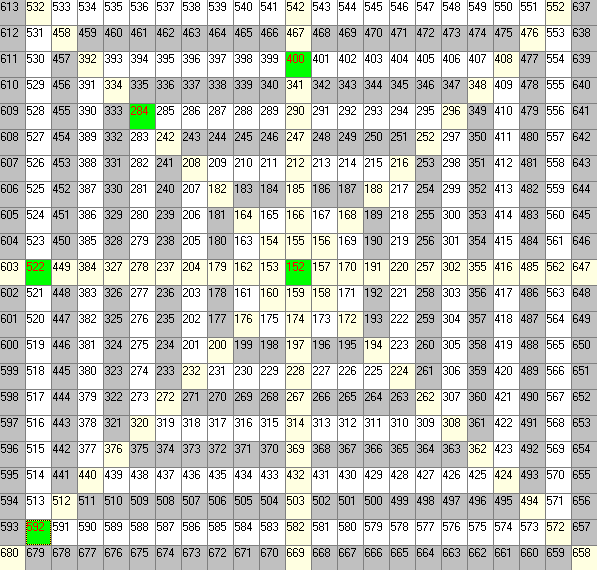
either way, I see some major resistance HERE or a little higher in the Value Line.
Just a pattern dude so don’t try to confuse me w/ all the smart fundamental stuff. It makes my head explode.
GN – Bart
