UPS and DJ Transportation (update II 10/28/20)

10/28/20 -not trying to play Captain Obvious, but that was an ugly sell off today. as shown a couple days/week ago, the Transports were coming up to BIG resistance and/or topping in the area we charted. (FWIW – folks it was simply measured moves. The Transports had done the EXACT same move EVERY TIME except once that was 1.27*measured move)
so this update is to just say, it’s simply too early to put some downside targets on the blog. the correction (or is it a TOP) will produce a CORRECTIVE PATTERN. For now, just chill and wait for the Captain Obvious BUY to appear, if ever.
_______________________________________________
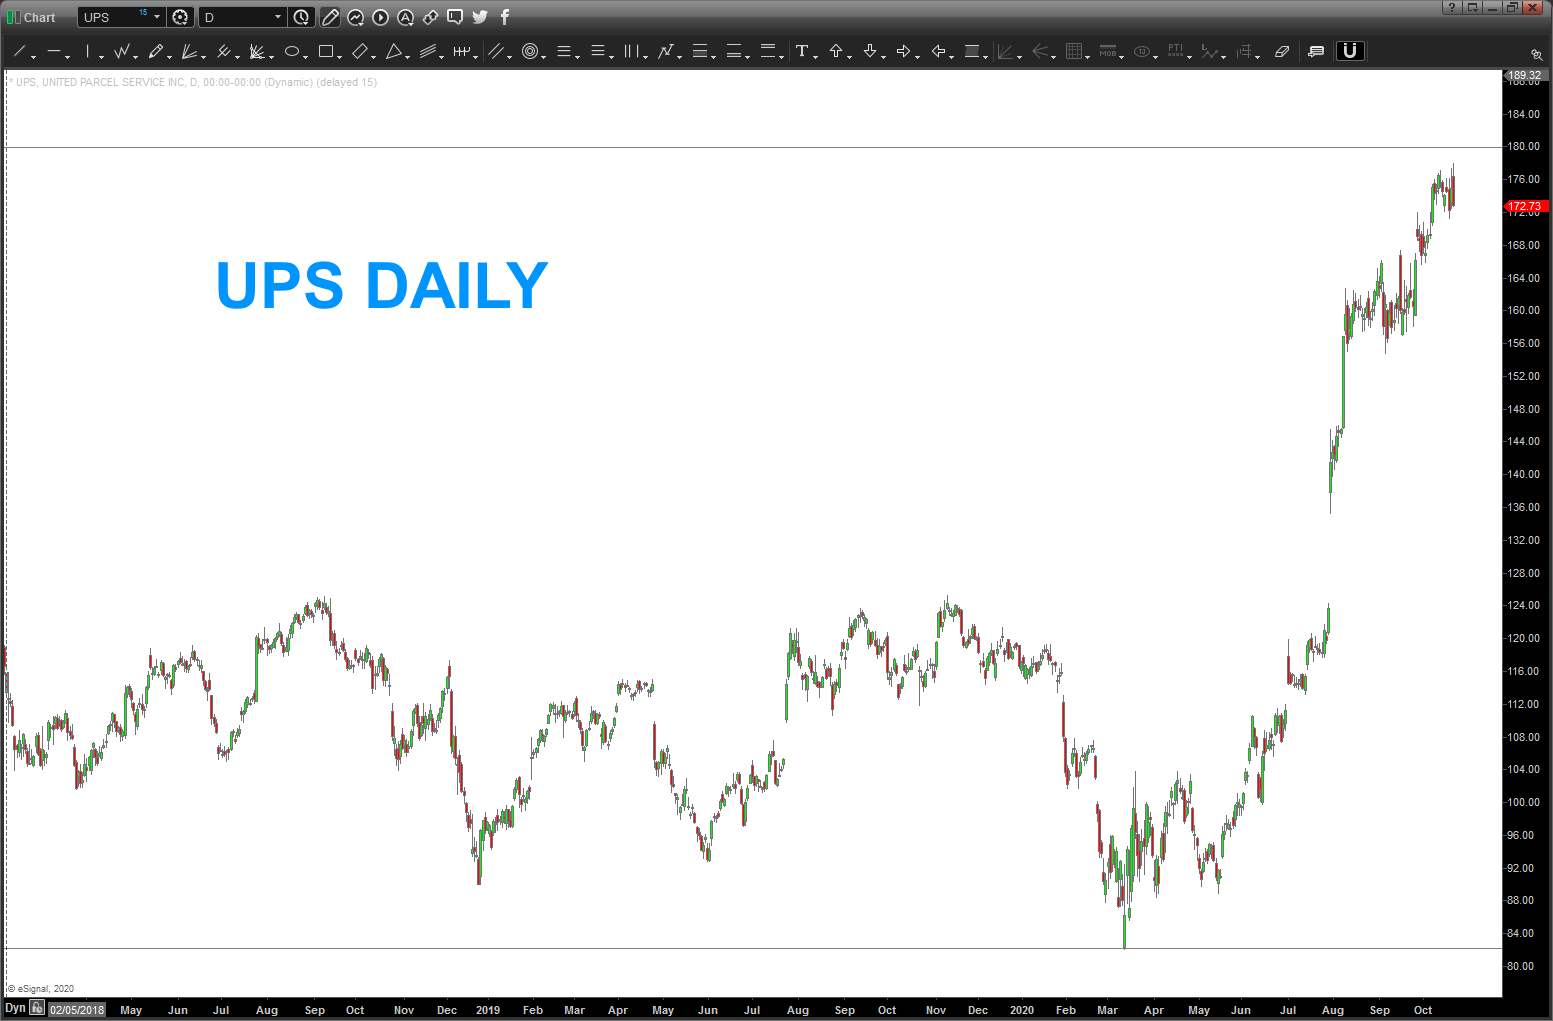
Update: the Transports target has been achieved and on an intraday 60 minute chart, UPS, came w/in some cents to the exact level. On the daily it’s basically 1 percent below. Now, the level is the level is the level so that target still stands but in conjunction w/ the Transports, believe this target set has been achieved.
Now, look at how STRONG this move in UPS and the Transports is into new highs. IT IS STRONG. Thus, suggestion is to wait for either a MONTHLY or WEEKLY signal reversal candle on close. (the LOW of the HIGH candle is CLOSED BELOW)
As I signed off last time .. stay tuned!
_______________________________________________
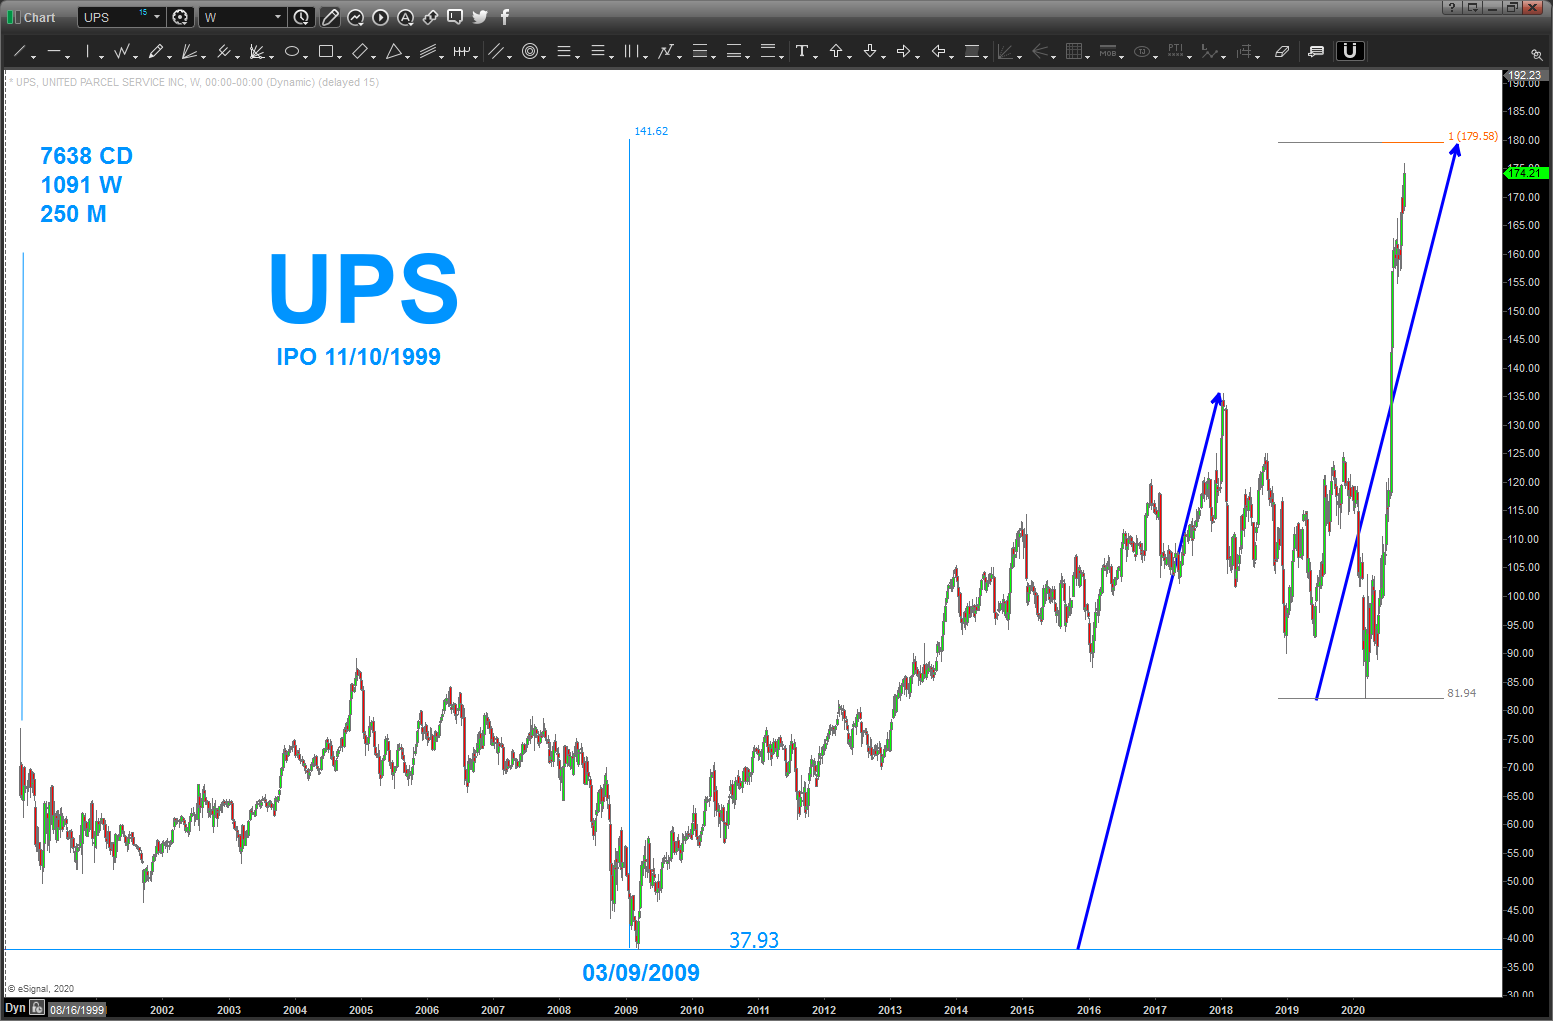
One of our nicest and predictable patterns is the “long term” measured move or AB=CD. UPS has an AB=CD 179-180. I say “long term” because we really like to use the longest measured move possible. In this case, w/ UPS, we are using the all time low to the first “big” high in/around January 2018. From there we copy/paste the blue arrow and place it on the low at 81-82 and project. That’s it.
the other numbers and the IPO date are cues for me to look at cycles and other “stuff” – just helps w/ the probability because, well, who knows if any of this going to work anyway – right?
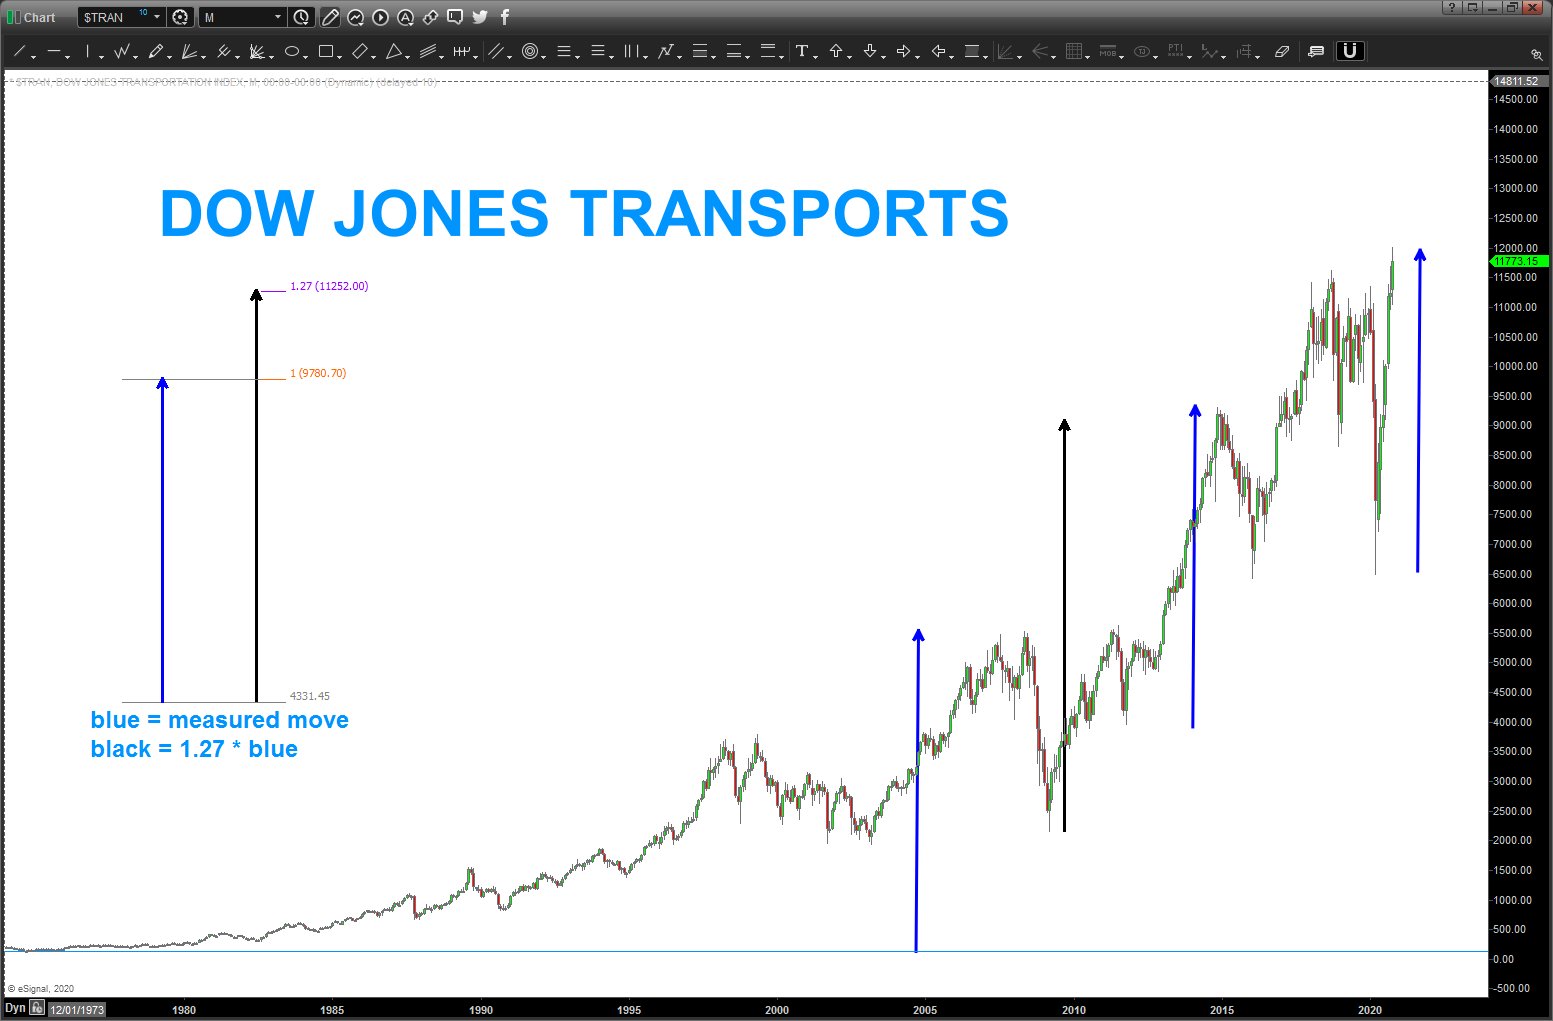
Additionally, since the “all-time” low in July of 1932 EVERY major correction has occurred after the “blue arrow” price move has completed. Note, in the case of the dashed orange arrow it was 1.27*the blue arrow. A number all too familiar w/ readers of this blog. And, finally, as you can see we have a measured move completing right around 12,000.
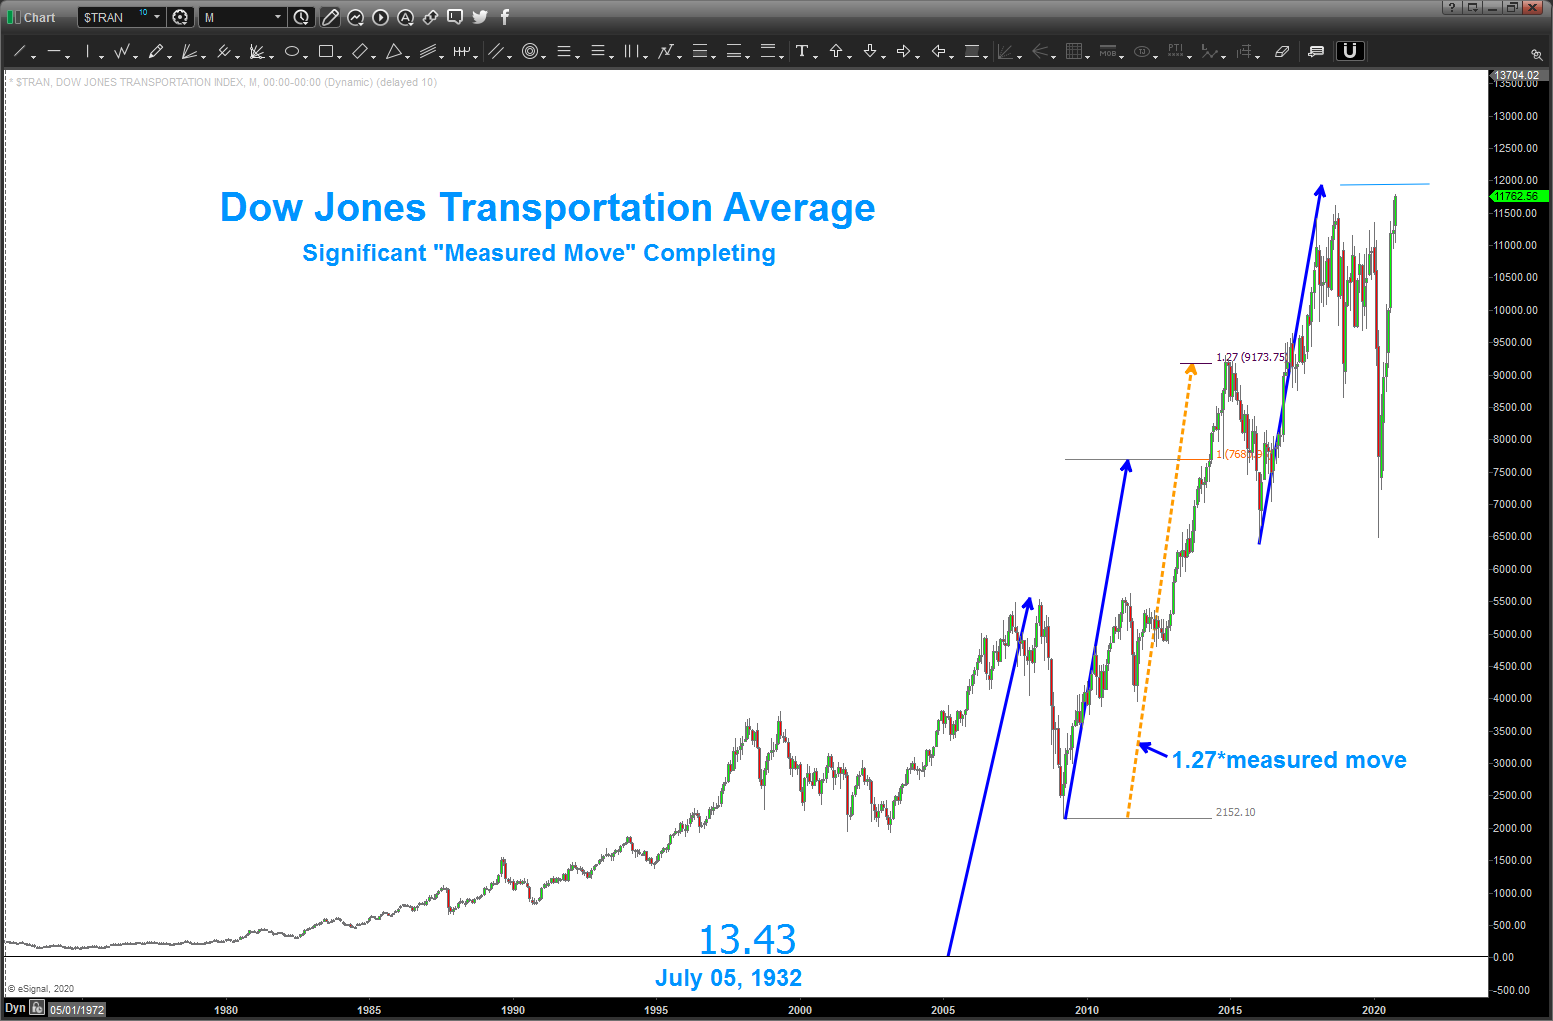
Now, if we do blow thru the target a little higher (and why not – it’s a rocketship) then we will still use our projections off the blue arrow to derive targets, along w/ other techniques.
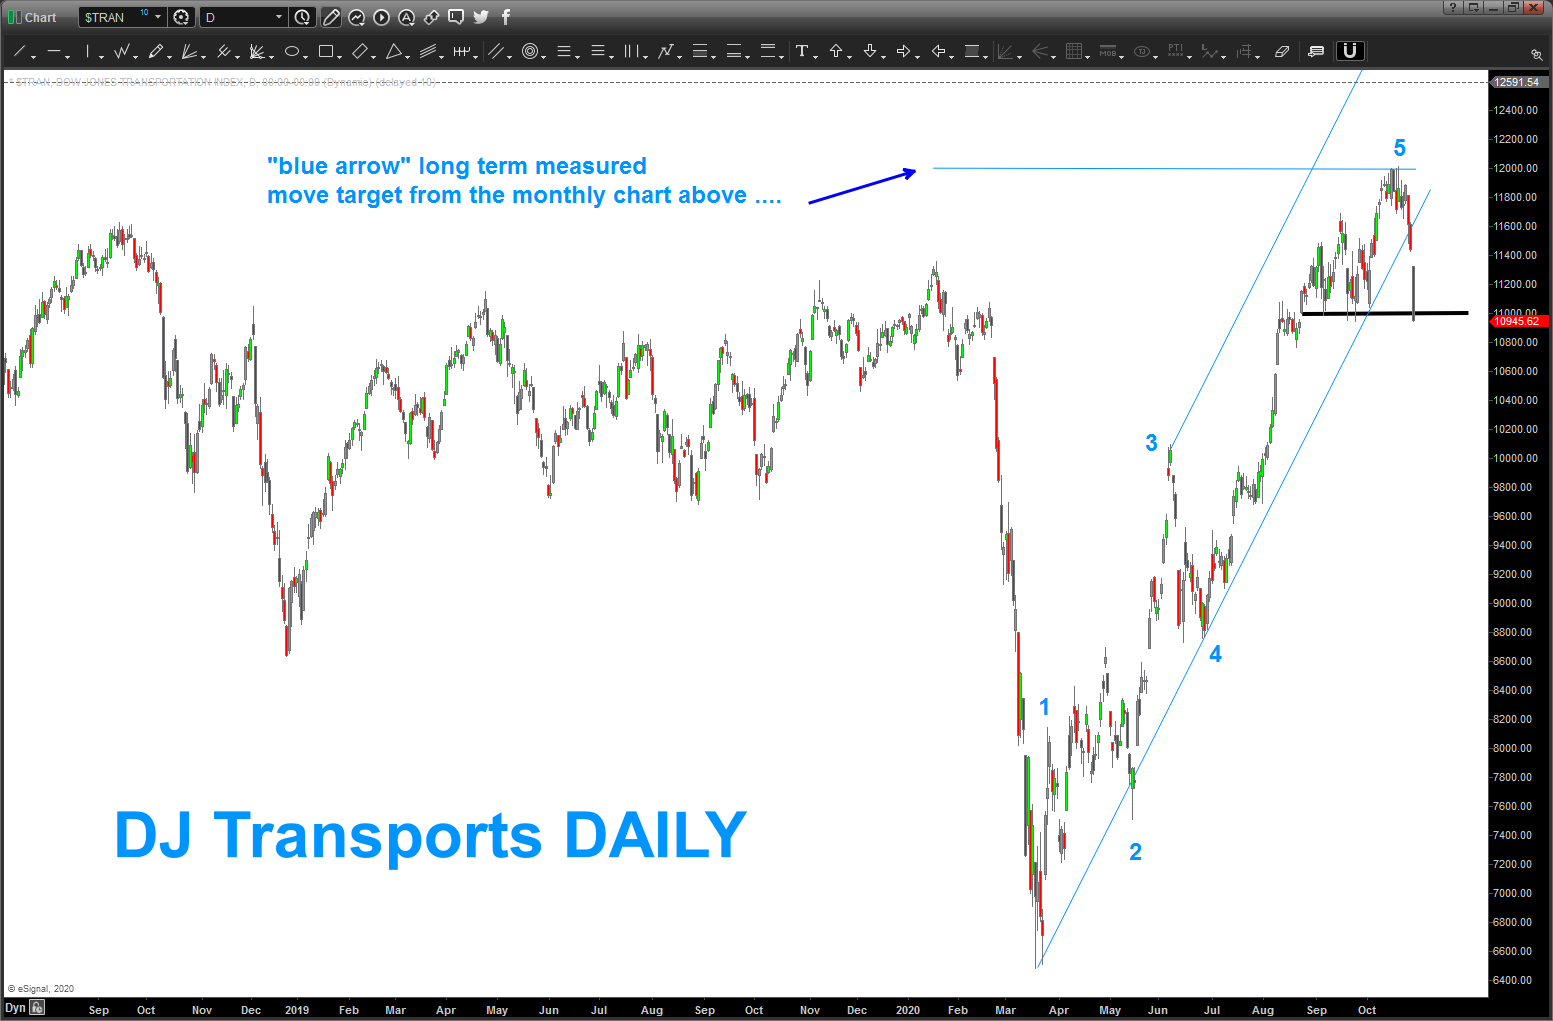
But, here below, is the Daily and you can see that we are finishing up 5 waves and the synergy between wave 5 = 1.618 is present right at the level of the long term measured move projection ….
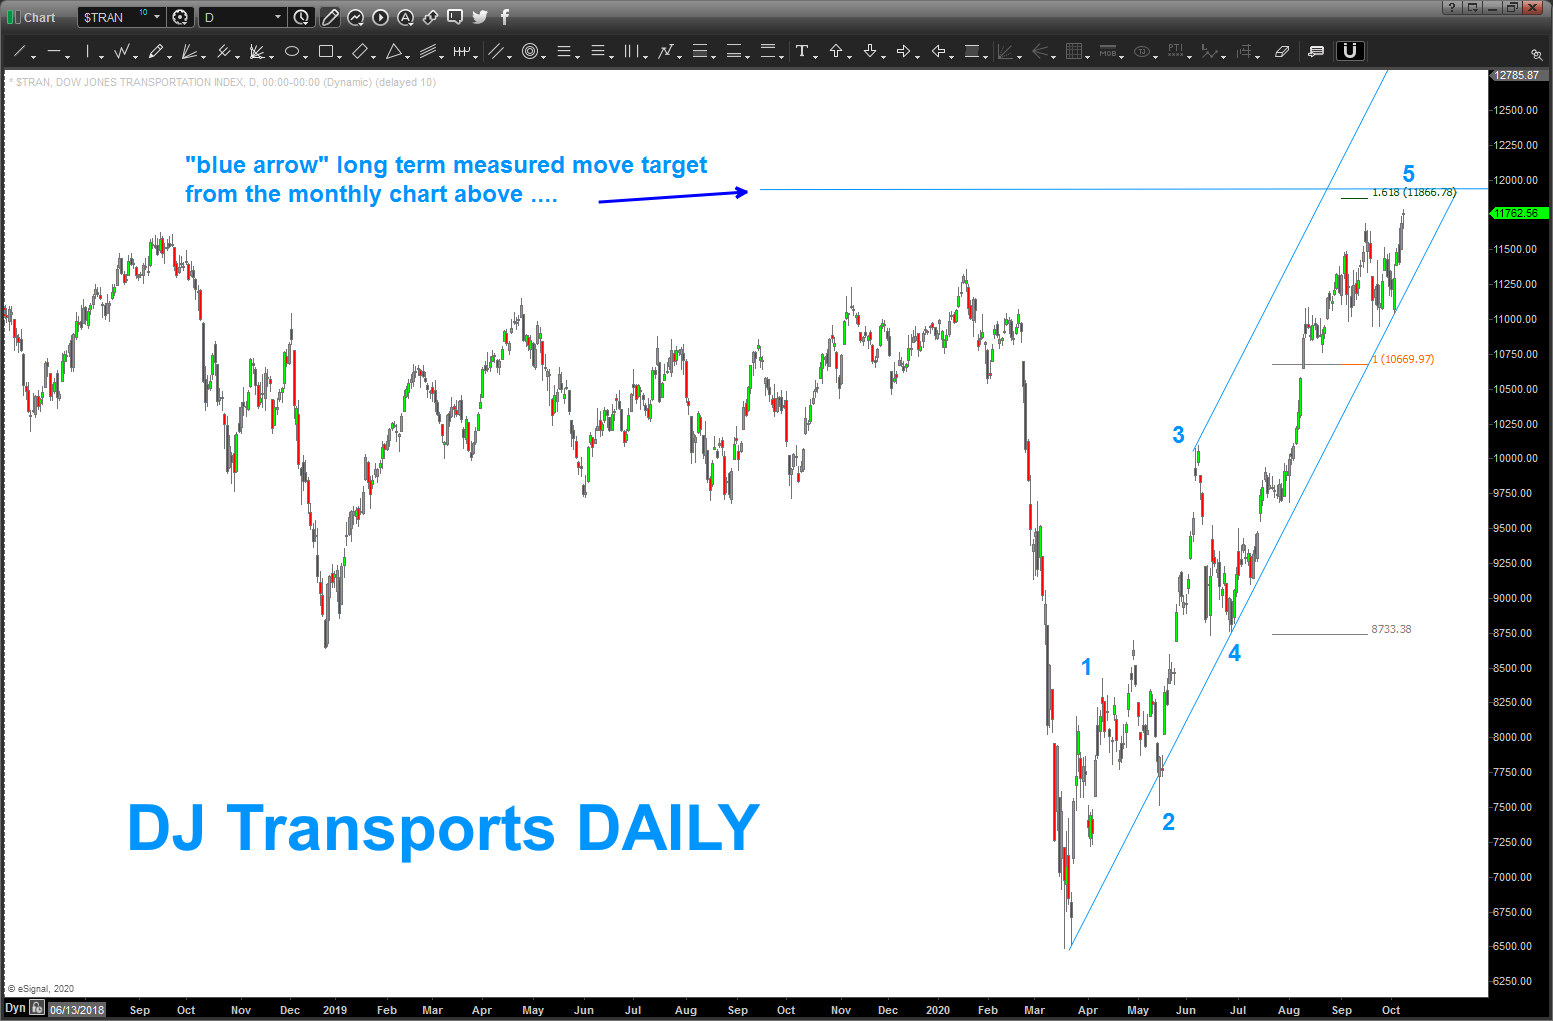
this long term level on the Transports is going to be REALLY interesting. HANG ON!
salute -Bart
