NASDAQ update
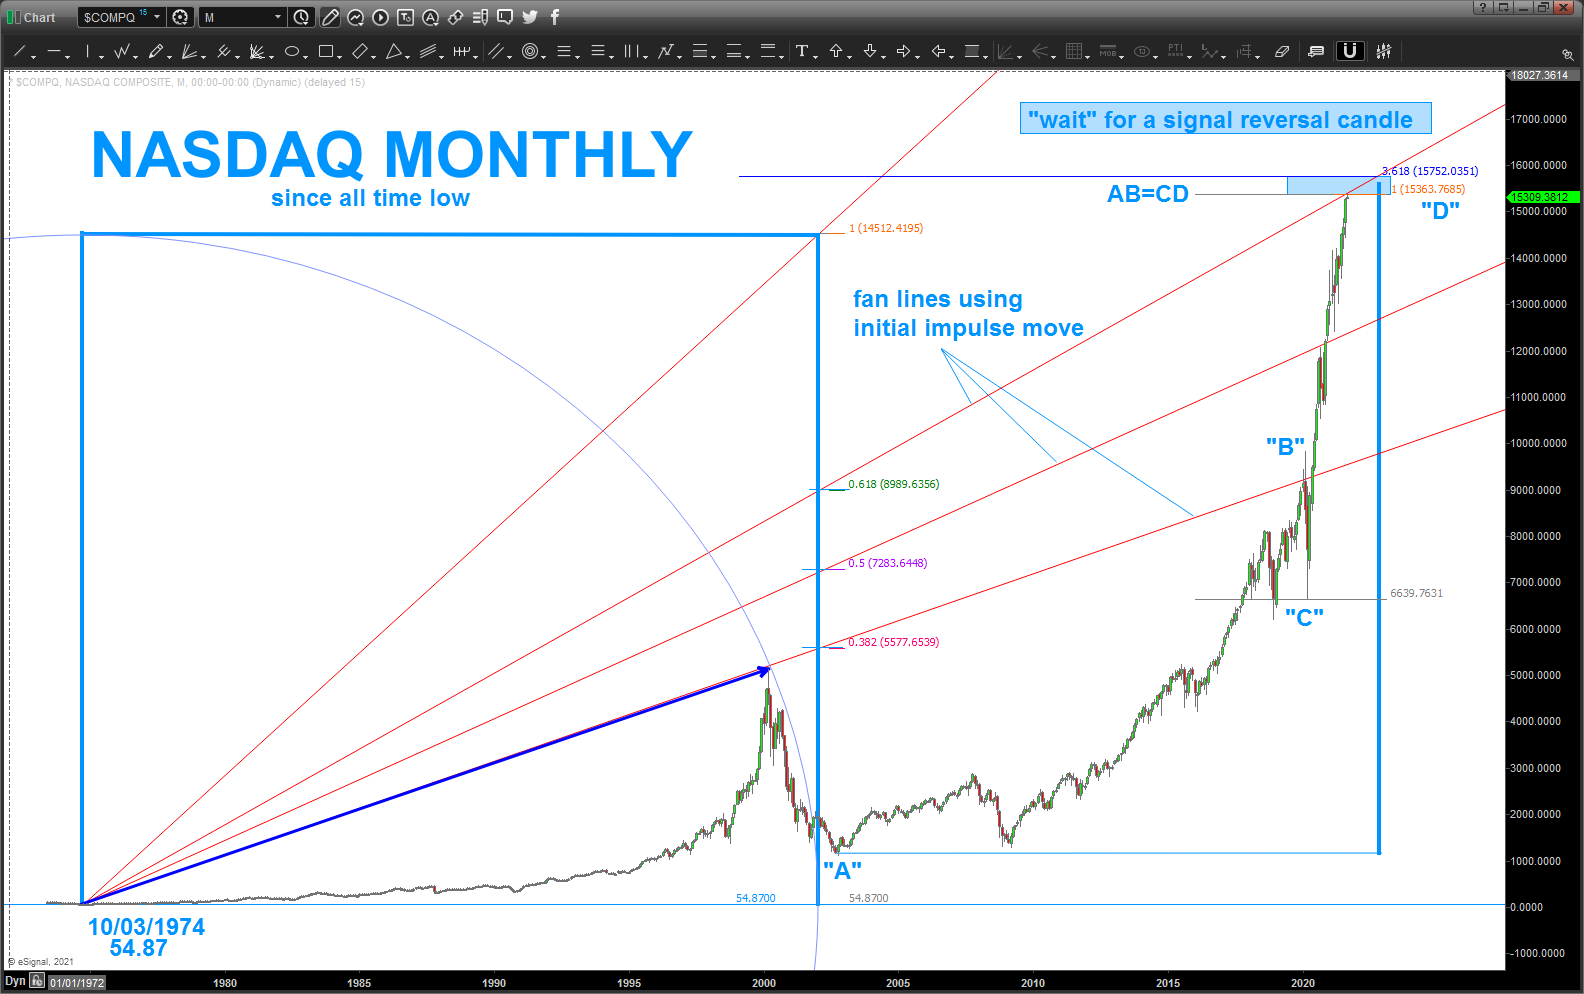
I redid my NASDAQ chart at the request of a friend .. the other night, when I posted it, I just drew the “AB=CD” and figured I would tighten it up over the weekend …I did tighten up the target w/ some more precision.
the AB=CD has been hit.
how did we get this target?
- from the low in 2002 we label A. The most recent 2020 highs are B and then C is the low after that pretty quick drop (note, it was one of the fastest percentage moves drop in history) from there we can calculate the AB=CD target. Appears to have been hit ..
- from the all low on 10/03/74 we draw the radius of the circle all the way to 2000 .. that’s a BIG rock hitting the water, isn’t it?
- from there we draw our circle … once we have the circle we can create the square based on said radius and that is bolded in BLUE.
- speed or fan lines originating from the all time low and being based on the geometry of the first impulse move are pretty powerful. as you can see I divided the length of the square into the usual ratio’s and then drew the fan lines from the all time low … take a look at the result.
- there is a lot going on w/ these lines and there is a lot more geometry that can be drawn but I don’t want to clog up the chart.
so, net net, pay close attention to the NASDAQ in/around here, fer shure … if the AB=CD pattern fails to the upside there are other targets that I’ll update but for now, this looks like something that we should REALLY pay attention to …