Patterns appearing all over the place …the only ones that count are the BANKS/FINANCIALS. They will lead us up and lead us down … bank on it … (get that?)
Let’s make this simple.
I’m watching a few things:
Banks/Financials – they always lead us UP and they always lead us DOWN. They are approaching major targets. BUT WAIT – the European Financials just BLEW THREW 2 projections and a retracement level. (see below) – are they going to vacuum the banks/financials in the US w/ them … if they do, we ain’t going down folks. HOWEVER, if the banks/financials start down, then you might think of getting VERY conservative. We’ll find out in a few days or so, I suspect.
XLP/NYA – held for now. That’s ‘bearish’ for stocks but if we lose that 13 year support line then these stocks could take off higher. DO NOT BE LONG THE STOCKS WHEN THE PATTERN COMPLETES LOWER ..for now, see what this important ratio does.
I’m also watching the strength in Junk Bonds – junk bonds go up – it’s game on folks and they have yet to break down.
At the end of this post, take note of the Japanese Yen … sure looks like it wants to get stronger and remember the last time THAT happened?
Last – might want to go load up on some coffee. Coffee futures are rolling thru a long term projection.
Bring on the Charts!
forgot to label, the chart below is Copper Futures
gold and silver approaching/ at KEY sell patterns. The “p’s” looking like they are getting to run higher – Palladium and Platinum
Some very interesting and potential significant PATTERNS about to be hit on the metals. While the ‘energy’ of the Gold and Silver markets is such that they will NEVER go down … they might not, but we have some long term patterns to contend w/ before I’m all in …
Palladium showing some support off the .786 – maybe watch this one on the first pullback?
Across the board, the metals are hitting big sell signals. As is the case w/ PATTERNS, we really DO NOT know which ones will work and which ones won’t … but when they all pretty much lineup like they all are now, then something ‘big’ usually occurs.
Mind you, the ‘big’ can be PATTERN failures across the board (the sell signals all fail w/ a daily close above the levels shown below) OR the PATTERNS work and the metals are at a pretty big inflection point and …down they go.
This is a VERY interesting time w/ regard to the ‘circle of life’ (fixed income, FX, equities (global and CONUS) and commodities) … it’s really not a simple bet right now.
I posted yesterday about Gold. I mean, folks, it really doesn’t get any better than this. Long term ABCD’s are BIG DEALS. That, coupled w/ the rest of the metal sell patterns shown below, will make you realize that this is THE inflection point for the next couple months or, perhaps, year (s).
Copper – BTW – where is Copper? W/ the move occurring in the equities, shouldn’t copper be following? It’s barely made a .382 – hmm. PS – this is a VERY nice PATTERN – ABCD, .382+.618 confluence and 1.4142 extension.
it’s all about the data folks … in this case we have a monthly continuous contract of Copper Futures. the PATTERN into the low back in 1990-2000 (yes it took 10 years to complete .. read that again – 10 years) is hard to understand w/out anymore data to the left of it’s beginning so it’s hard to figure out if the high in 2010 was a big 3 or big 5.
thus, I’m going to outline two scenarios ..one bearish one bullish.
BEARISH: replace the big bright orange question mark w/ a bigger 5. IF that is the case THEN the most recent high was completing a B wave and we have started a C wave down … C waves are freight trains of beauty and a wonder to behold .. leave nothing in their wake. stand by …
now, hold the phone, what if the big bright orange question mark is/was a 3? then, the BULLISH scenario is we just finished wave 3, are correcting wave 4 and copper is a BUY into new highs … it’s still working it’s way thru the corrective PATTERN that will appear so it’s hard to make a projection but we should NOT go below (1) as that will violate a rule …
so, for now, take note of the blue arrows .. the all time high was, yup, an AB=CD staring from May 1999. It smacked right into that …
kind of in no mans land from a count perspective due to data but expect the two red horizontal lines to act as support due to the polarity principle …
Happy Fathers Day …
also, note EEM .. smacked into a nice target zone in/around 58 and the second chart shows the daily sell signal on EEM.
minor EEM sell pattern on the daily …
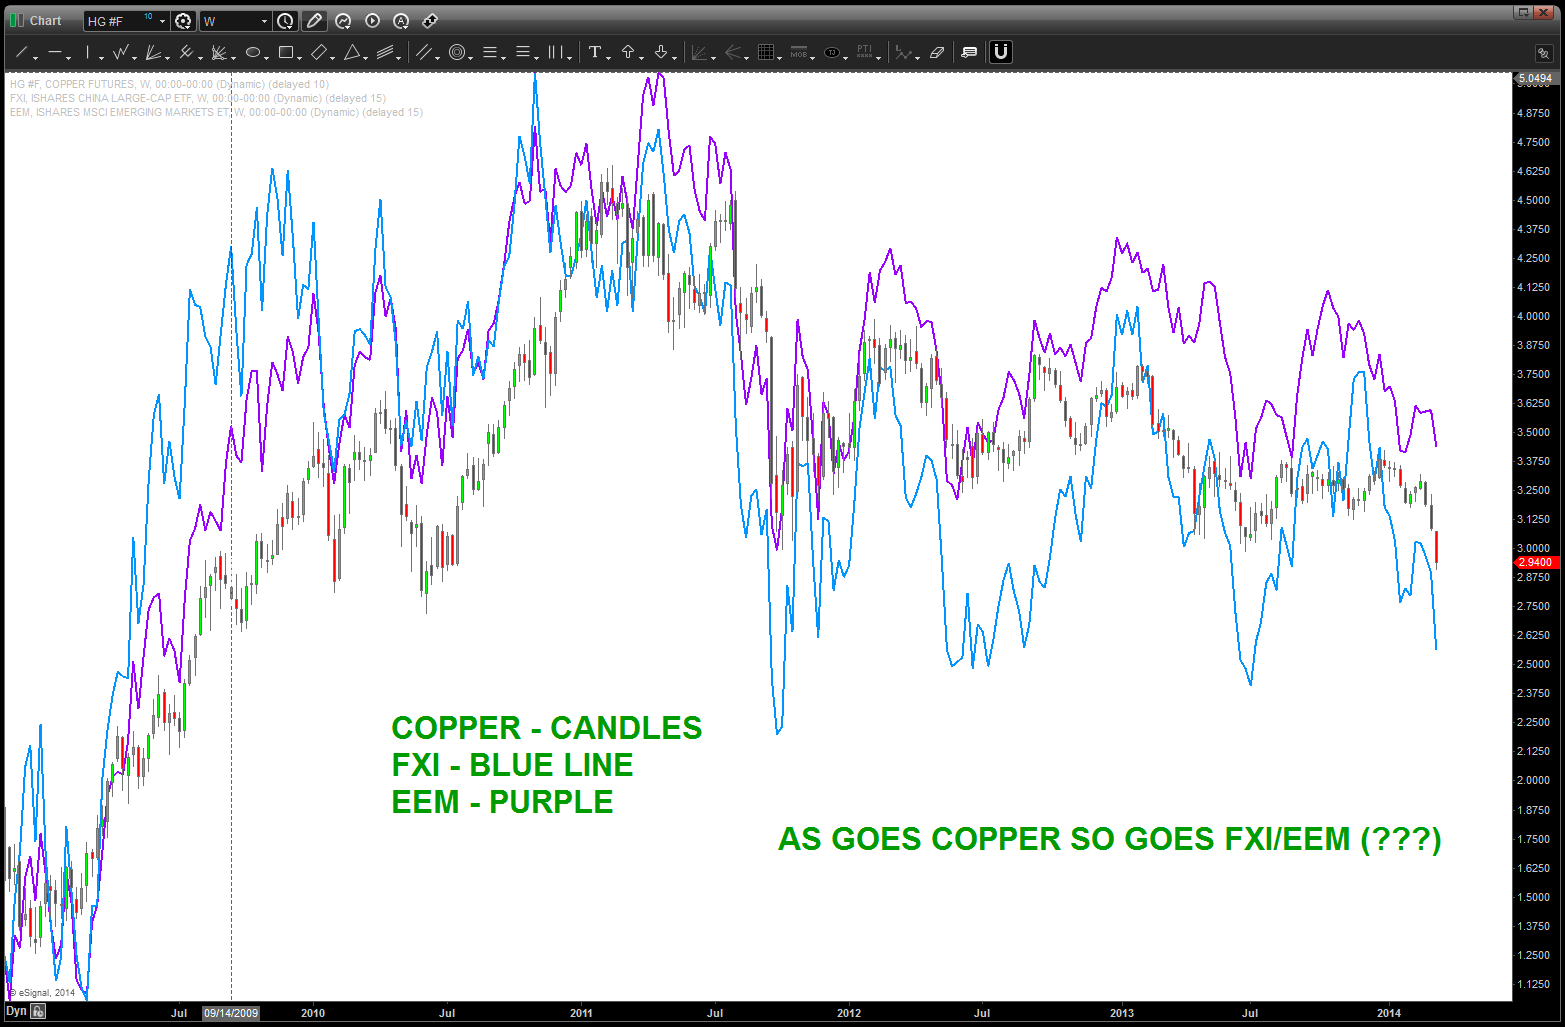
last, note the synchronicization between copper and emerging markets … pretty nice correlation.
last, note the FXI (china) has NOT made new highs while Copper and EEM have .. below you can see that high/low inflection points are nicely timed by the Chinese ETF …
so, for now, expect copper weakness for the next couple weeks then we can figure out where we might be from a count. if anyone has really long term copper data please let me know.
Update 02/23/2021 – the “sell zone” failed but, if you do look at the chart it basically held copper at bay for approximately 7-8 weeks, then exploded higher, just like the stock market. the past couple days I’ve been posting a LOT of 5 counts and took a peak at copper and smacked right into another higher target … yes, we have some strong thrust into this zone it’s something to take notice of ….. why? If the 5 counts are actually ending then this current level is what should hold copper, it’s that simple. If copper explodes higher, which it most certainly can, then I am hard pressed to find a reason for the equities to go down.
note – WATCH THIS COPPER LEVEL!
a common relationship exists based on 1.618*the wave. in this chart just hit that target, exactly
Copper,/ below, smacked right into the “SELL ZONE” … why is Copper being blogged about? Isn’t that a “who cares” type of metal? Ummmm, no. the inflection that occurs in copper has occurred in the stock market, as shown, on every major pivot since 2009, at a minimum. /
so, this “zone” is very important …. watch copper in the coming days/weeks to get a “feel” for the overall health of the market.
————————————————————–
if you’ve been following my blog you know I’ll say “I love Elliott Wave, when it works…!” for Copper it certainly has. one of my first blog posts was about absolutely nailing the low at 4 by using, you guessed it, Elliott Wave.
is it going to work again … I really have no idea. that being said, if we follow the standard Elliott corrective construction, certainly looks reasonable that Dr. Copper is finishing a trend defining “b wave” and, just perhaps, a monstrous “c wave” cometh ….
The S&P 500 has been climbing a stairway to Heaven ..
folks coming into 2015 we had some pretty strong patterns appearing. some worked and some didn’t – isn’t that what we expect? that being said, it was prudent to be cautious due to their presence.
here’s what I posted around a year ago:
“Let’s don’t jump up and down and scream the BEAR MARKET is here till this chariot of the bulls breaks a swing low.”
so, while we’ve sold off for the past couple days let’s not go crazy. we have broken ONE swing low and that’s it, and it’s ONLY a weekly. WE HAVE NOT BROKEN A MONTHLY SWING LOW.
so, keep it ALL context of the big picture. We break a swing low on a MONTHLY and then a second then we have “issues.”
but for now, EVERYONE knows this puppy was on steroids and need some shaking out so let’s look for a pattern to BUY on a weekly (hint hint – it needs to breathe a bit) and if a bear I would still be very cautious.
what do we know and see … ?
we know a weekly swing low is about to be taken out and we’ll know that ONLY WITH THE CLOSE TOMORROW … we also know this has NEVER happened since March 2009 bull market began.
so, here’s the logic:
if weekly close below a swing low … get defensive.
if not, then keep in mind, we have pressure on the downside and it probably needs to breathe down so just chill …
enjoy the post below .. you’ll see some of the patterns were early, some were spot on. that’s not the point .. the entire post below is around the market action around a SWING LOW or SWING HI and to respect them — very very strongly.
let me know if you have any questions.
chart below is the ES .. note the red horizontal swing lows. those have never been broken on close. it might happen tomorrow …
Bart
S&P Futures Swing Lows since 2009
As we have discussed multiple times in this venue, the move since 2009 has been one heck of a ride. This chariot of stock market emotion is, literally, off the charts. It is at an extreme that has surpassed 1929, 2000 and 2007. For the past 6 months it has defied the powerful cycles and patterns we follow. However, we are at another “potential” inflection point and based on this weeks price action the chariot appears to be running out of gas. So, objectively, the cycles and patterns we follow appear to be working. Let’s don’t jump up and down and scream the BEAR MARKET is here till this chariot of the bulls breaks a swing low.
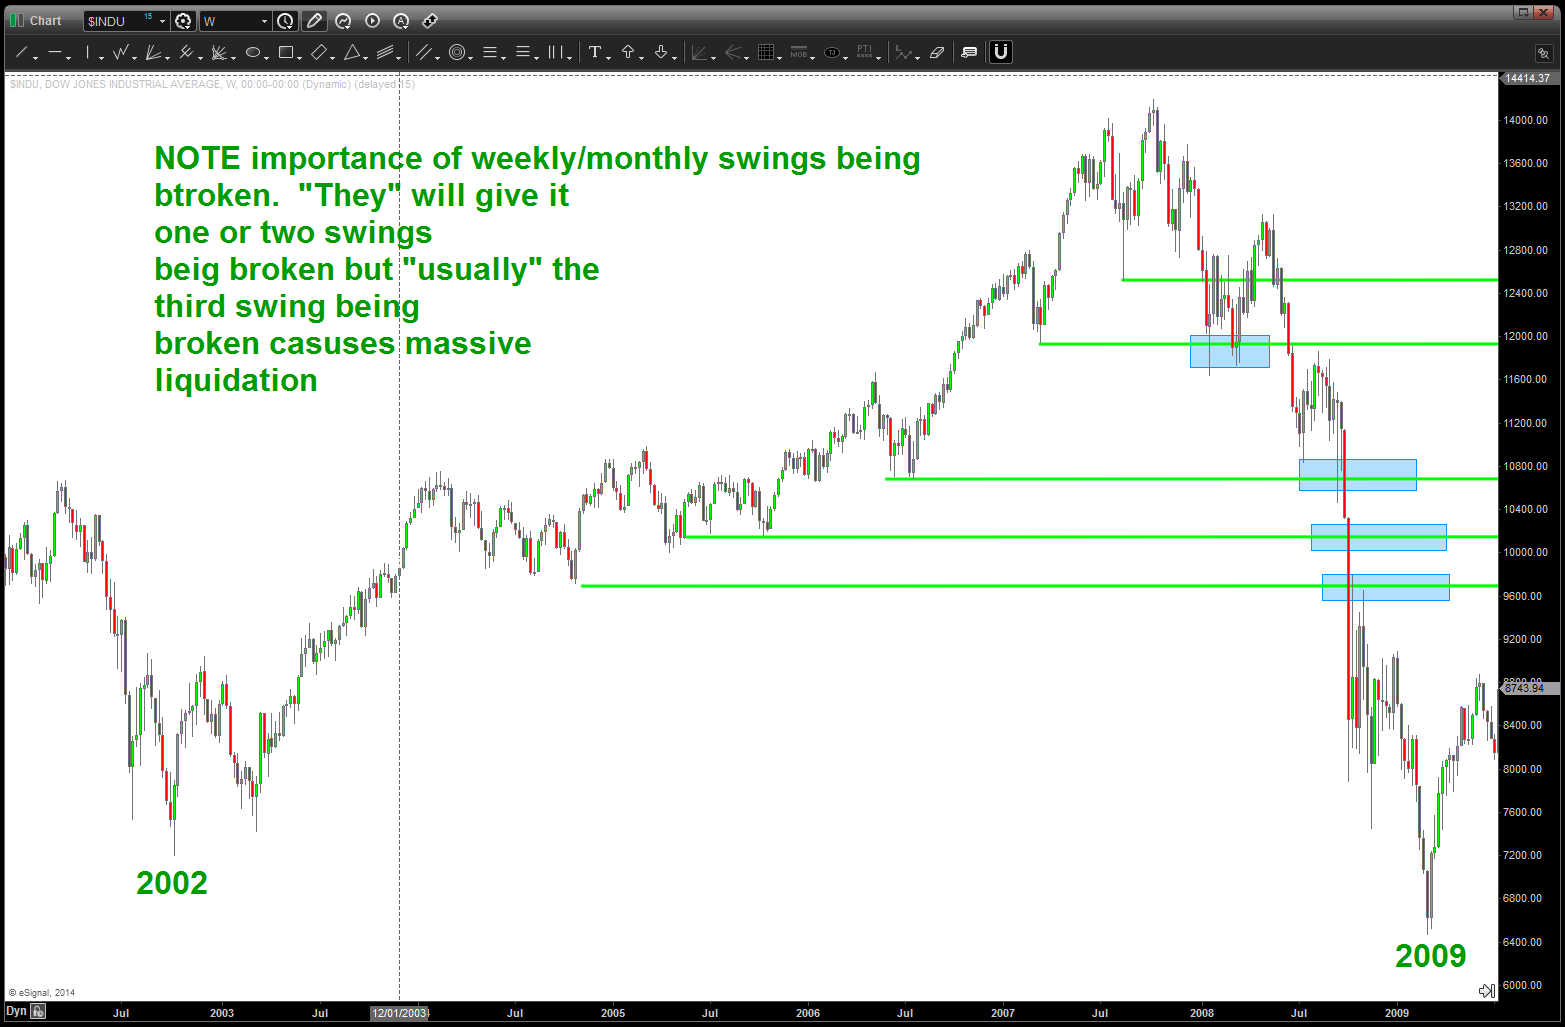
Below you’ll see a quick demonstration of the Dow Jones Industrial Average from 2002-2009. No patterns shown but just an example of the power of the swing low. Take note, when we lose one swing low there is usually some selling and then it bounces back and, here’s the key point,it fails to make a new high.Price might congest in this area (going either direction – up or down) and then it starts down. One thing to watch is “usually” the third swing low. When that gives away, selling is vicious. So, as much as we see MAJOR patterns completing let’s not get to confident. THE MAJOR US INDICES HAVE NOT BROKEN ONE SWING LOW IN 5 YEARS. Over the coming weeks, pay attention to these swing lows and swing highs (note the VIX chart – not one swing high has been taken out since 2007!)
Also, note the Dollar Index swing low track record and the very thin neckline that is coming into play a little lower. We’ve reached some daily extremes in metals (Gold, Silver) and the Euro and Pound. Sentiment means nothing when a multi year extreme is taken out and one that has been tested roughly 10 times since 2012. Folks, a lot of stops are hiding beneath 78-79 on the dollar index. Certainly hope support holds here …
so, keep an eye on the swing lows and highs over the coming days and weeks … note price action after a first or second swing low is taken out and, seriously consider safety if/when a 3rd long term swing low is taken out to the up or down side ….
August 30, 2014: the CLIFF NOTES is we are at a crucial point for the EEM, FXI and Copper. Patterns suggest a bearish stance is prudent.
The bottom line is the neckline shown in FXI and EEM did not break and a very strong rally has taken place. That being said, BASED ON THE VERY BEARISH COUNT OF COPPER ON A LONG TERM BASIS, believe the EEM, FXI and Copper should start back down again. The charts will show the PATTERNS. Right now, I remain BEARISH on the FXI and the EEM because of the LONG TERM TOP in COPPER. Note, divergence is present in the recent price action. So, even thought they (FXI, EEM) have been linked very strongly to Copper, this linkage could be broken and they are now decoupled. With recent price action this is a distinct possibility. Let’s see if the patterns shown on EEM and FXI fail before we come to this conclusion.
note the CLOSE correlation of Copper and EEM for a “pretty long” time
EEM sell pattern …
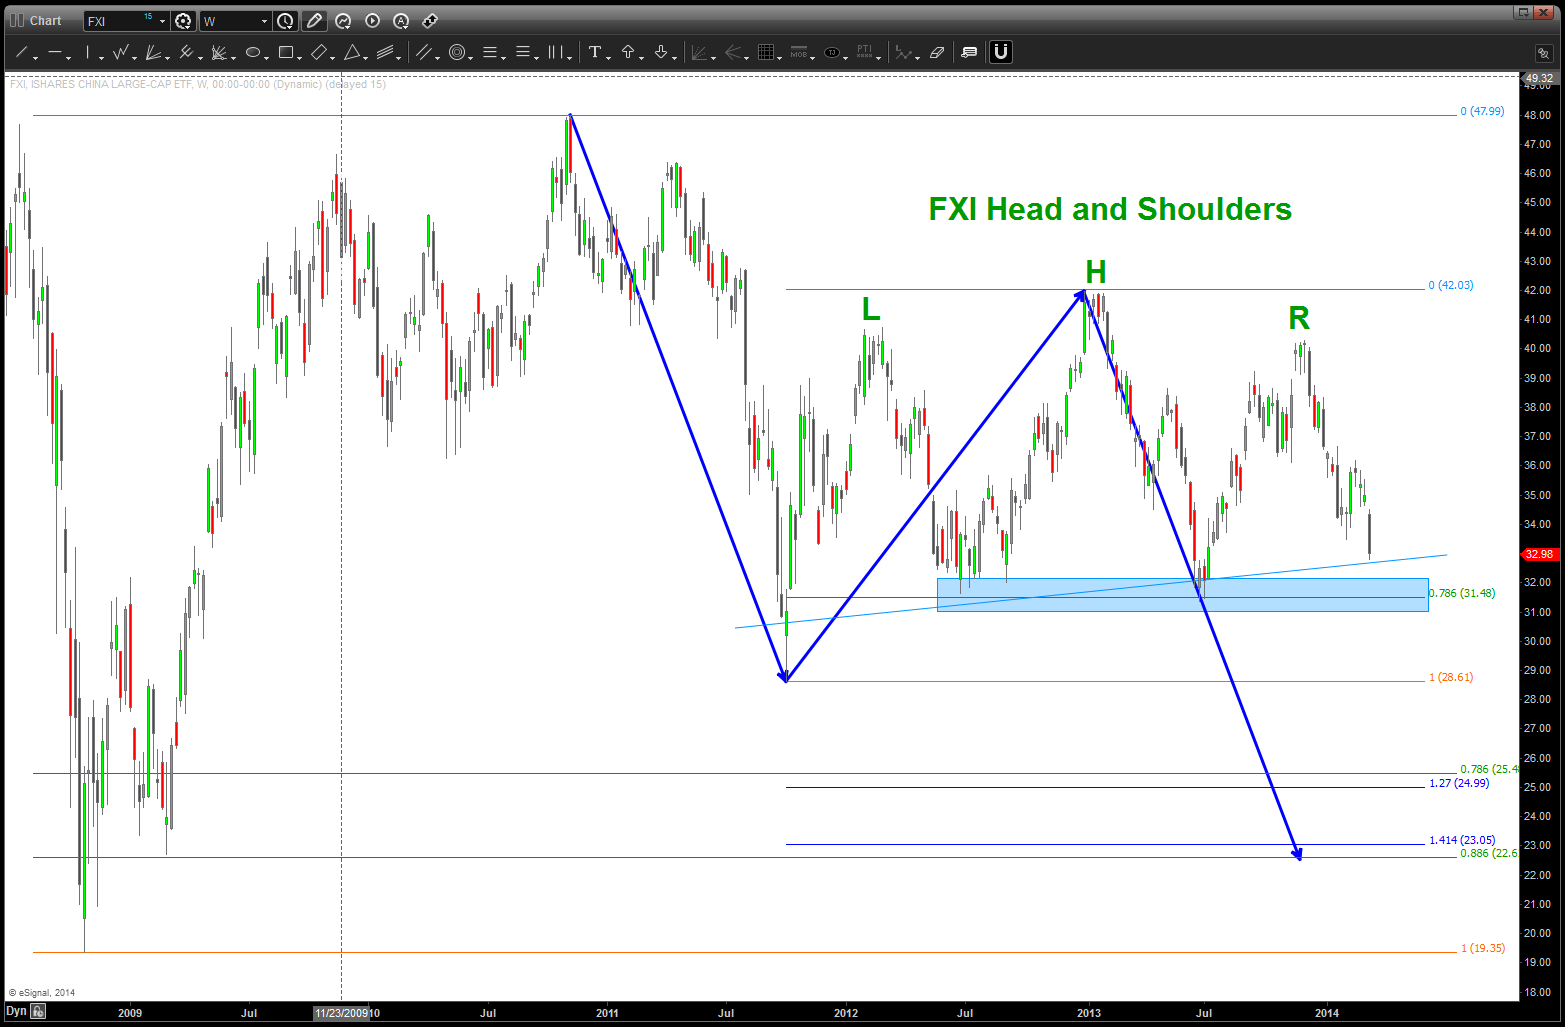
FXI sell pattern complete
Here is the bottom line of these markets (EEM/FXI, COPPER) – If the point labeled 5 below was NOT the high (but a little higher on copper around 5 is the actual target) then these patterns will fail and we’ll see another move higher and I will update new targets. RIGHT NOW – behave/manage risk like the 5 on the chart below is 5 – and folks it’s a long term 5 – then the EEM, FXI and Copper securities should be starting down in/around here. DOES THAT MAKE SENSE? Enjoy the Labor Day weekend w/ family and friends.
note a POTENTIAL for an ENORMOUS top in place for Copper 1,2,3,4,5
one last, note below the relative strength RATIO of EEM / SPY. Since 2010, on a relative basis the EEM has been getting smoked by the S&P500 as a whole. Also, note that the .618 retrace supported, for a while, but the broke and is now the REASON for the resistance. A little lower (blue shaded rectangle) is a NICE target to potential watch for a flow of funds into the EEM. Would hold off for now BUT do watch closely as we did break above the median trend line (like in the end of 2012 – which was defeated – blue arrow) and we should start down now w/ the SELL patterns present.
Relative Strength of EEM / SPY
Rock on, ok?
Bart
March 13, 2014:
CLIFF NOTES: the move in copper should not be surprising // we are correcting a multi-decade 5 waves up complete. This has shown to put pressure on emerging markets and china. All according to the script.
if you would like to search for “copper” on this blog you will see that we have had a bearish stance for a good couple of years. A strong case can be made that Copper finished a multi-year 5 waves UP and is now undergoing a potentially very violent correction. if you also click on this link you will see the correlation between FXI (chinese ETF) and EEM (emerging markets ETF) and Copper : http://bartscharts.com/2014/02/01/copper-and-the-emerging-markets-eem-etf/ also here are the highs and lows in Copper: http://bartscharts.com/2013/12/20/the-copper-script/
The most recent breakdown in copper does not play well for FXI or EEM.
CLIFF NOTES: the probability is high that we break the key support line in/around 3.0 that has been holding copper up since 2010.
CLIFF NOTES 2: here is the link to the “Copper Script Part I” to watch how a BUY was recommended in the midst of the crash in 2009: http://bartscharts.com/2013/12/20/the-copper-script/
Note, a potential gameplan is shown by the light blue lines …
As we have discussed multiple times in this venue, the move since 2009 has been one heck of a ride. This chariot of stock market emotion is, literally, off the charts. It is at an extreme that has surpassed 1929, 2000 and 2007. For the past 6 months it has defied the powerful cycles and patterns we follow. However, we are at another “potential” inflection point and based on this weeks price action the chariot appears to be running out of gas. So, objectively, the cycles and patterns we follow appear to be working. Let’s don’t jump up and down and scream the BEAR MARKET is here till this chariot of the bulls breaks a swing low.
Below you’ll see a quick demonstration of the Dow Jones Industrial Average from 2002-2009. No patterns shown but just an example of the power of the swing low. Take note, when we lose one swing low there is usually some selling and then it bounces back and, here’s the key point,it fails to make a new high.Price might congest in this area (going either direction – up or down) and then it starts down. One thing to watch is “usually” the third swing low. When that gives away, selling is vicious. So, as much as we see MAJOR patterns completing let’s not get to confident. THE MAJOR US INDICES HAVE NOT BROKEN ONE SWING LOW IN 5 YEARS. Over the coming weeks, pay attention to these swing lows and swing highs (note the VIX chart – not one swing high has been taken out since 2007!)
Also, note the Dollar Index swing low track record and the very thin neckline that is coming into play a little lower. We’ve reached some daily extremes in metals (Gold, Silver) and the Euro and Pound. Sentiment means nothing when a multi year extreme is taken out and one that has been tested roughly 10 times since 2012. Folks, a lot of stops are hiding beneath 78-79 on the dollar index. Certainly hope support holds here …
so, keep an eye on the swing lows and highs over the coming days and weeks … note price action after a first or second swing low is taken out and, seriously consider safety if/when a 3rd long term swing low is taken out to the up or down side ….