Inflection point for bearish or bullish EEM / FXI now
August 30, 2014: the CLIFF NOTES is we are at a crucial point for the EEM, FXI and Copper. Patterns suggest a bearish stance is prudent.
The bottom line is the neckline shown in FXI and EEM did not break and a very strong rally has taken place. That being said, BASED ON THE VERY BEARISH COUNT OF COPPER ON A LONG TERM BASIS, believe the EEM, FXI and Copper should start back down again. The charts will show the PATTERNS. Right now, I remain BEARISH on the FXI and the EEM because of the LONG TERM TOP in COPPER. Note, divergence is present in the recent price action. So, even thought they (FXI, EEM) have been linked very strongly to Copper, this linkage could be broken and they are now decoupled. With recent price action this is a distinct possibility. Let’s see if the patterns shown on EEM and FXI fail before we come to this conclusion.
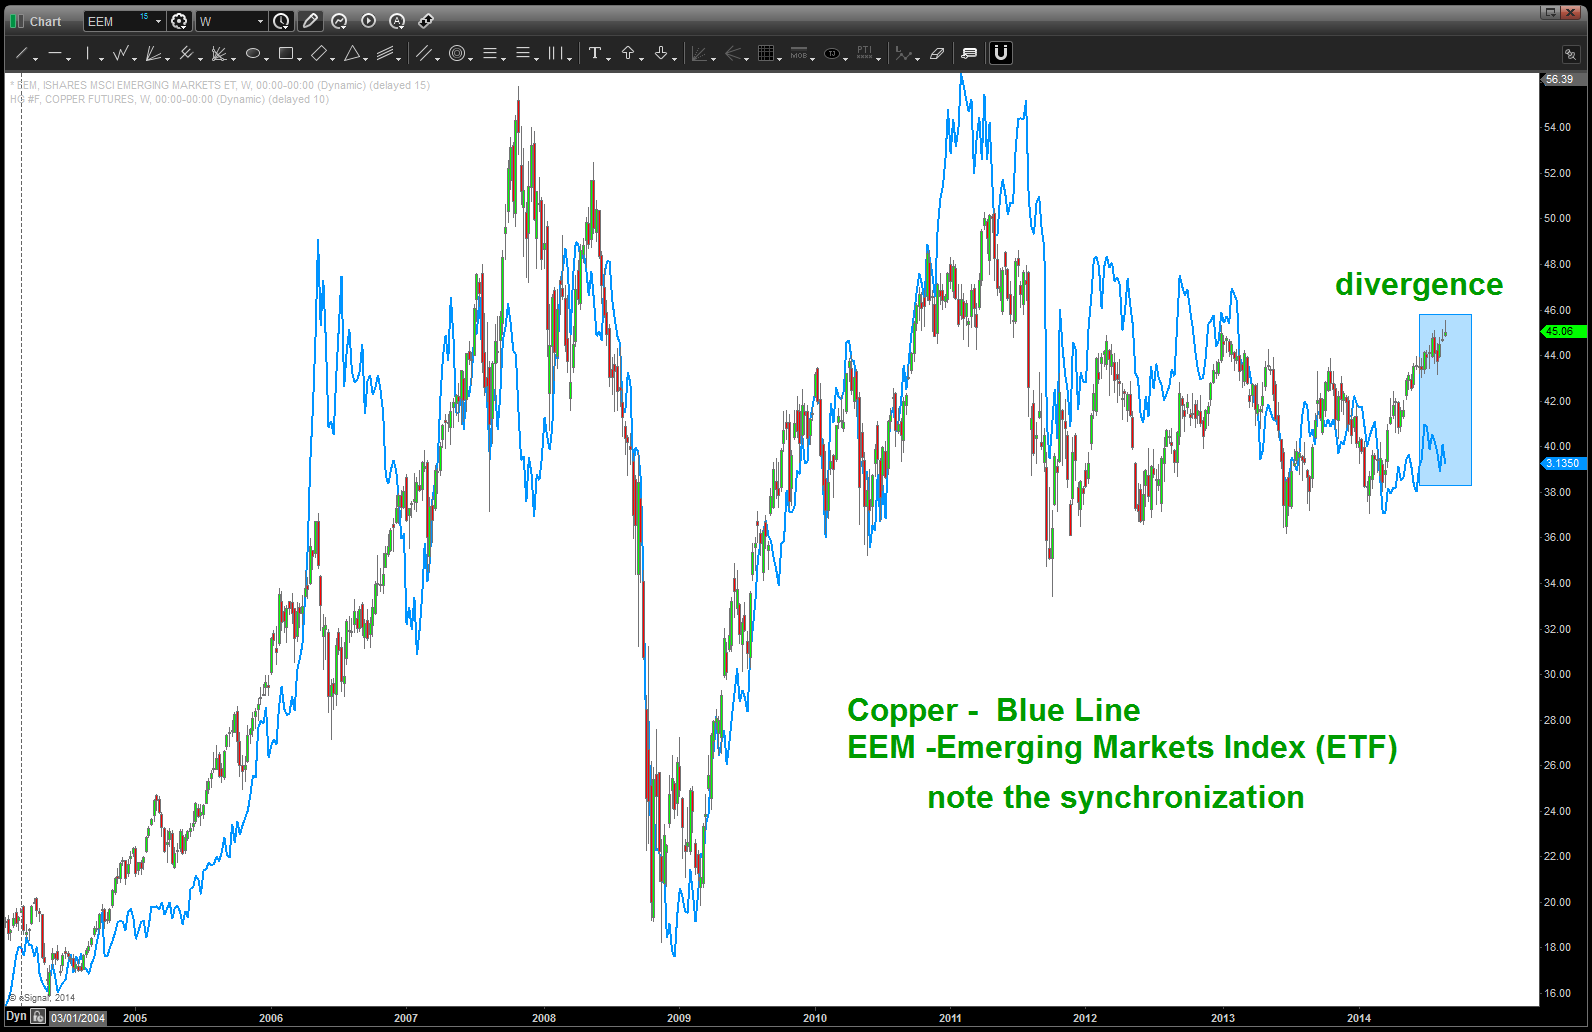
note the CLOSE correlation of Copper and EEM for a “pretty long” time
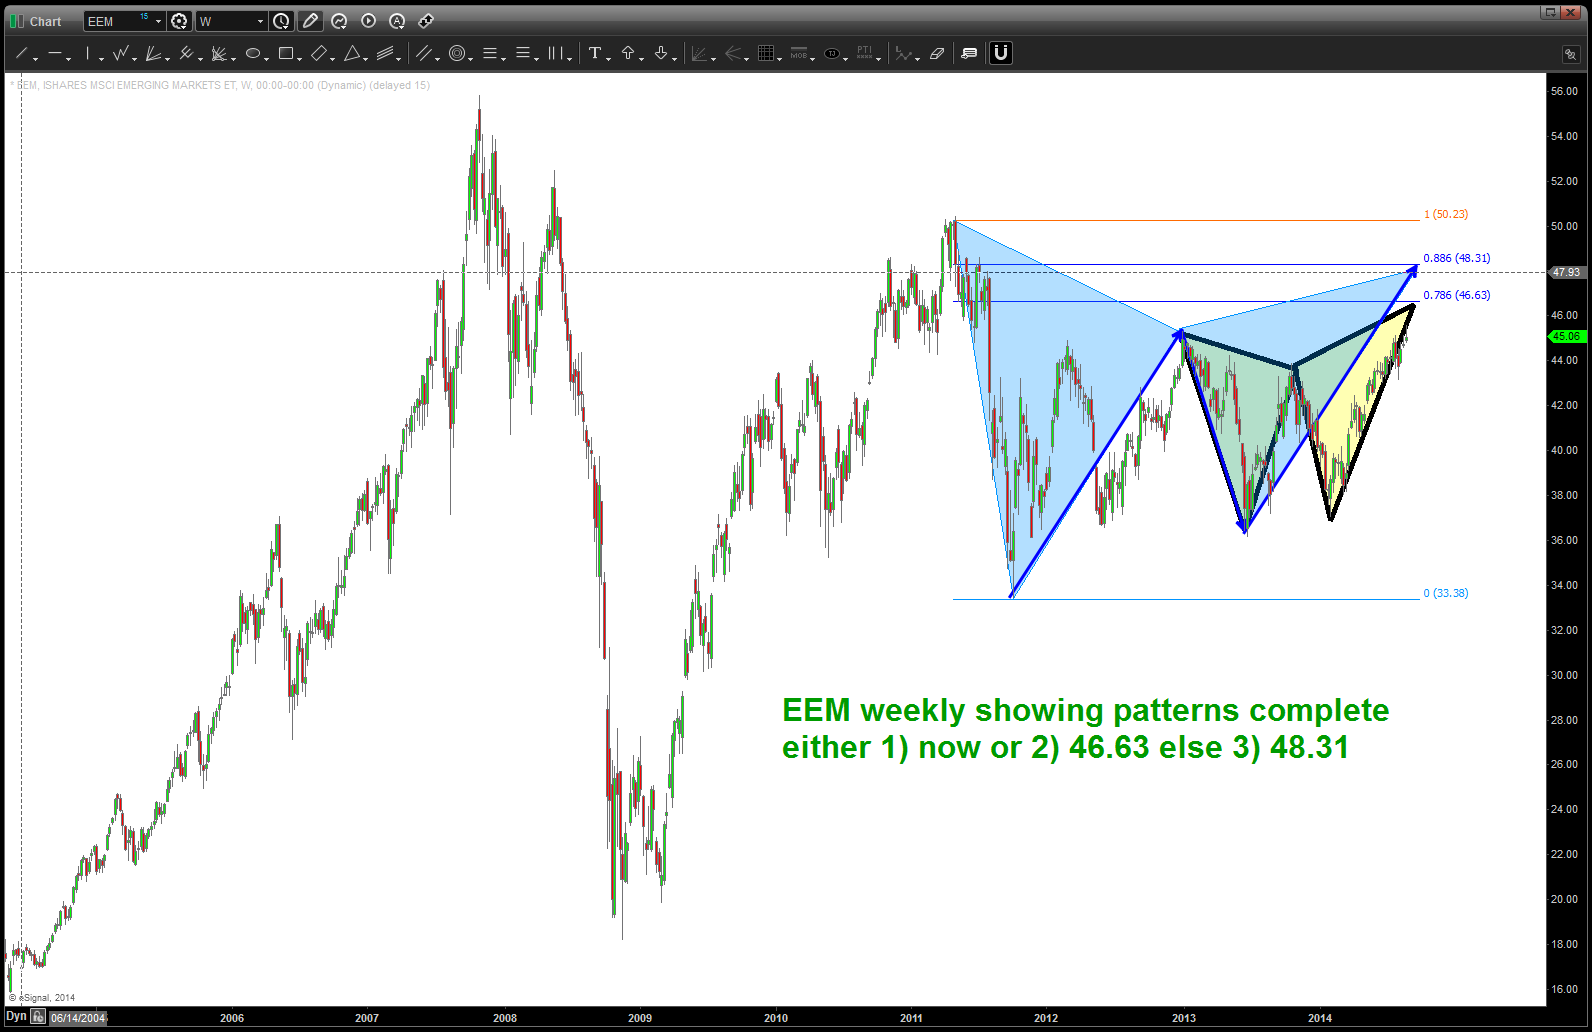
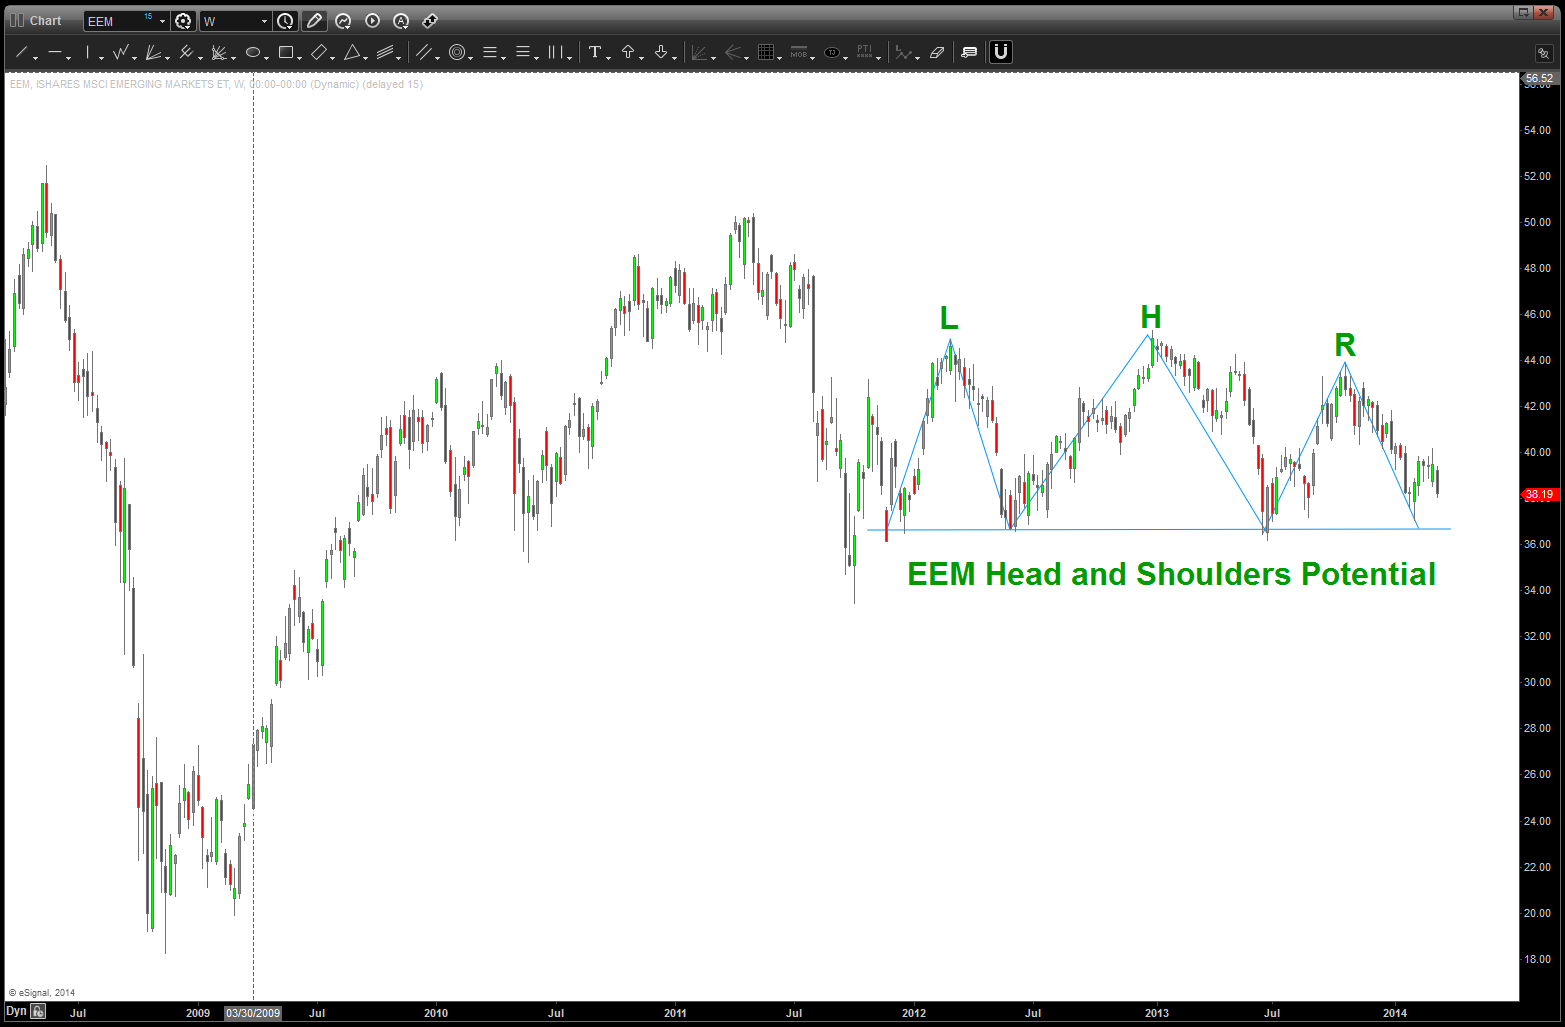
EEM sell pattern …
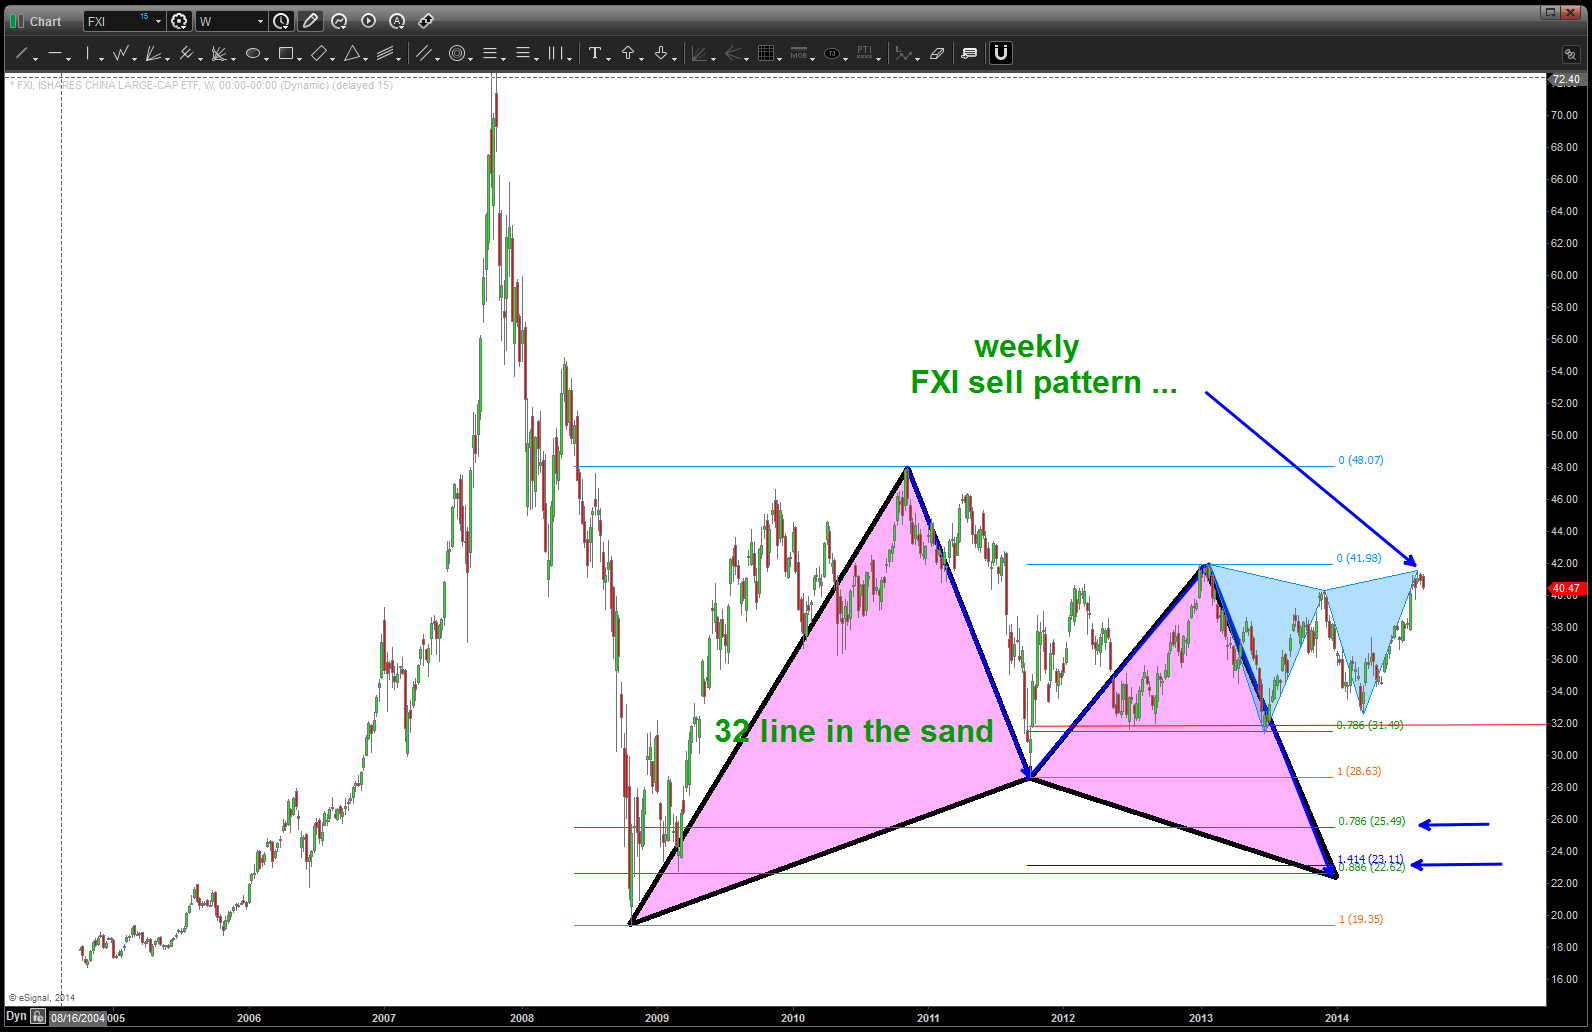
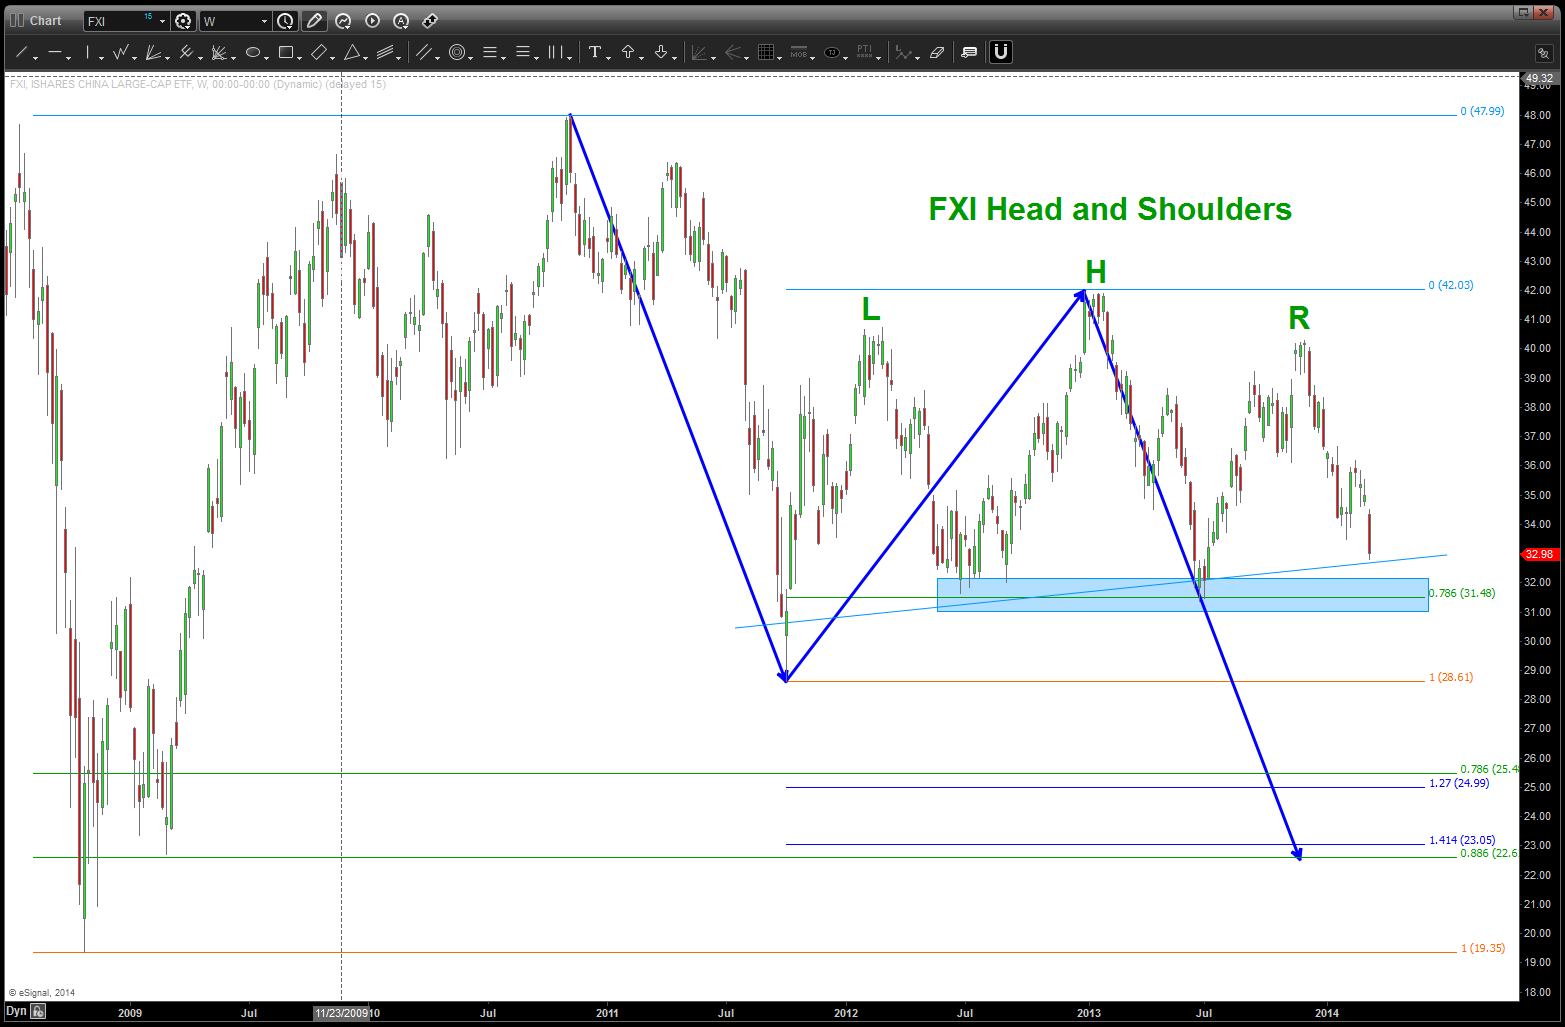
FXI sell pattern complete
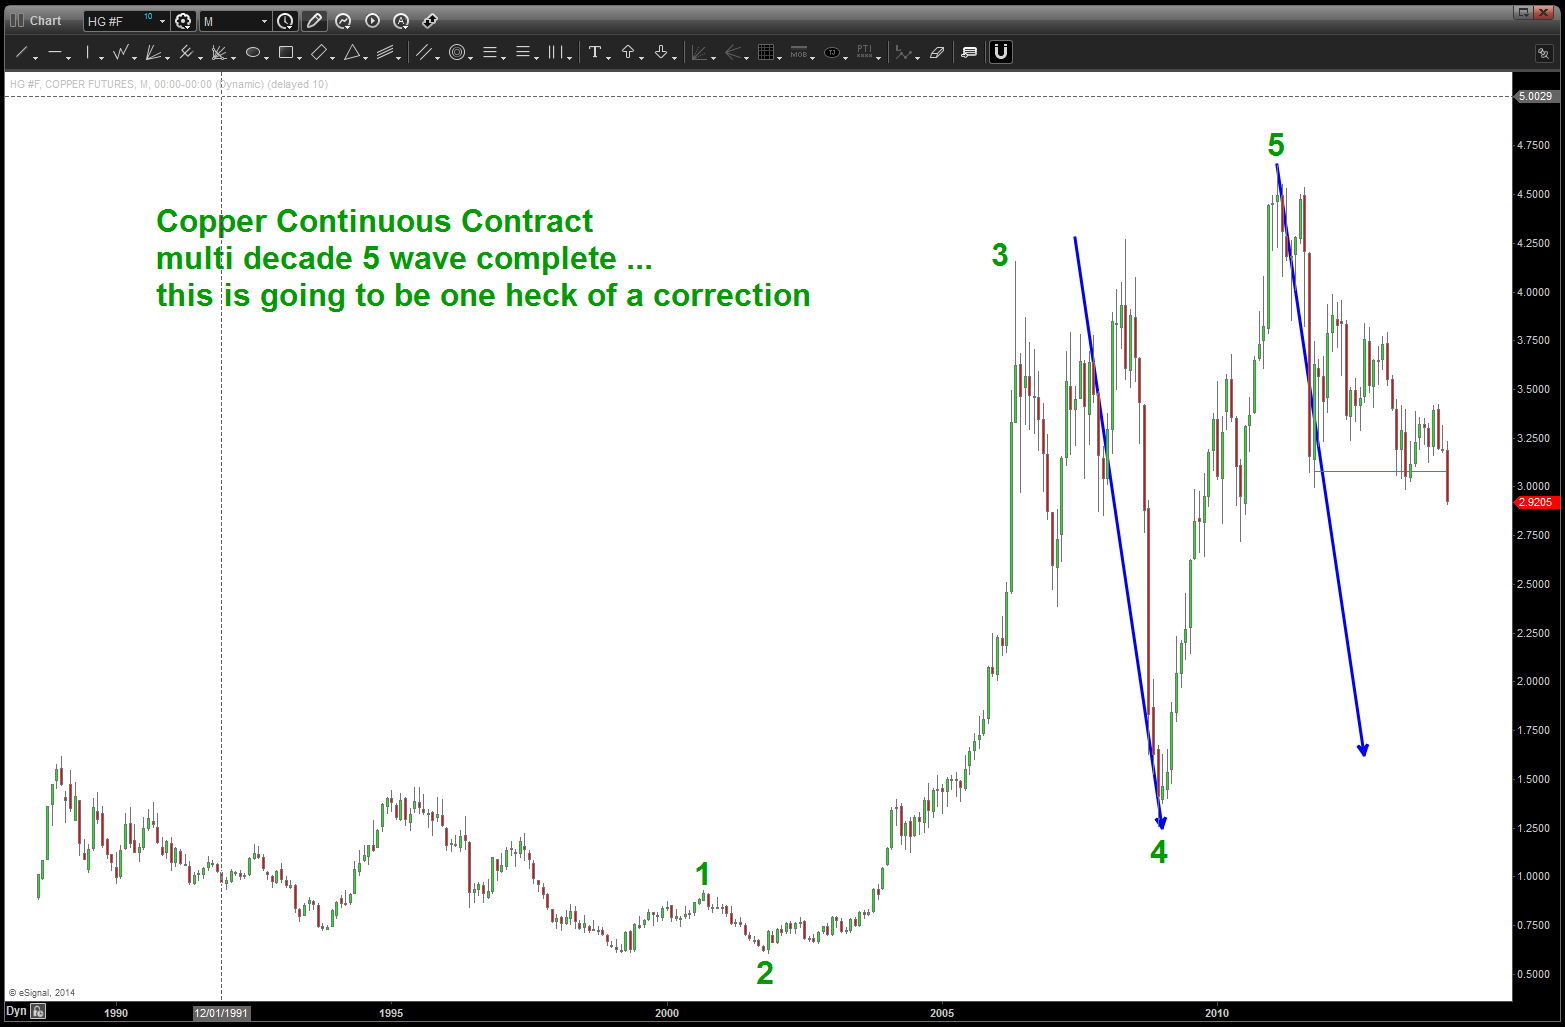
Here is the bottom line of these markets (EEM/FXI, COPPER) – If the point labeled 5 below was NOT the high (but a little higher on copper around 5 is the actual target) then these patterns will fail and we’ll see another move higher and I will update new targets. RIGHT NOW – behave/manage risk like the 5 on the chart below is 5 – and folks it’s a long term 5 – then the EEM, FXI and Copper securities should be starting down in/around here. DOES THAT MAKE SENSE? Enjoy the Labor Day weekend w/ family and friends.
please see this post to see why the high in copper is so important: https://bartscharts.com/2013/12/20/the-copper-script/
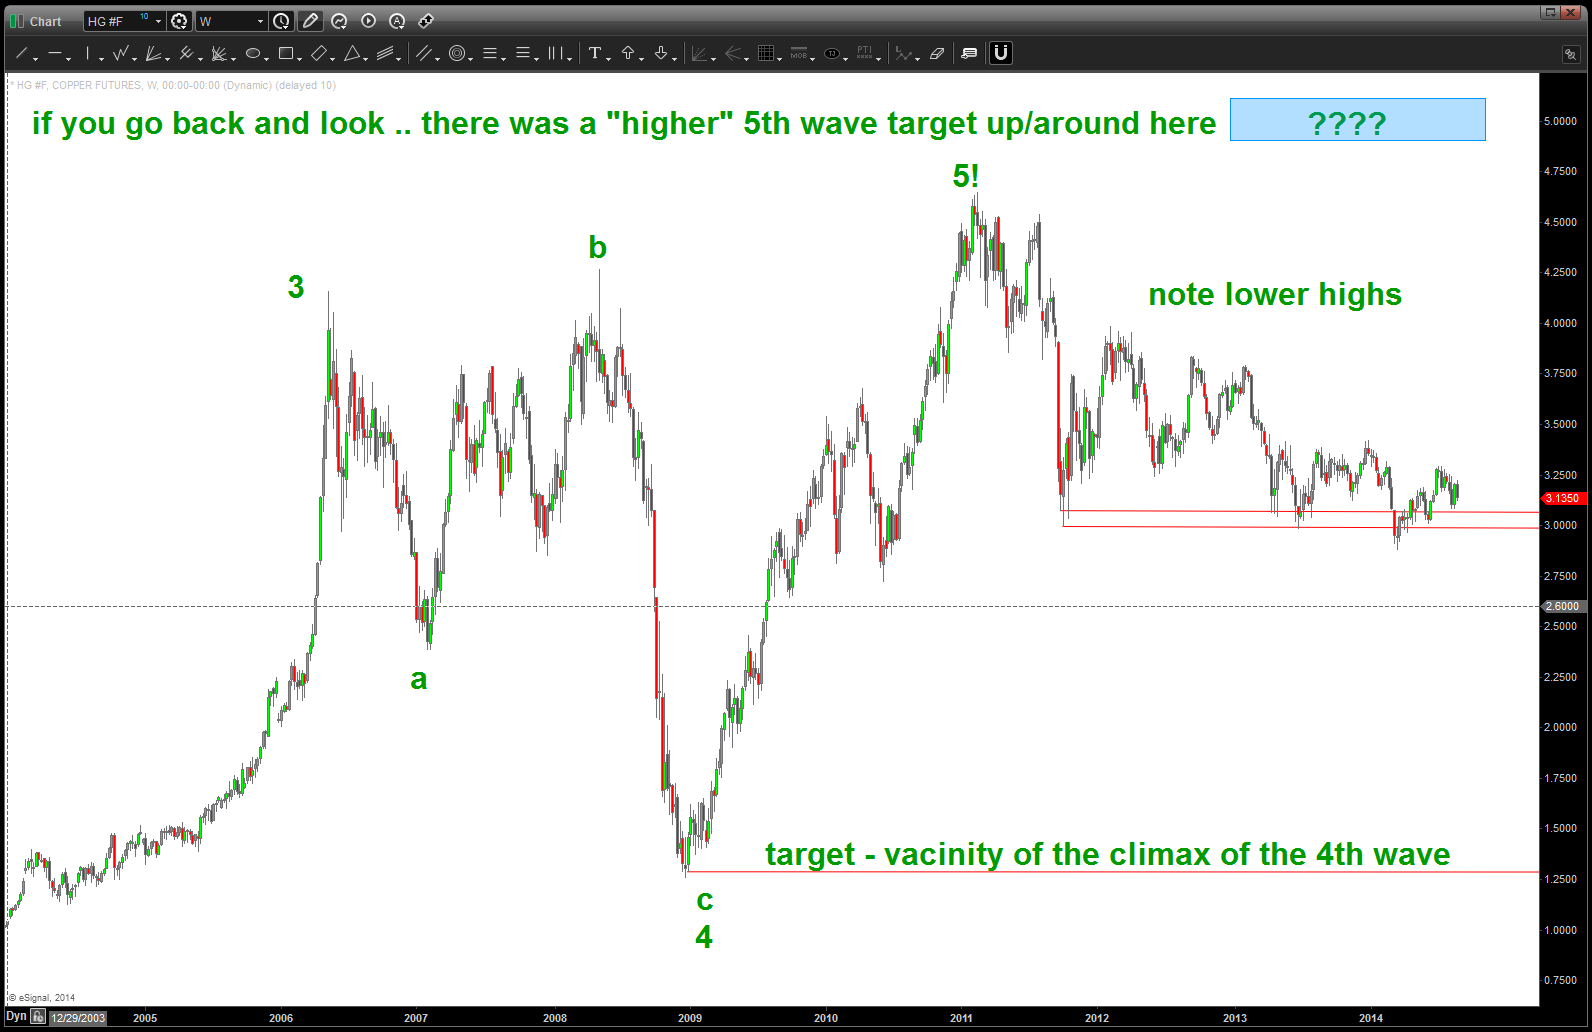
note a POTENTIAL for an ENORMOUS top in place for Copper 1,2,3,4,5
one last, note below the relative strength RATIO of EEM / SPY. Since 2010, on a relative basis the EEM has been getting smoked by the S&P500 as a whole. Also, note that the .618 retrace supported, for a while, but the broke and is now the REASON for the resistance. A little lower (blue shaded rectangle) is a NICE target to potential watch for a flow of funds into the EEM. Would hold off for now BUT do watch closely as we did break above the median trend line (like in the end of 2012 – which was defeated – blue arrow) and we should start down now w/ the SELL patterns present.
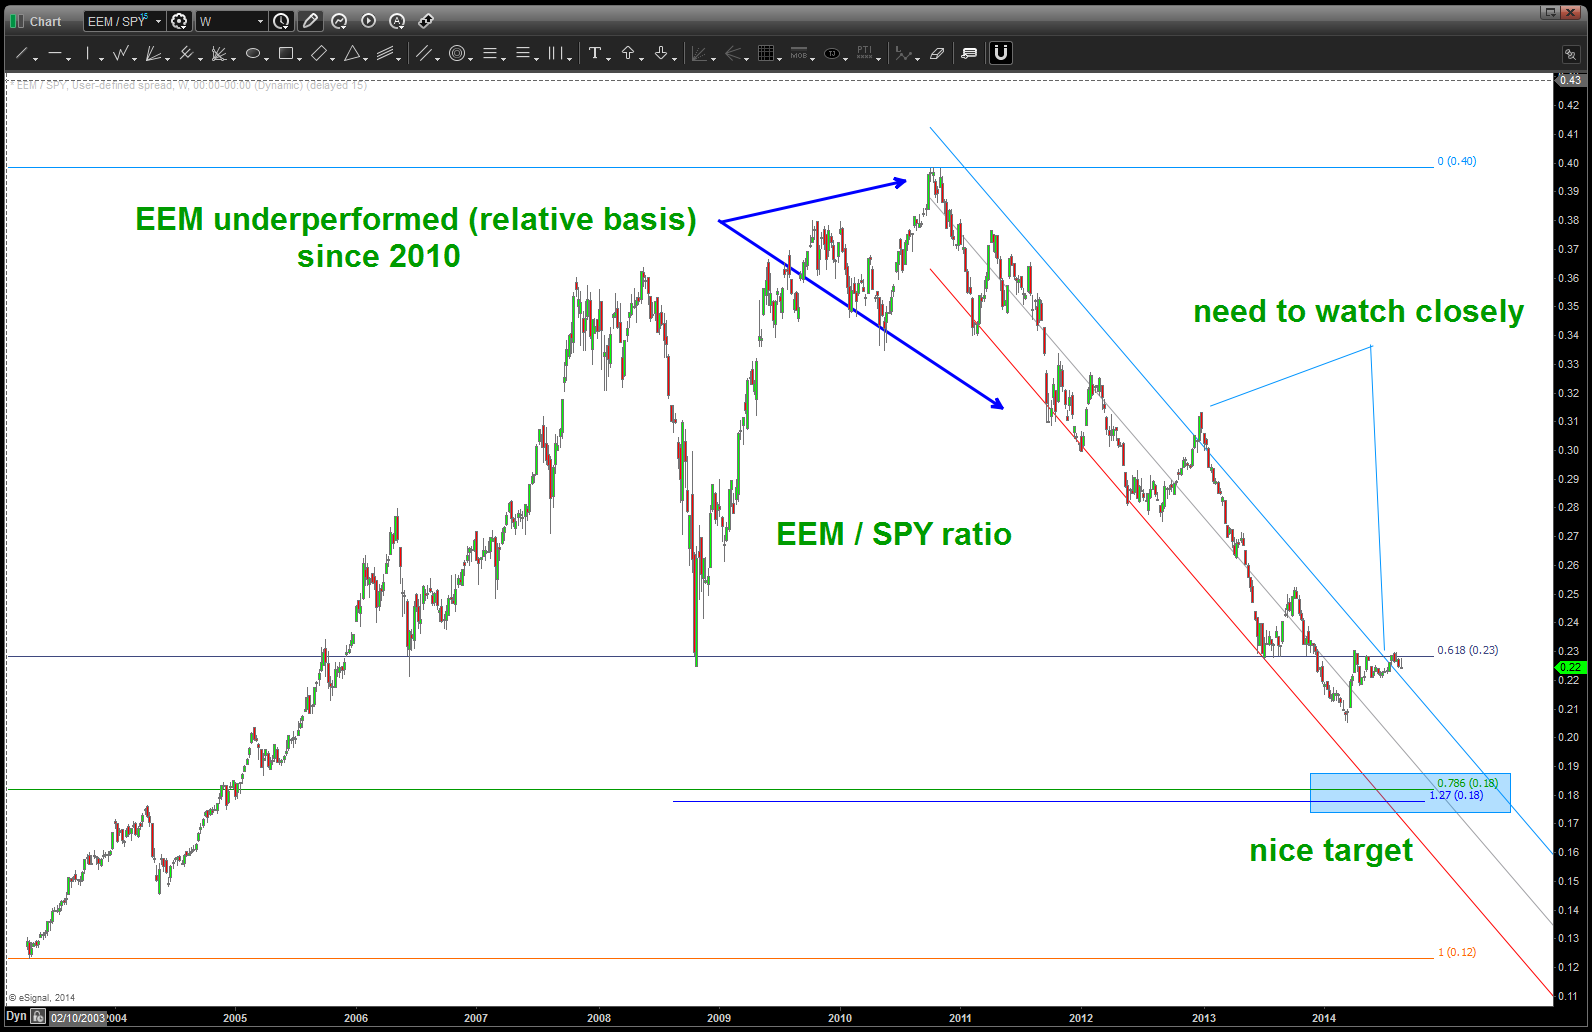
Relative Strength of EEM / SPY
Rock on, ok?
Bart
March 13, 2014:
CLIFF NOTES: the move in copper should not be surprising // we are correcting a multi-decade 5 waves up complete. This has shown to put pressure on emerging markets and china. All according to the script.
if you would like to search for “copper” on this blog you will see that we have had a bearish stance for a good couple of years. A strong case can be made that Copper finished a multi-year 5 waves UP and is now undergoing a potentially very violent correction. if you also click on this link you will see the correlation between FXI (chinese ETF) and EEM (emerging markets ETF) and Copper : https://bartscharts.com/2014/02/01/copper-and-the-emerging-markets-eem-etf/ also here are the highs and lows in Copper: https://bartscharts.com/2013/12/20/the-copper-script/
The most recent breakdown in copper does not play well for FXI or EEM.