A SELL PATTERN is present on the ETF JETS. However, the individual stocks are a mixed bag … a deeper analysis shows that the ‘regionals’ or ‘smaller’ airlines might have bottomed …
This is a VERY nice sell pattern on the ETF, JETS.
I went into some of the holdings and this is one that will be very interesting to watch. Sometimes, the ETF of a sector will show a PATTERN and then all the stocks under that ETF will show the same sort of pattern … we develop a nice roadmap.
In this case – the lower weighted are actually showing some bullish signs and the heavier weighted are showing some bearish signs.
It’s a mixed bag …
IF my count is correct on FRONTIER HOLDINGS this stock might be ready to run … believe it or not.
Trade what you SEE and not what you BELIEVE. Work in progress for all of us …
Note, this is a VERY nice resistance are below on UAL. However, we must be cautious of the BIG CANDLE that is pushing prices into this level. That is when we step aside and look to see what the PATTERN level will or won’t do …
The reason I’m interested in the ‘transportation’ sector is because of this BIG ABCD on the DJ Transportation Index. Is this BIG MONTHLY PATTERN going to fail …?
In order to see ‘how’ the JETS are doing from a relative strength comparison to the entire DJ transportation index – I’ve plotted JETS/TRANSPORTATION. Interestingly, we are right at an ABCD on the ratio. If this SELL PATTERN fails then, it might be time (and I’m having a REALLY tough time typing this …) to BUY the airlines?
Man, I might be in an alternate reality … look for a DEFINITIVE CLOSE above the ratio SELL PATTERN before jumping into this one …
note, the symmetry of the moves … wave 1 = wave 5 and the internals of wave 3 are perfect … 1 = 5 and 2=4.
you’ll also see some numbers to the side those are projections showing the clear symmetry in the waves
lastly, we were so so close to hitting the 16180 or 1.618 high .. off by .1 percent. anyway…. if you open your eyes to the harmonic ratio you will see a ton of examples.
just to show you … here’s the USD versus the LOONIE on a LONG TERM monthly and note the top …
yes that’s a MONTHLY AB=CD and then, just for shits and giggles went up and tagged 1.618 and “night night.” Just saying … pattern on a harmonic number, pay attention.
alert went off last week and the upper target zone on the DJ Transports has been hit ..on my monthly chart that level is 16180 and while I know a lot of you will just see a NUMBER and that’s cool but when you play w/ numbers EVERY day you see 1.618 … you study sooooo much that you understand “why” we don’t need decimal points and what they actually mean so you can move decimals point around.
if this is the high, I really have no idea if it is or it isn’t then the Architect has a really FUN sense of humor. think about it .. the “low” during the financial crisis on the cash SPX was 666. not kidding .. check it out. now, w/ one of the MAJOR indices topping out on the Golden Mean … well look at that.
The S&P 500 has been climbing a stairway to Heaven ..
folks coming into 2015 we had some pretty strong patterns appearing. some worked and some didn’t – isn’t that what we expect? that being said, it was prudent to be cautious due to their presence.
here’s what I posted around a year ago:
“Let’s don’t jump up and down and scream the BEAR MARKET is here till this chariot of the bulls breaks a swing low.”
so, while we’ve sold off for the past couple days let’s not go crazy. we have broken ONE swing low and that’s it, and it’s ONLY a weekly. WE HAVE NOT BROKEN A MONTHLY SWING LOW.
so, keep it ALL context of the big picture. We break a swing low on a MONTHLY and then a second then we have “issues.”
but for now, EVERYONE knows this puppy was on steroids and need some shaking out so let’s look for a pattern to BUY on a weekly (hint hint – it needs to breathe a bit) and if a bear I would still be very cautious.
what do we know and see … ?
we know a weekly swing low is about to be taken out and we’ll know that ONLY WITH THE CLOSE TOMORROW … we also know this has NEVER happened since March 2009 bull market began.
so, here’s the logic:
if weekly close below a swing low … get defensive.
if not, then keep in mind, we have pressure on the downside and it probably needs to breathe down so just chill …
enjoy the post below .. you’ll see some of the patterns were early, some were spot on. that’s not the point .. the entire post below is around the market action around a SWING LOW or SWING HI and to respect them — very very strongly.
let me know if you have any questions.
chart below is the ES .. note the red horizontal swing lows. those have never been broken on close. it might happen tomorrow …
Bart
S&P Futures Swing Lows since 2009
As we have discussed multiple times in this venue, the move since 2009 has been one heck of a ride. This chariot of stock market emotion is, literally, off the charts. It is at an extreme that has surpassed 1929, 2000 and 2007. For the past 6 months it has defied the powerful cycles and patterns we follow. However, we are at another “potential” inflection point and based on this weeks price action the chariot appears to be running out of gas. So, objectively, the cycles and patterns we follow appear to be working. Let’s don’t jump up and down and scream the BEAR MARKET is here till this chariot of the bulls breaks a swing low.
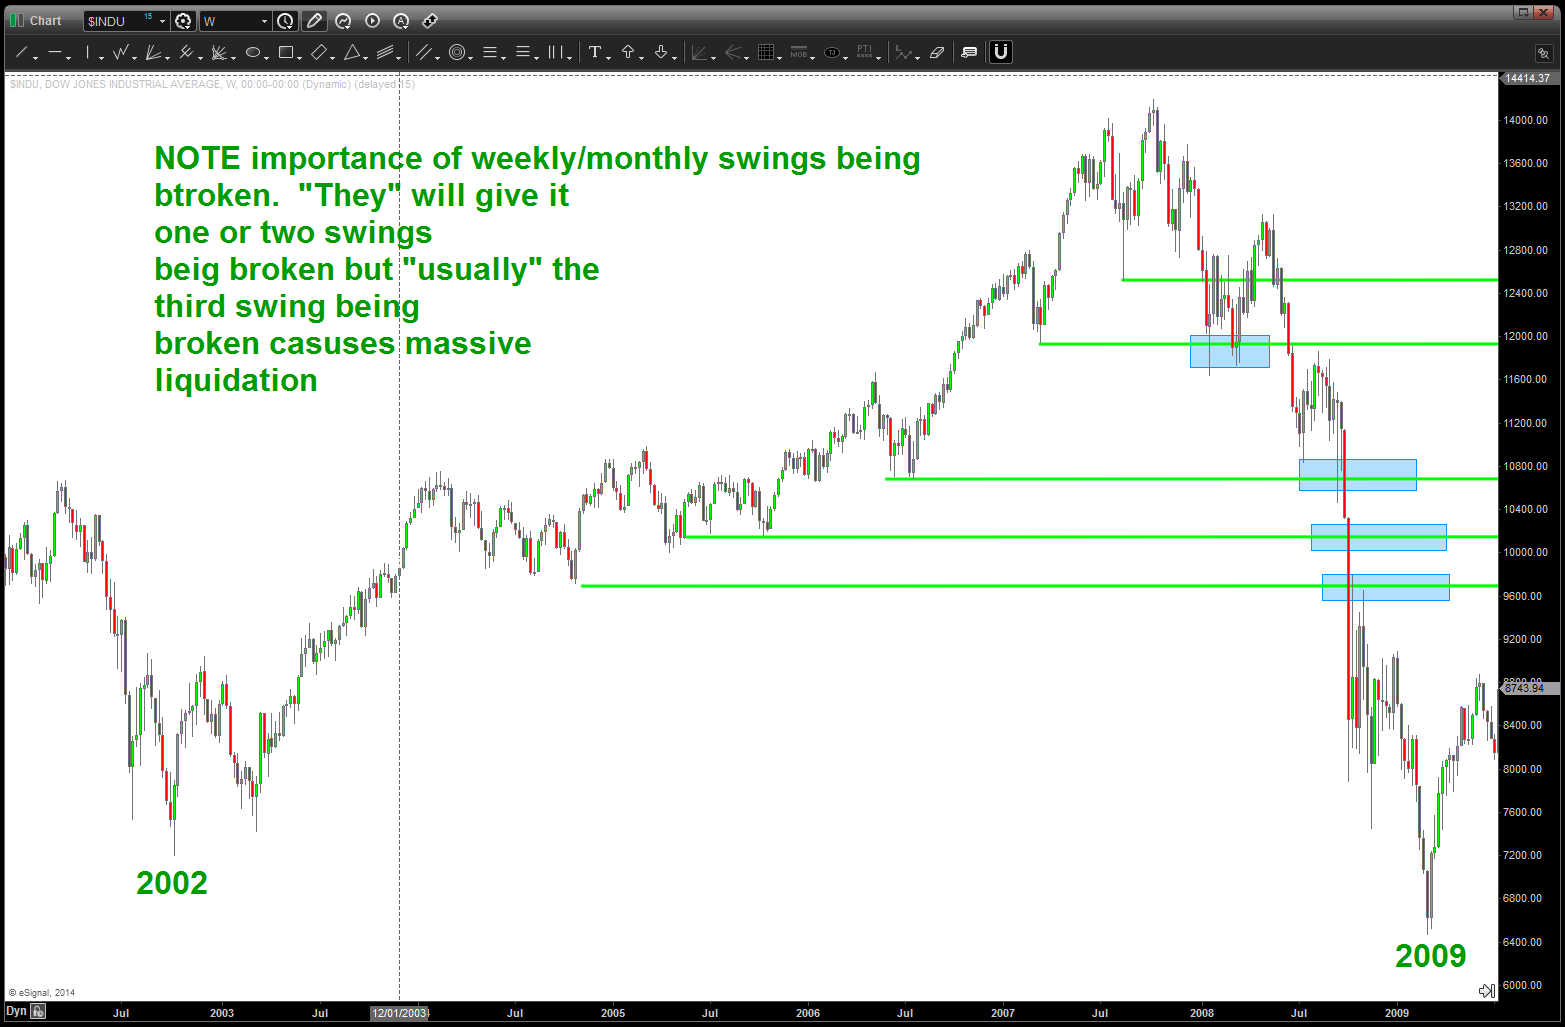
Below you’ll see a quick demonstration of the Dow Jones Industrial Average from 2002-2009. No patterns shown but just an example of the power of the swing low. Take note, when we lose one swing low there is usually some selling and then it bounces back and, here’s the key point,it fails to make a new high.Price might congest in this area (going either direction – up or down) and then it starts down. One thing to watch is “usually” the third swing low. When that gives away, selling is vicious. So, as much as we see MAJOR patterns completing let’s not get to confident. THE MAJOR US INDICES HAVE NOT BROKEN ONE SWING LOW IN 5 YEARS. Over the coming weeks, pay attention to these swing lows and swing highs (note the VIX chart – not one swing high has been taken out since 2007!)
Also, note the Dollar Index swing low track record and the very thin neckline that is coming into play a little lower. We’ve reached some daily extremes in metals (Gold, Silver) and the Euro and Pound. Sentiment means nothing when a multi year extreme is taken out and one that has been tested roughly 10 times since 2012. Folks, a lot of stops are hiding beneath 78-79 on the dollar index. Certainly hope support holds here …
so, keep an eye on the swing lows and highs over the coming days and weeks … note price action after a first or second swing low is taken out and, seriously consider safety if/when a 3rd long term swing low is taken out to the up or down side ….
Folks, what a wealth of information from Andy @seeitmarket …..
Here’ what I’ve been up to – check out the links and all of the amazing contributors:
the Banks … they lead us up and they lead us down. PATTERNS suggest they are at MAJOR resistance and what this means for the overall market: http://www.seeitmarket.com/bank-stocks-near-make-break-point-2015-13986/
IBM … a complete laggard. A case can be made, however, this a stock to own in 2015: http://www.seeitmarket.com/ibm-stock-reverse-higher-2015-investing-13980/
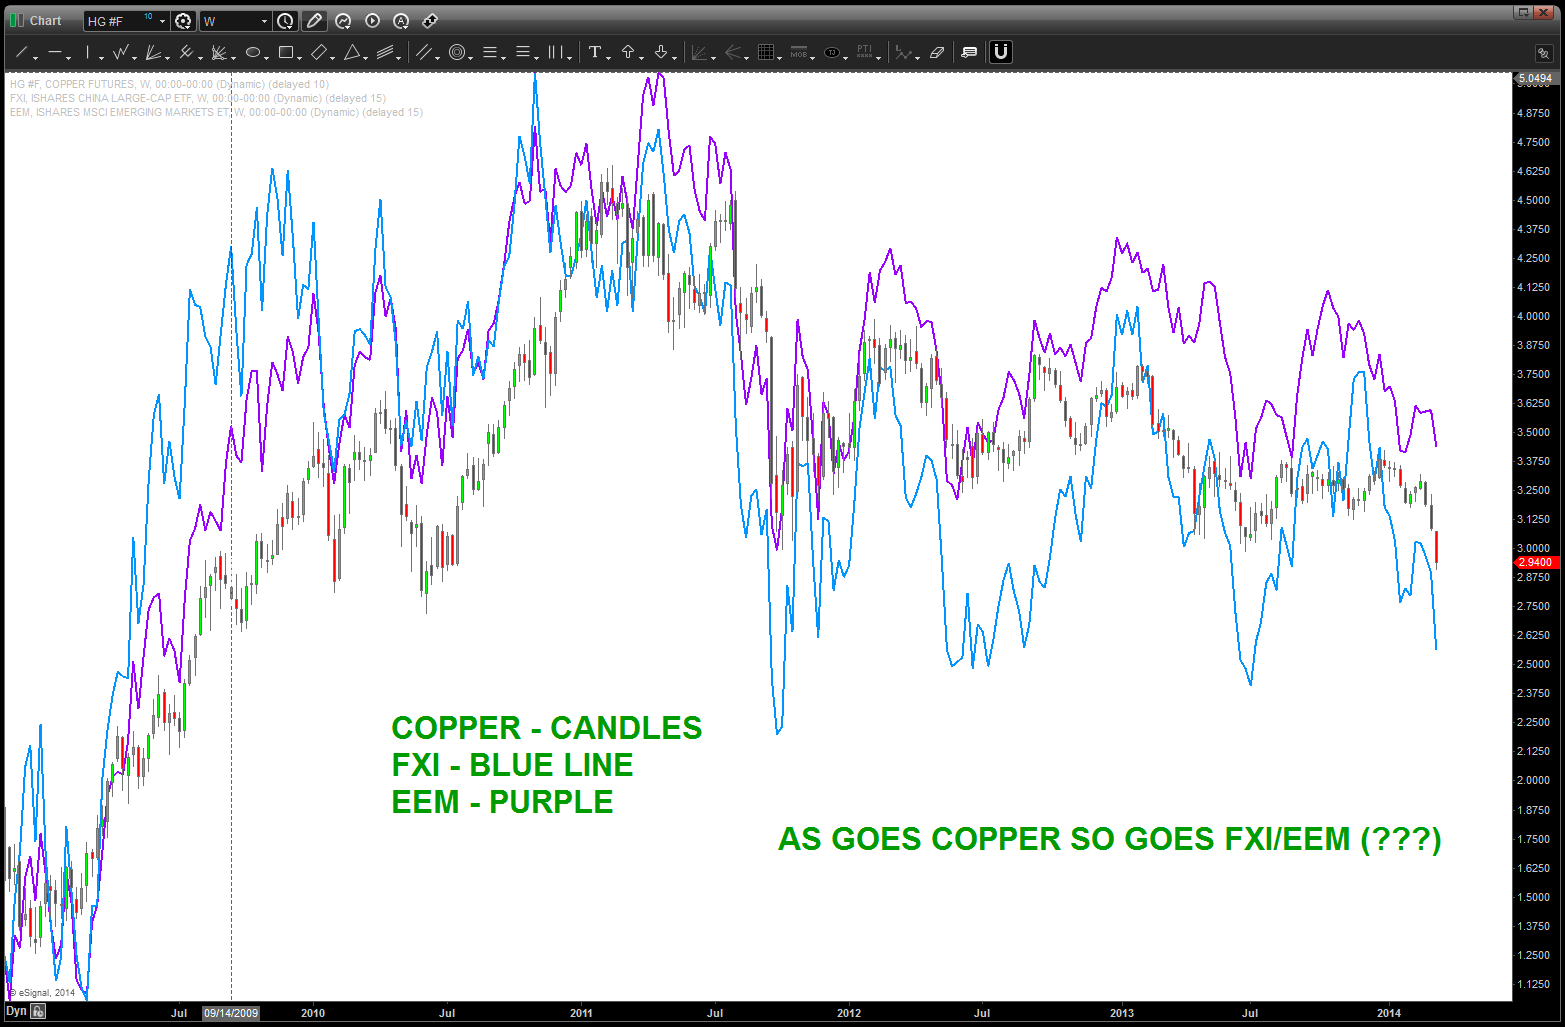
Copper … a BUY has been BULLISH for China and we completed an intraday BUY at the end of the year. Perhaps a nice bounce is coming? http://www.seeitmarket.com/copper-prices-falling-buy-zone-13975/
the DOW … is it going up into 20,000 in 2015? As my loyal readers, you know I was watching the .618 projection from the all time low at 28.48 and it did not hold at all. so, the logical next target is the AB=CD and, folks, that’s up at 20K+ here’s the link … http://www.seeitmarket.com/dow-jones-targeting-20000-djia-investing-13972/
the TRANSPORTS …the AB=CD got crushed. so, perhaps higher is in the cards: http://www.seeitmarket.com/dow-transports-move-higher-targets-13969/
YAHOO – will it stay or will it go? http://www.seeitmarket.com/yahoo-yhoo-sell-price-pattern-important-time-price-13965/
As we have discussed multiple times in this venue, the move since 2009 has been one heck of a ride. This chariot of stock market emotion is, literally, off the charts. It is at an extreme that has surpassed 1929, 2000 and 2007. For the past 6 months it has defied the powerful cycles and patterns we follow. However, we are at another “potential” inflection point and based on this weeks price action the chariot appears to be running out of gas. So, objectively, the cycles and patterns we follow appear to be working. Let’s don’t jump up and down and scream the BEAR MARKET is here till this chariot of the bulls breaks a swing low.
Below you’ll see a quick demonstration of the Dow Jones Industrial Average from 2002-2009. No patterns shown but just an example of the power of the swing low. Take note, when we lose one swing low there is usually some selling and then it bounces back and, here’s the key point,it fails to make a new high.Price might congest in this area (going either direction – up or down) and then it starts down. One thing to watch is “usually” the third swing low. When that gives away, selling is vicious. So, as much as we see MAJOR patterns completing let’s not get to confident. THE MAJOR US INDICES HAVE NOT BROKEN ONE SWING LOW IN 5 YEARS. Over the coming weeks, pay attention to these swing lows and swing highs (note the VIX chart – not one swing high has been taken out since 2007!)
Also, note the Dollar Index swing low track record and the very thin neckline that is coming into play a little lower. We’ve reached some daily extremes in metals (Gold, Silver) and the Euro and Pound. Sentiment means nothing when a multi year extreme is taken out and one that has been tested roughly 10 times since 2012. Folks, a lot of stops are hiding beneath 78-79 on the dollar index. Certainly hope support holds here …
so, keep an eye on the swing lows and highs over the coming days and weeks … note price action after a first or second swing low is taken out and, seriously consider safety if/when a 3rd long term swing low is taken out to the up or down side ….
I’m going to give myself .003% w/ regards to the pattern being complete on the Dow Jones Transportation Average. It never did hit, exactly, the 7616 target …but w/ the big move that occurred yesterday odds are that we have a MAJOR top in place. If you have been following my blog this “target” area has been forecast for a while …
I’m a pure play pattern recognition technician. I pay major attention when using “nodes” that are 42,281 days ago. I also pay particular attention when this “node” from 10/29/1896 has been responsible for support and resistance at every major top and bottom in my lifetime.
we finished a MAJOR pattern …the reaction is not surprising.
I type this blog, today, not because I did anything special. Simply, for the past couple weeks I knew a pattern was completing on the transports in this area. And, having been down the travels of a professional trader and succumbing to expectations, having to be right, etc. I simply have now trained my persona to EXPECT NOTHING. It’s a PATTERN and it will either work or it won’t …
Now, that being said, I do ask that you (my fellow bloggers) think about what could potentially be at work here … did the major institutions know this level before I did? I doubt it … did the Federal Reserve have someone tell them that the Transports were going to encounter major resistance? Again, doubtful. Did Warren Buffet have this knowledge? No, I submit nobody was CONSCIOUSLY aware of this level. But, FOR WHATEVER REASON, the psyche, emotions, feelings FLIPPED ON A DIME. At the PATTERN level EVERYONE SOLD. Think about it … no CNBC, no FAST MONEY, no fundamental talking head pundit … a NUMBER was hit (natural square OBTW) and bada bing bong boom EVERYONE SOLD. Take a moment and think about that one …
It worked, the GOOG, YHOO and others didn’t … it’s all probability.
W/ that in mind, the PROBABILITY is rising, albeit slowly, that we are on the cusp of the biggest bear market we have EVER experienced in this country or world.
As for me, I’m just going to wait for a PATTERN and deploy capital …
if you have been following the posts over the past couple months, you’ll find that I’ve moved (pretty much alone) into a very cautious, if not outright bearish mindset based on the patterns that are appearing across the circle of life. one of the more prevalent patterns that I’ve been watching is the DJTA. from the all time low of 49 on 10/29/1896 it has been shown how this key “node” was the anchor behind support in 1987, 2000 and 2009. Using this node we can now project for targets on the DJTA. anywhere between 7400-7600 on the index should be extremely important resistance if not an a major inflection point. here is the chart (updated as of 11/30/2013)
so, we’ve got just a little bit more to the upside, so I decided to take a peak at the entire DJTA and look for patterns that support a bearish nature once this level is hit. take a view thru the charts, no screaming buys but I do see 1) parabolic rises, 2) monthly sell patterns appearing and 3) some stocks that topped years ago. so, be mindful of this level and, well, we’ll see if the patterns work or not ….
apologize for falling off the blog bandwagon early this week…got smacked like a brick in the face w/ a stomach bug. just resurfaced … actually got some emails from you asking where the posts are…thanks! since my record appears to be broken, thought I would add some thoughts from 50+ years of trading…each of these men are friends and mentors of mine …
Larry Pesavento (www.tradingtutor.com) put out a chart on the Shiller P/E ratio but actually added some “other” criteria to the chart in the following manner:
Shiller P/E anything > 18 (current is 25+)
S&P 500 at a 5 year high
S&P 500 at least &% above 40 weeks smoothing
Bulls > 50%, Bears < 20% (Investors Intelligence)
Prior Instances of this happening: 1972/1987/2007
note – in 2000 bears never fell below 2000
note – this happened in 1929 on imputed sentiment
the most recent clusters have been in May 2013 / Aug 2013/Nov 2013 …. why hasn’t the market gone down, just a bit? Well here’s why …
mentor/friend Mike Jenkins (www.stockcyclesforecast.com) recently explained the amazing run in these terms:
“The FED buying of treasury bonds actually spills into the area of the FED buying stocks because indirectly they are. The ‘banks’ like Goldman Sachs now can borrow billions from the FED at a fraction of a percent and buy an ETF basket of stocks with 2% dividends and sell futures short as the hedge and also sell puts and calls to make up the spread difference arbitraging a good profit on the FED loan. This has had the effect of ratcheting up the market with each new buy program. The proof that this is at work is the fact that the biggest correction seen so far took place in late June when the S&P futures were expiring and in a downtrend and the September contract was at too steep a discount to roll out profitably so they had to liquidate some long baskets. This will happen again either in December or March and then there could be hundreds of billions of baskets unwinding just like the portfolio insurance of 1987. The big institutions learned in 2008 that no matter what the ‘valuation’ of a stock was, it could go to almost zero if a large enough seller was out there. They won’t wait around this time and they’ll create a ‘flash crash’ getting out…”
I’ll just leave you w/ two charts …one is the IWM (Russell 2000 ETF) and the continued march of the DJ Transports …
it’s coming folks … keep riding this wave but when you get smashed into the coral at the end of the break, hope you brought a breathing apparatus. What a great run it’s been…