Dow Jones Transportation Average – a chart tour starting in 1896
if you have been following the posts over the past couple months, you’ll find that I’ve moved (pretty much alone) into a very cautious, if not outright bearish mindset based on the patterns that are appearing across the circle of life. one of the more prevalent patterns that I’ve been watching is the DJTA. from the all time low of 49 on 10/29/1896 it has been shown how this key “node” was the anchor behind support in 1987, 2000 and 2009. Using this node we can now project for targets on the DJTA. anywhere between 7400-7600 on the index should be extremely important resistance if not an a major inflection point. here is the chart (updated as of 11/30/2013)
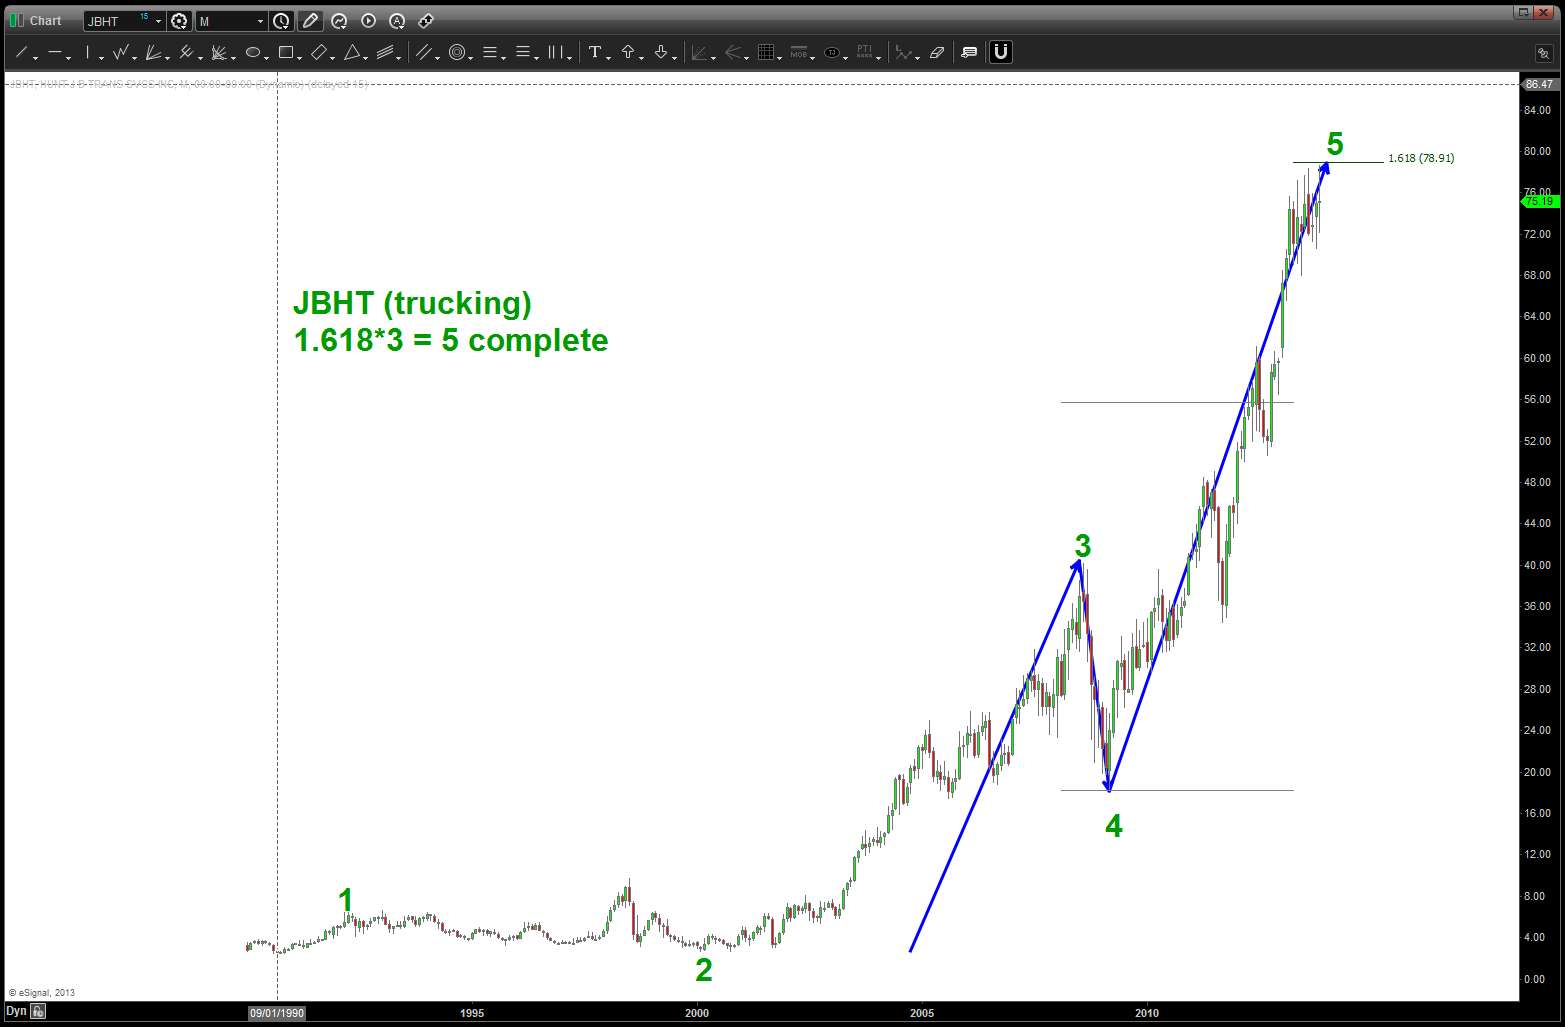
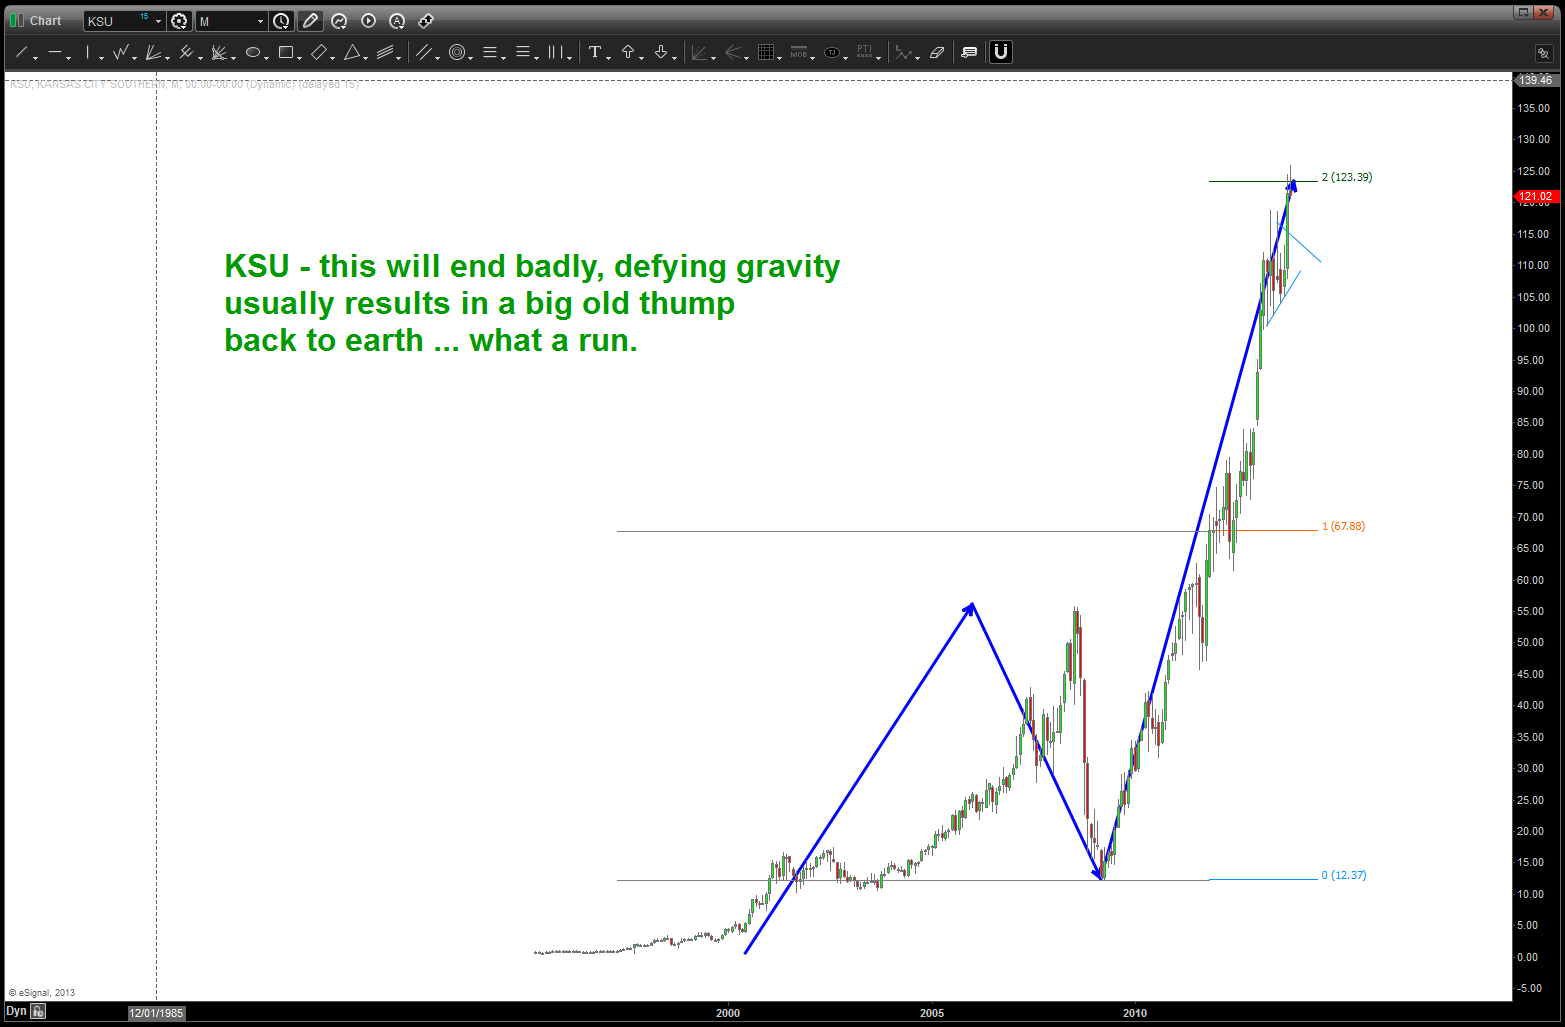
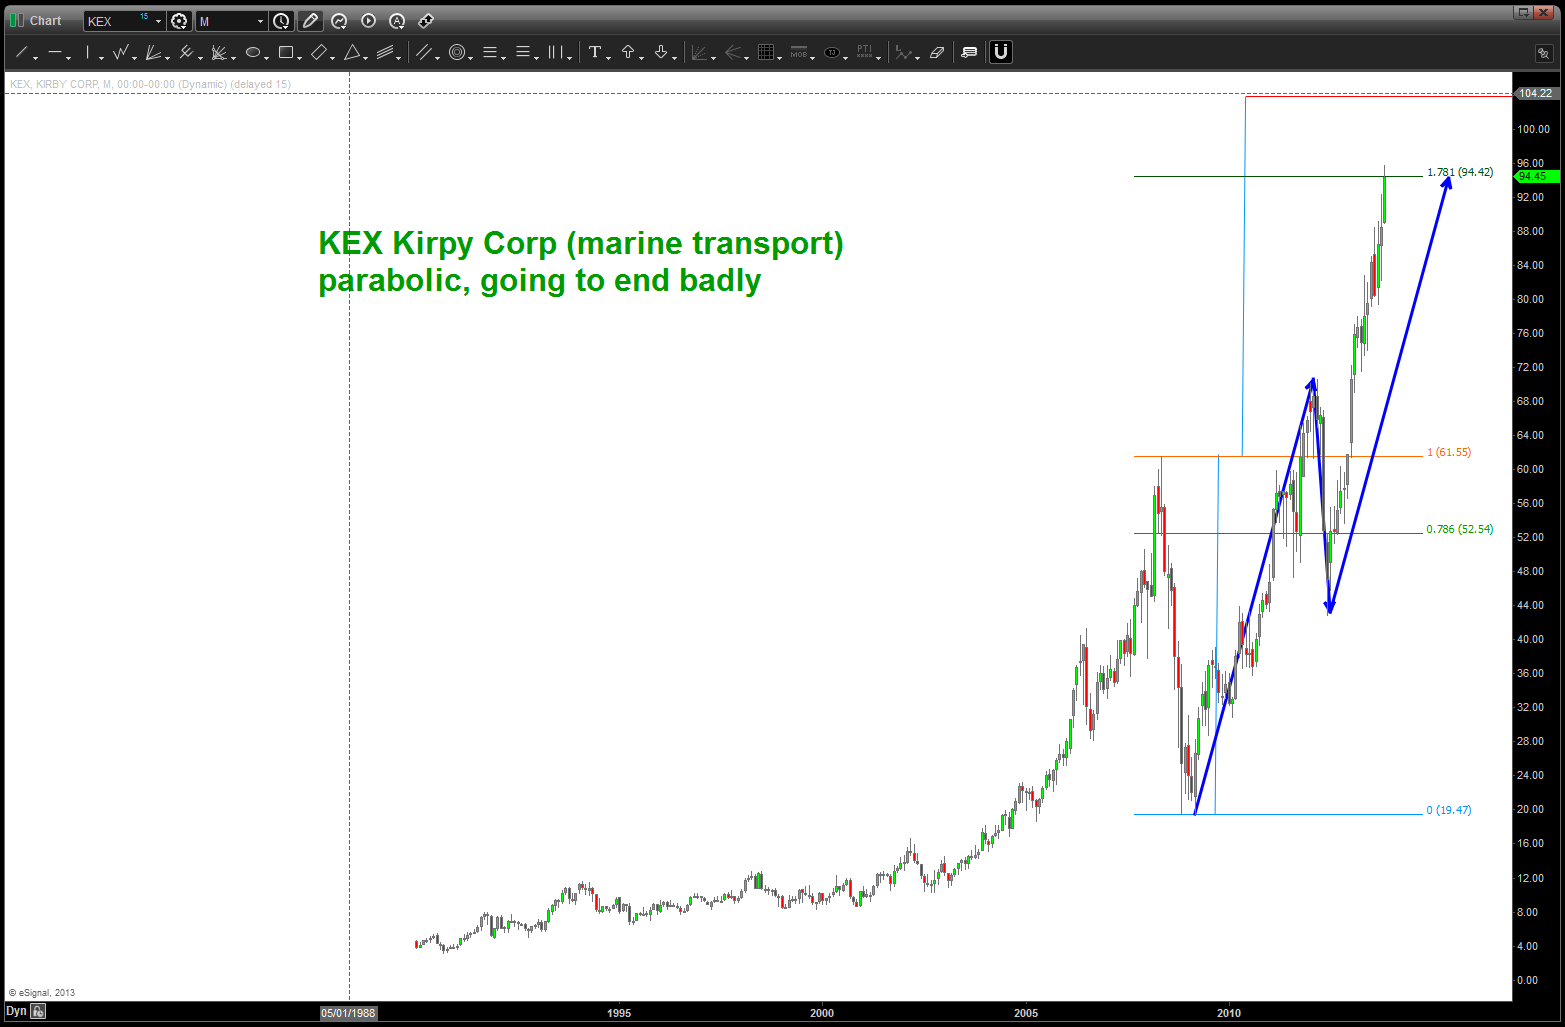
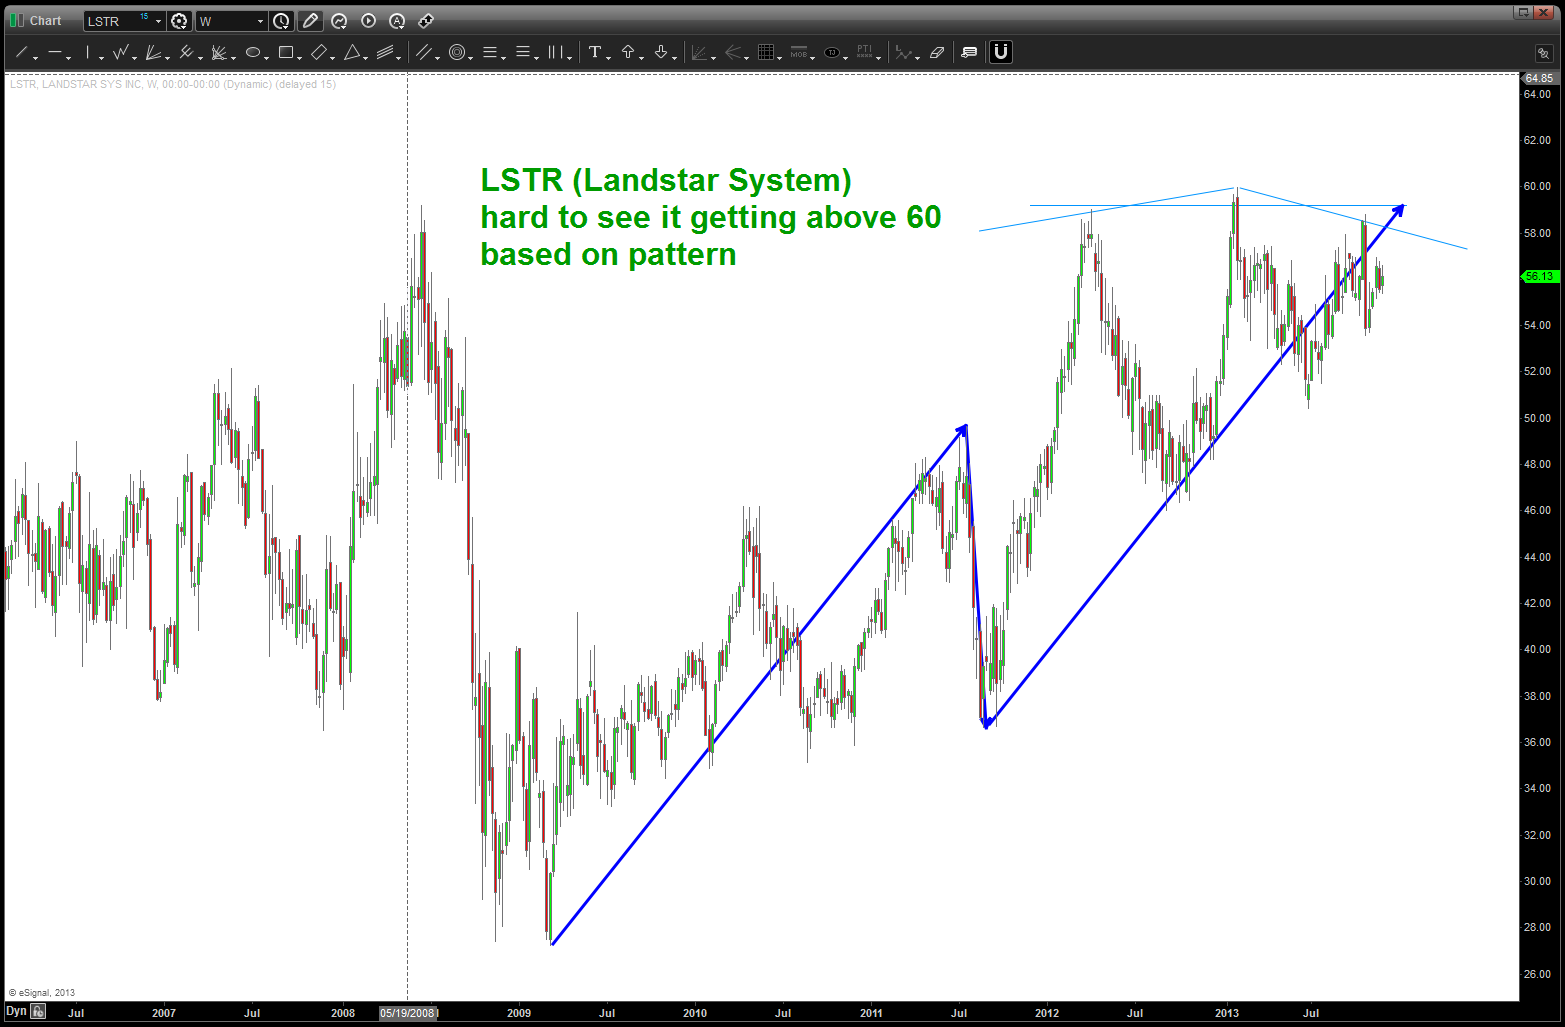
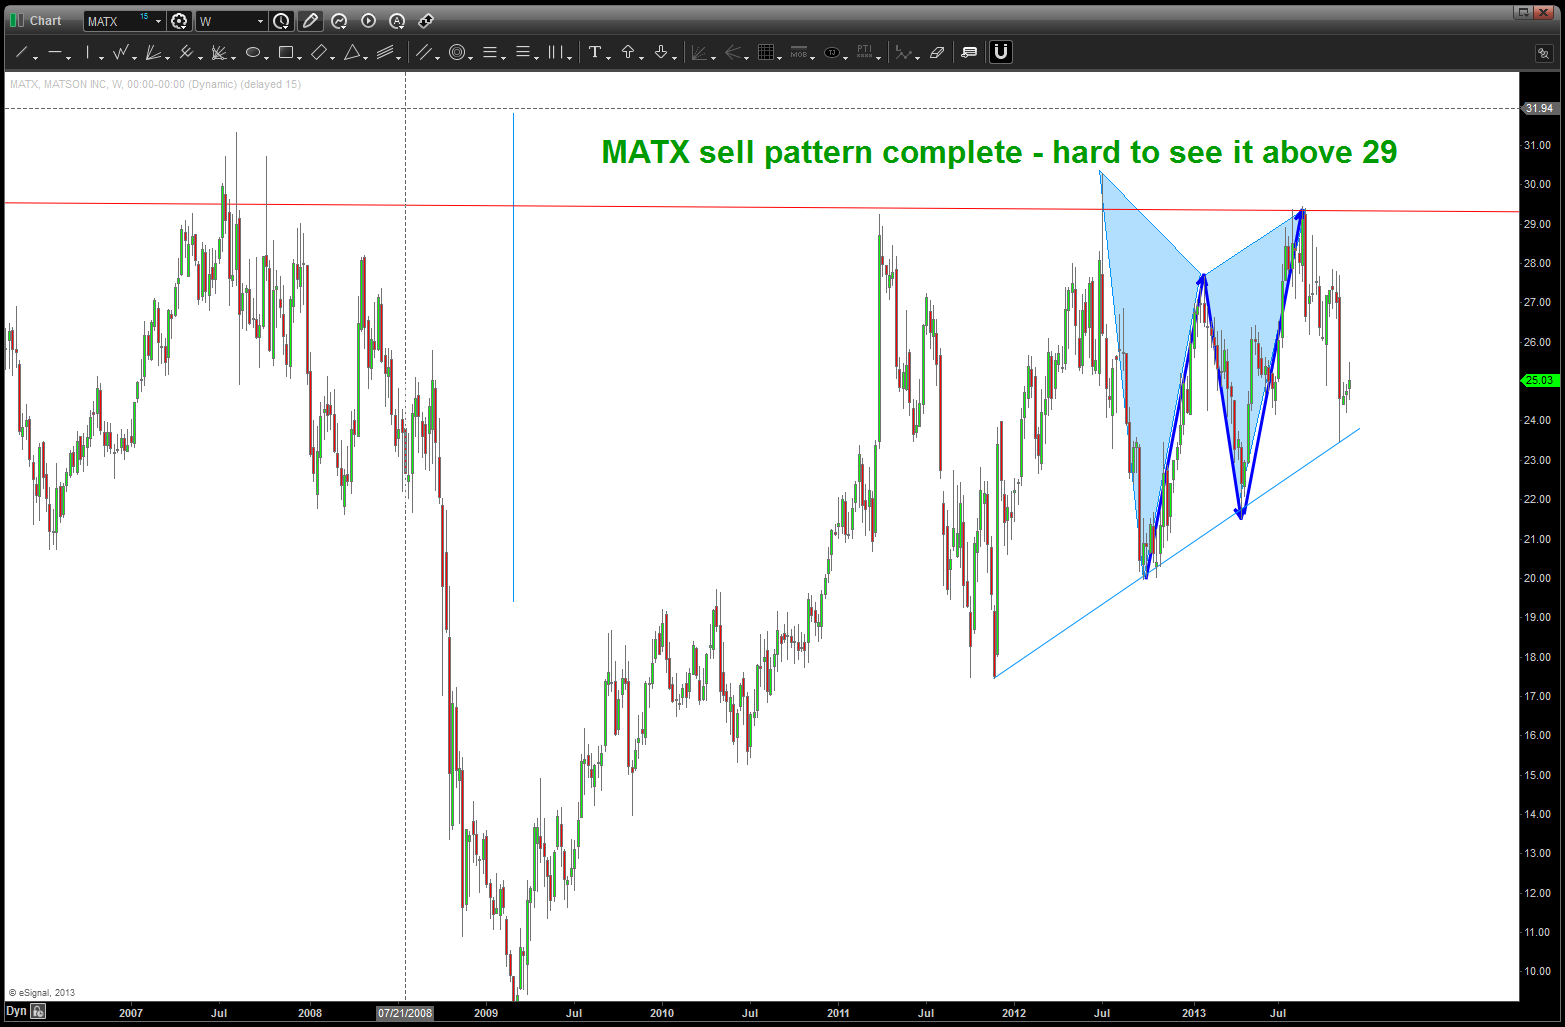
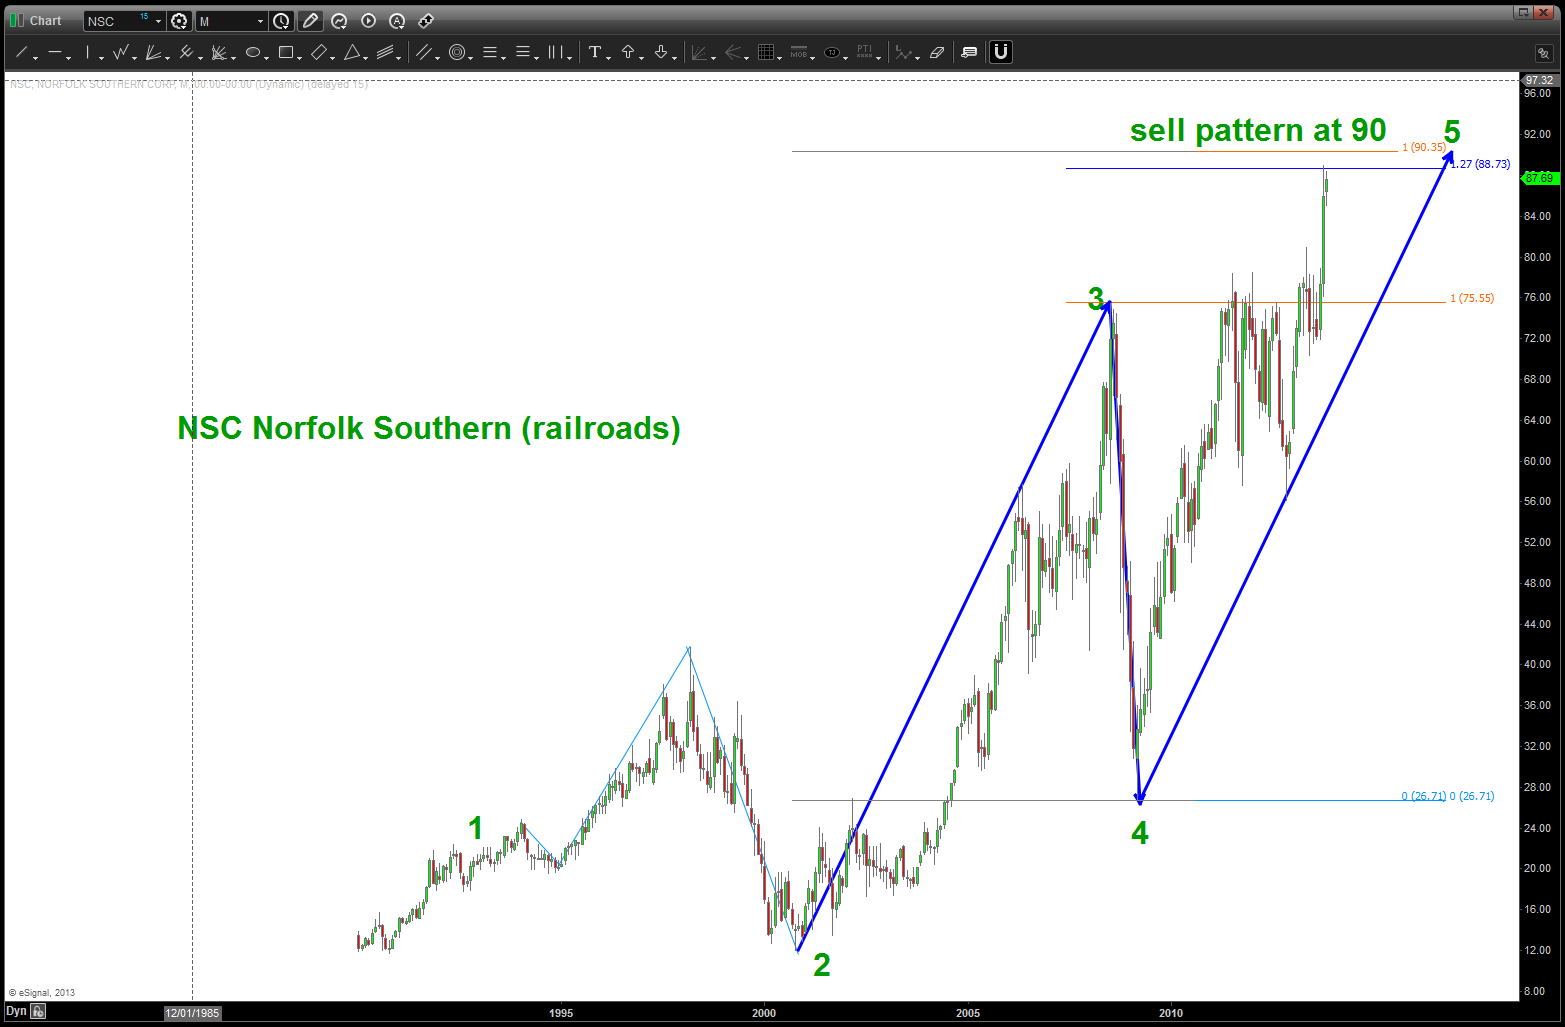
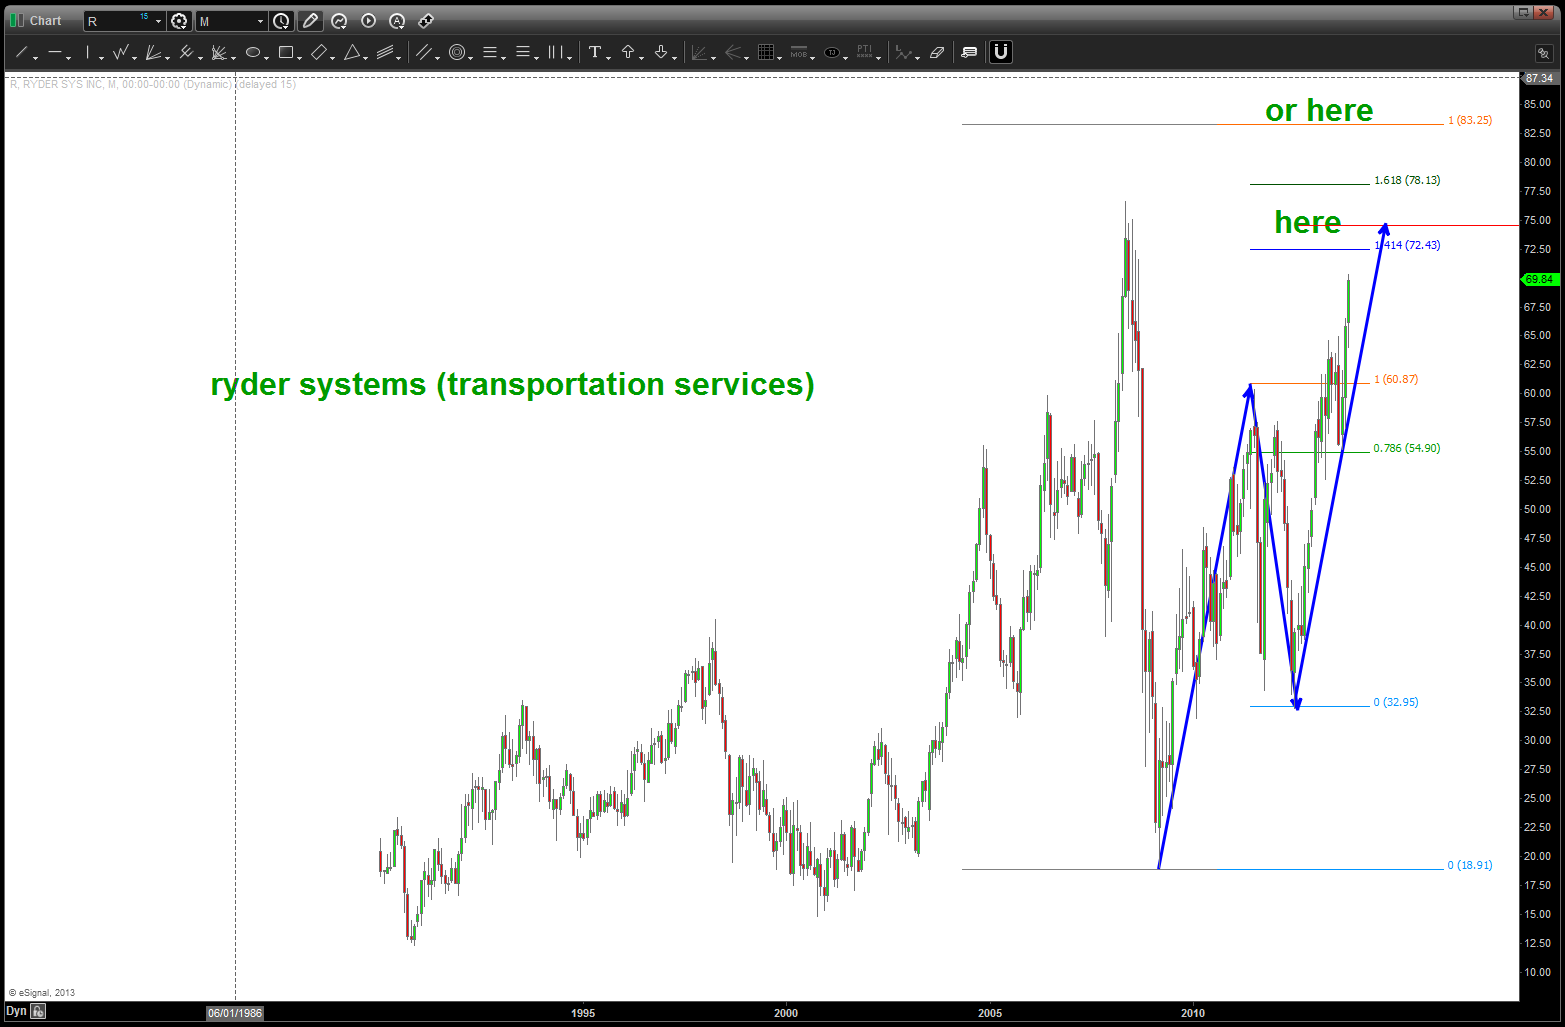
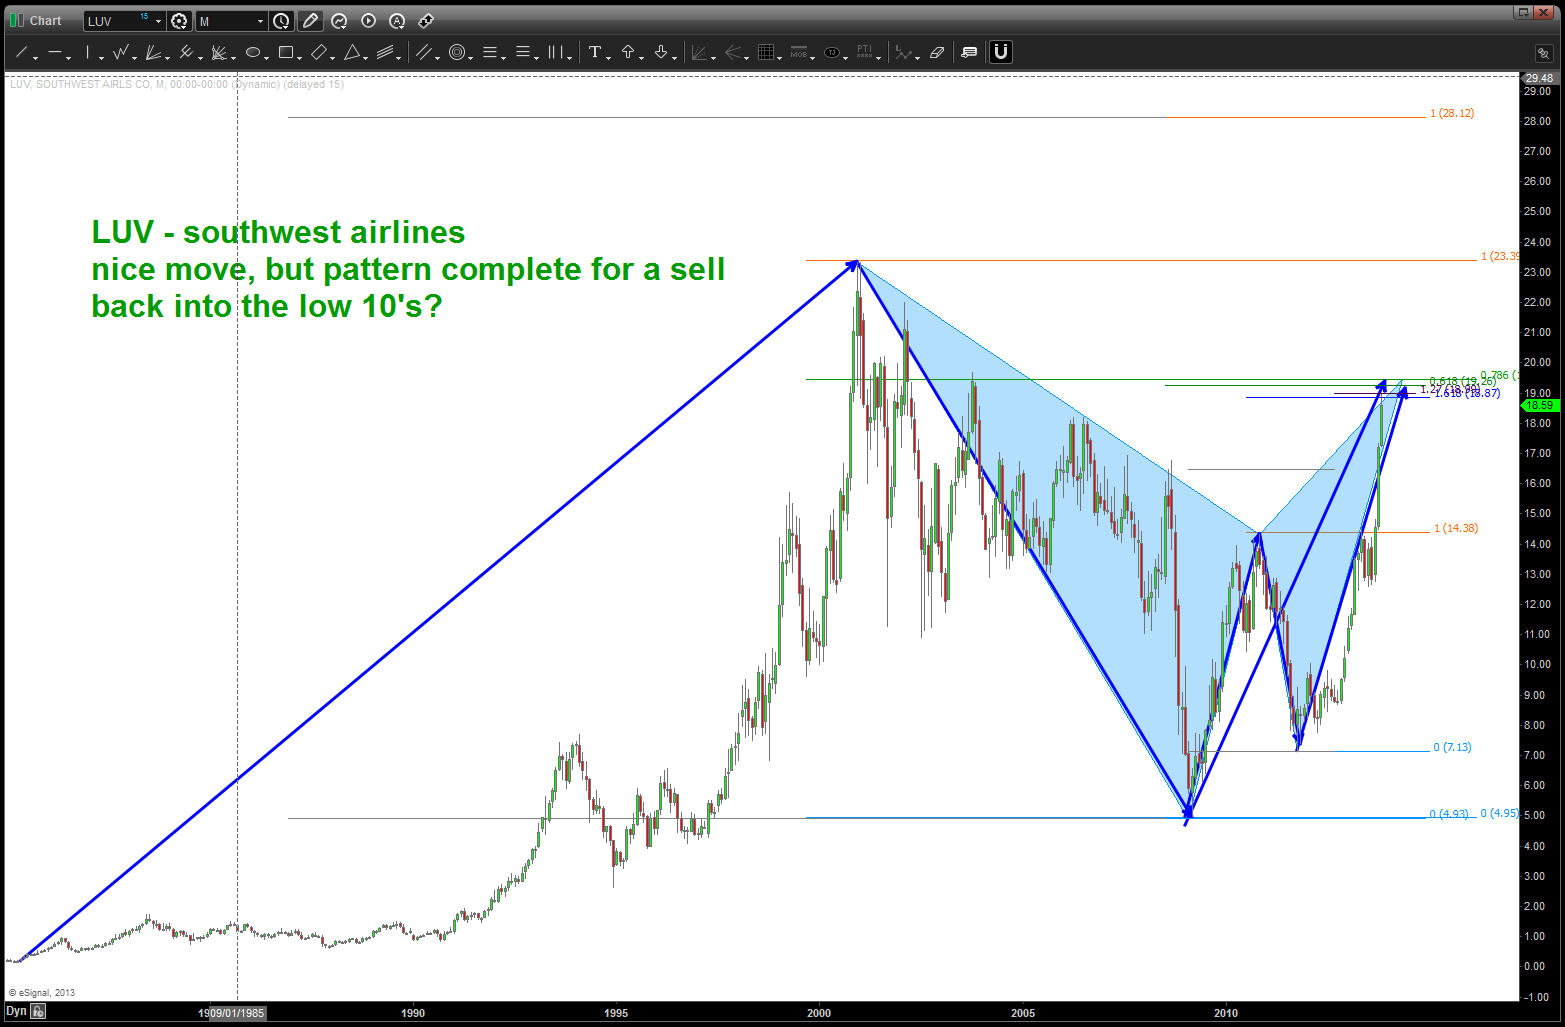
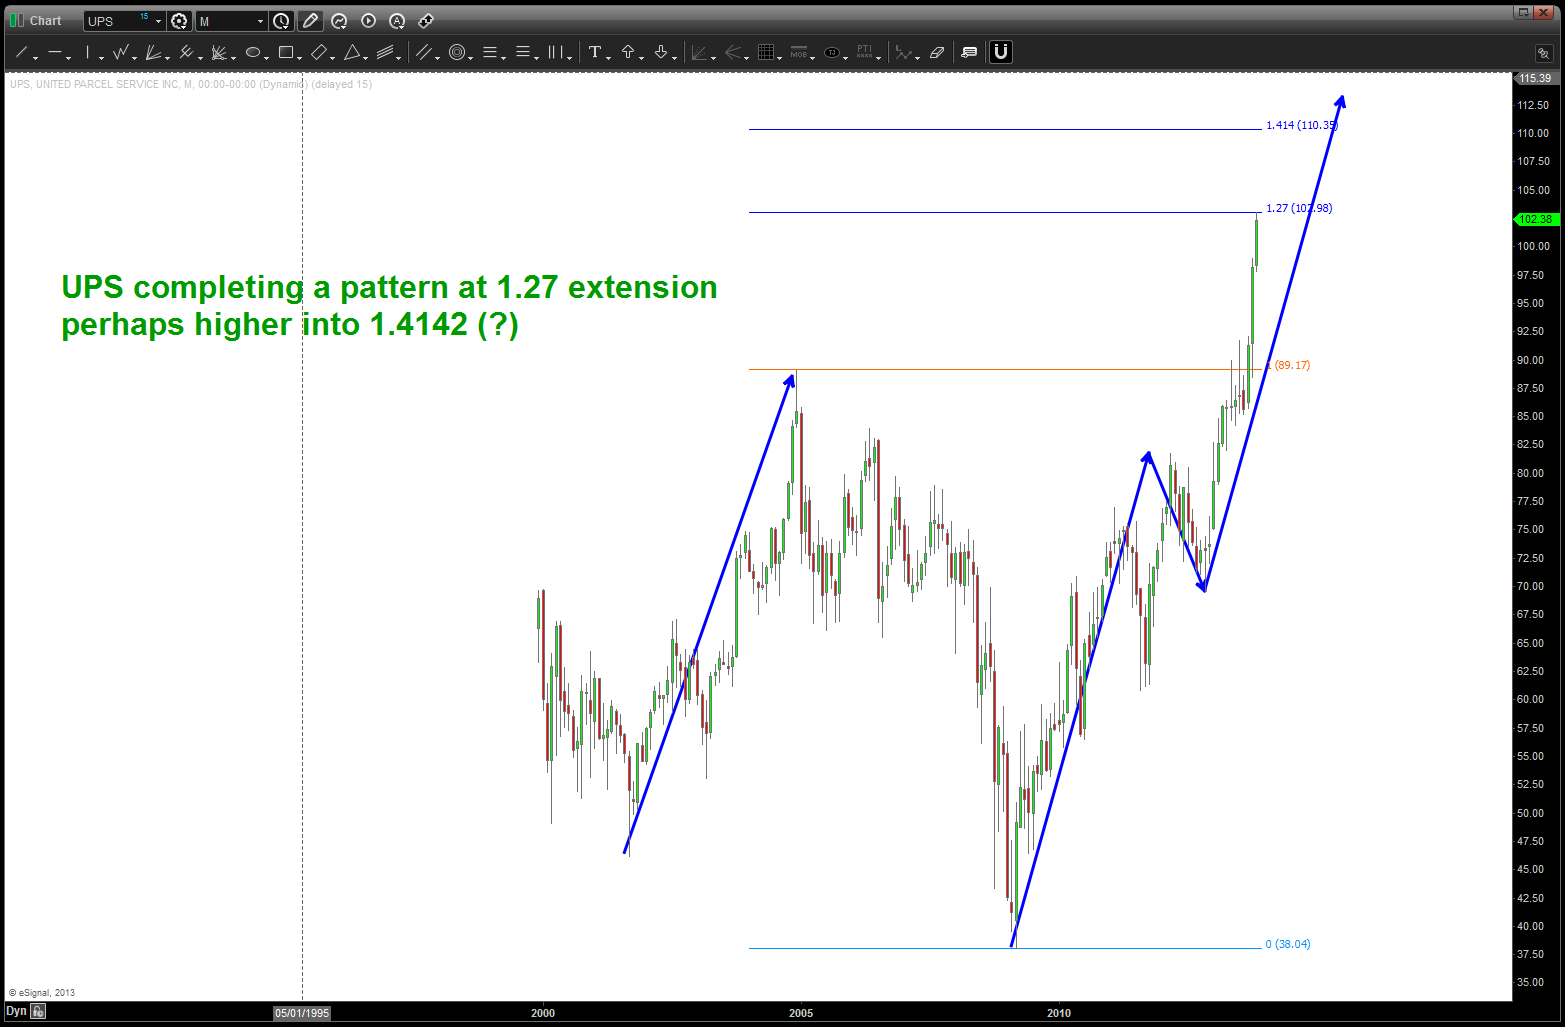
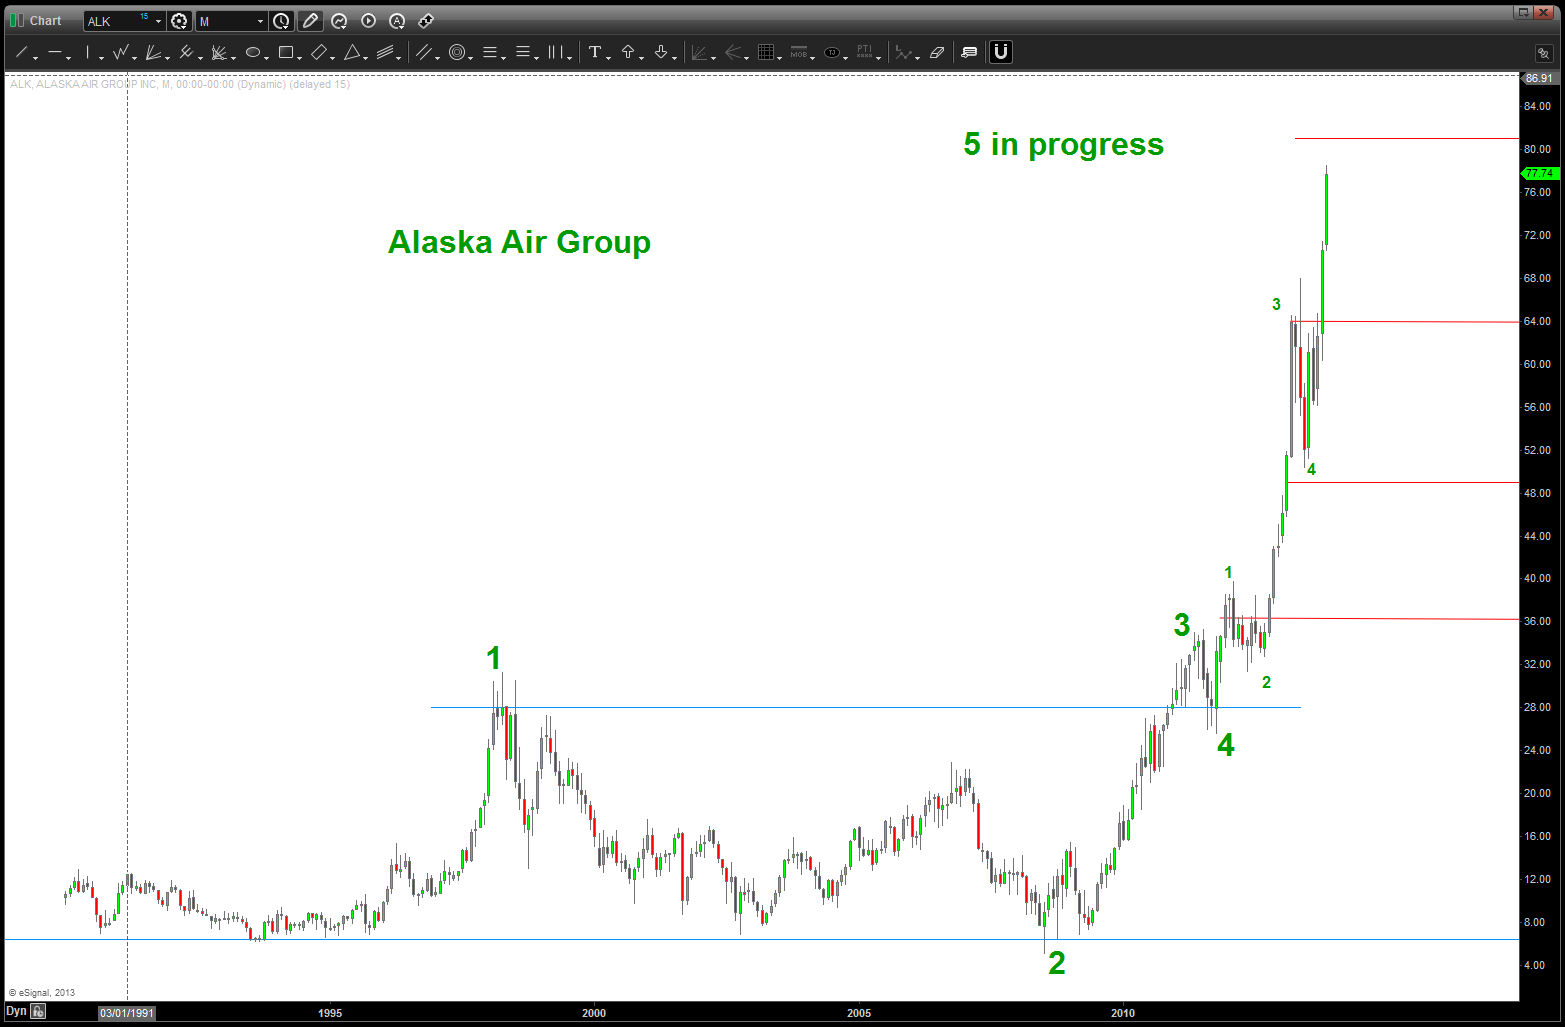
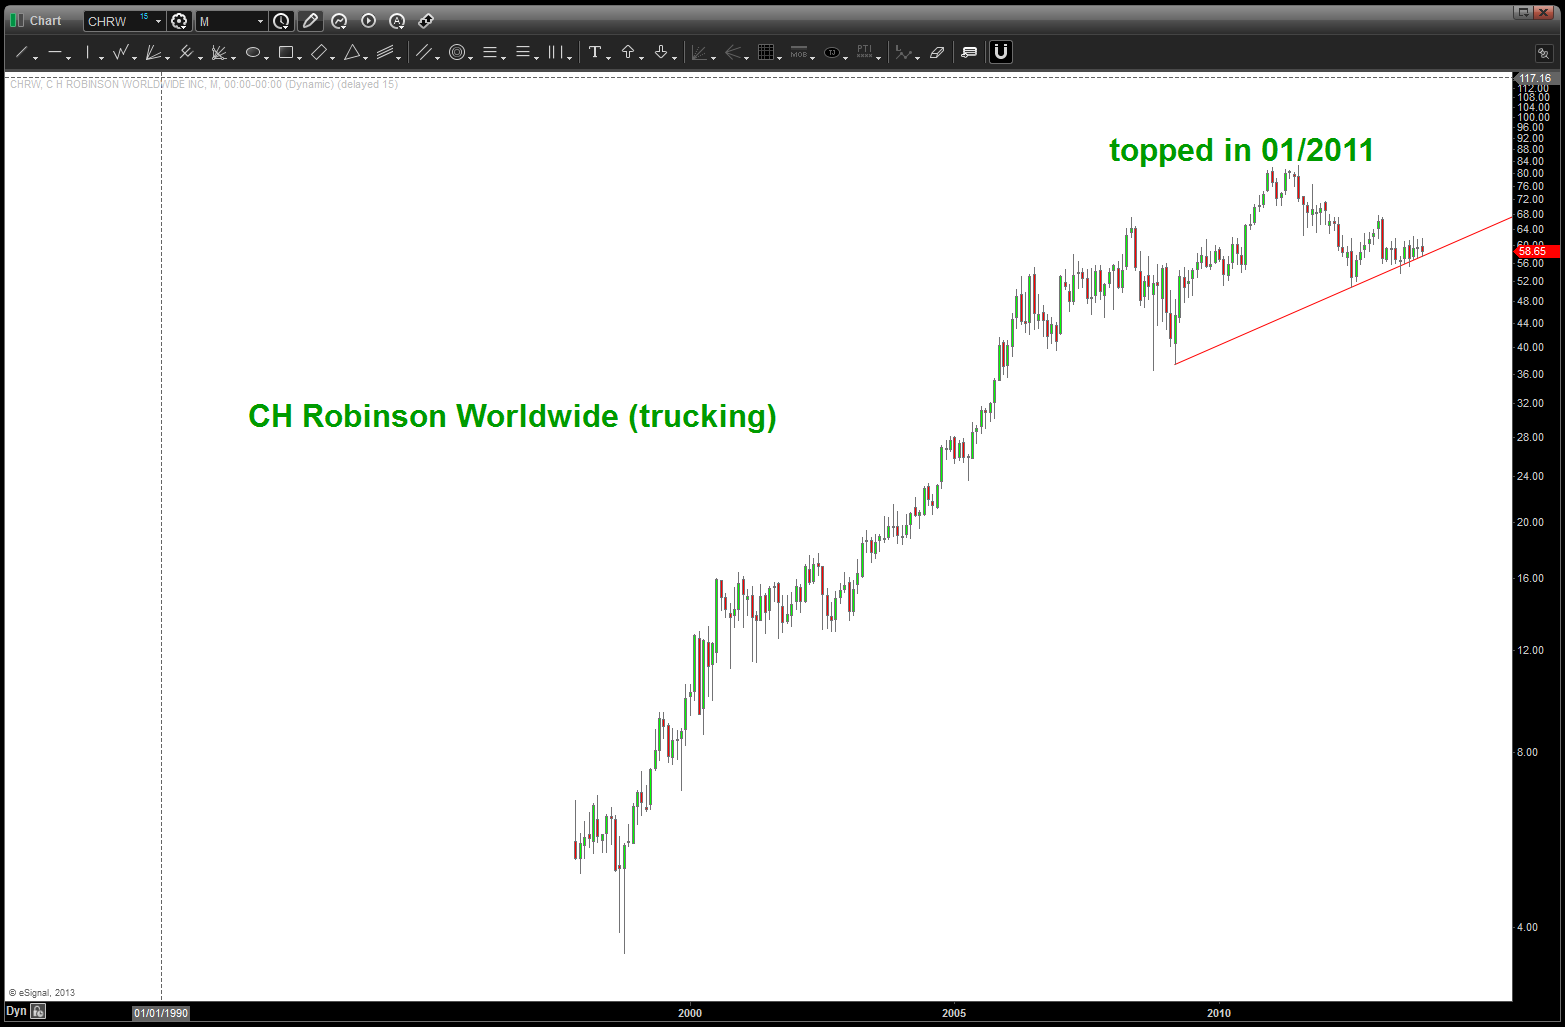
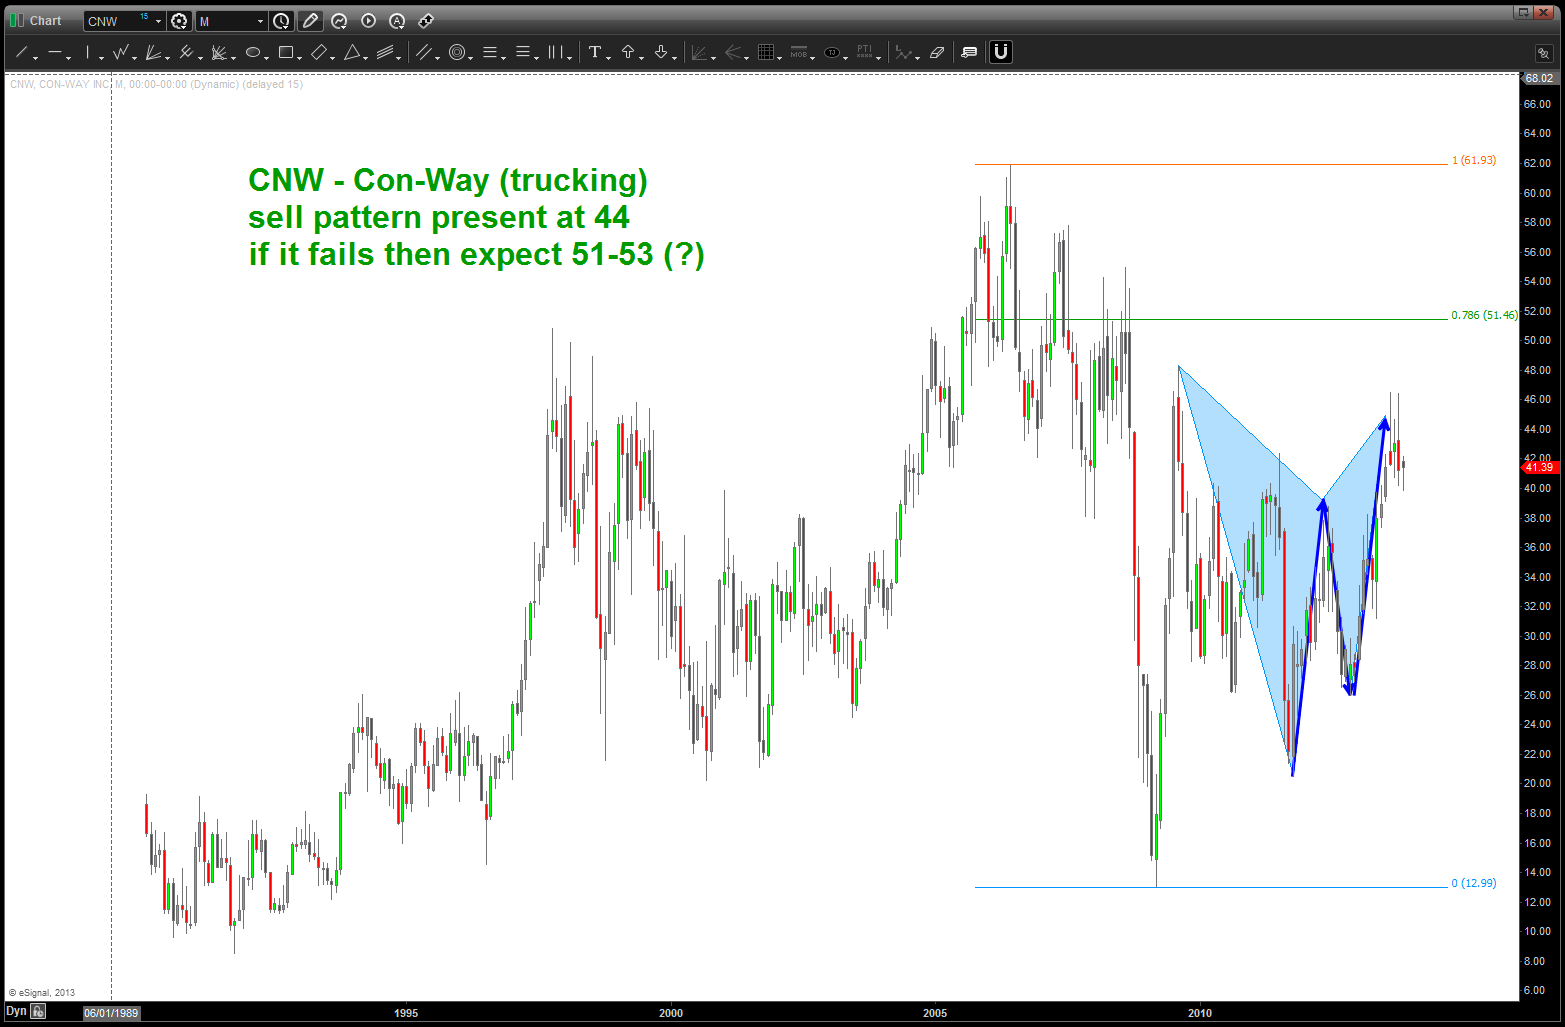
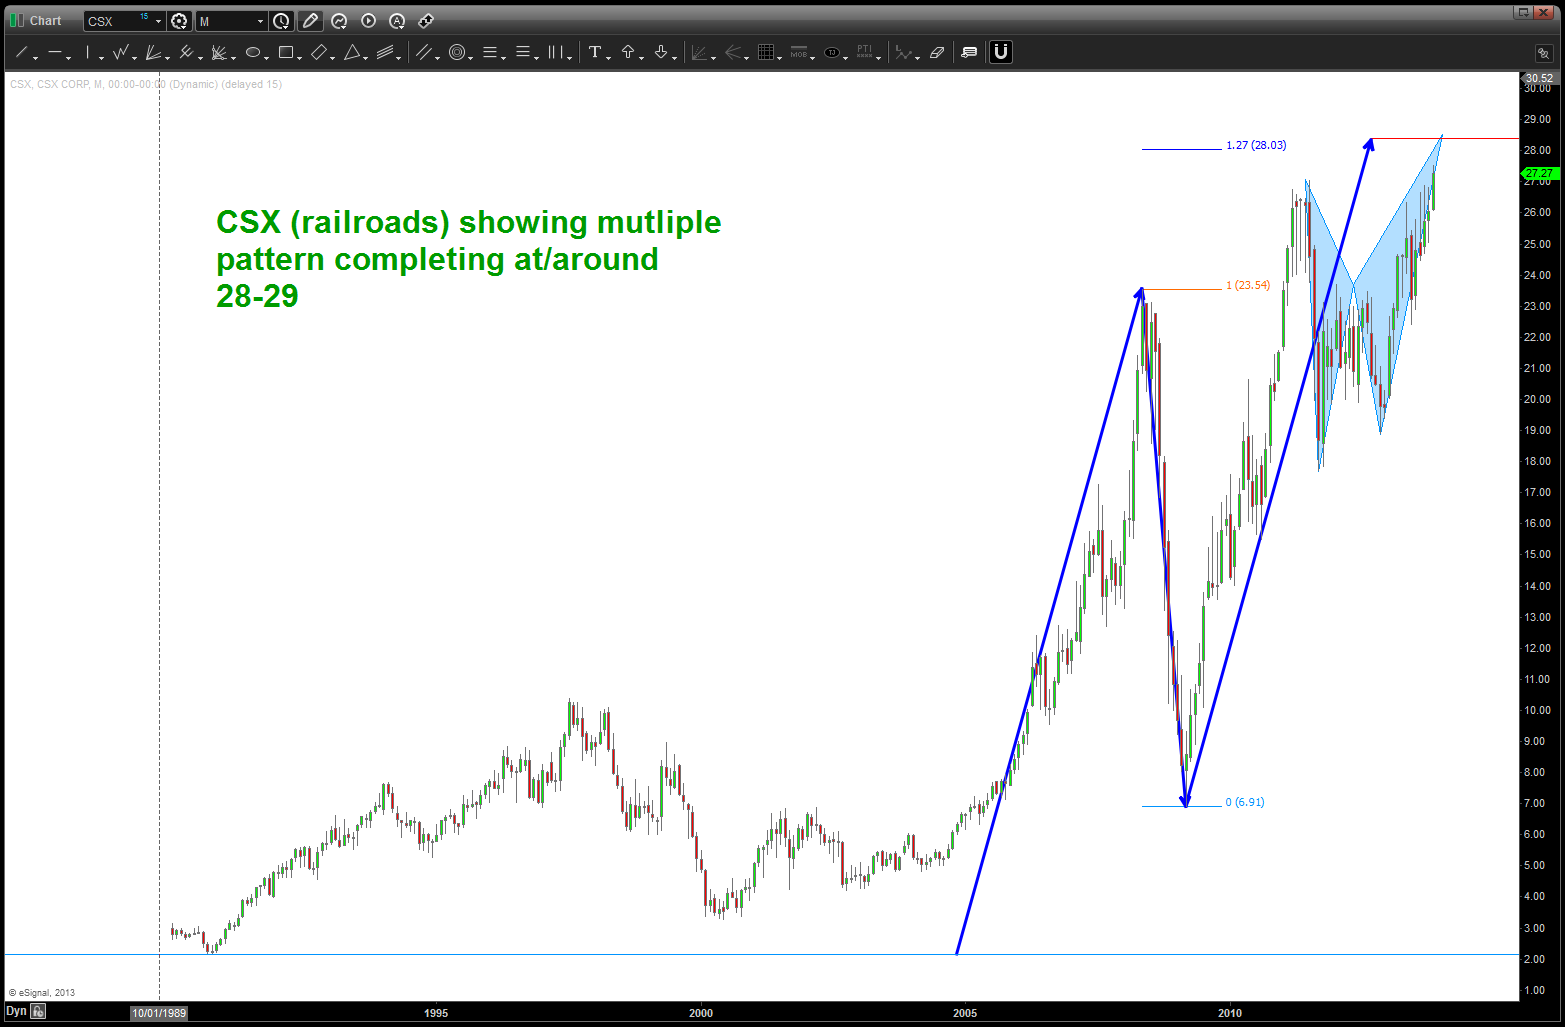
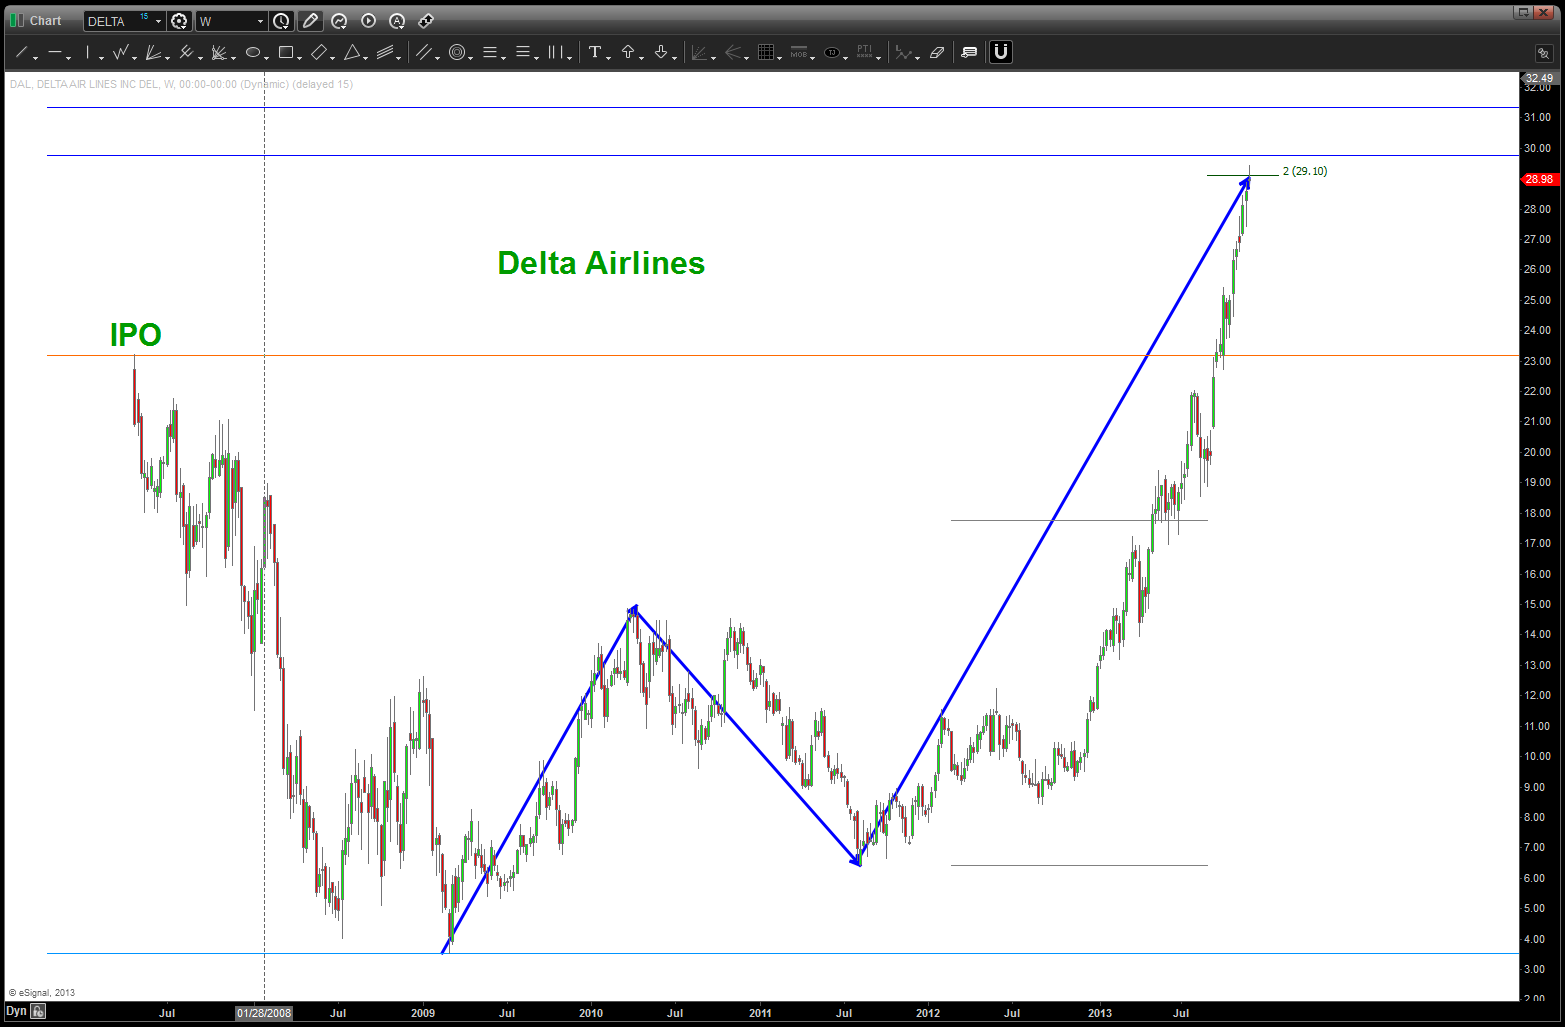
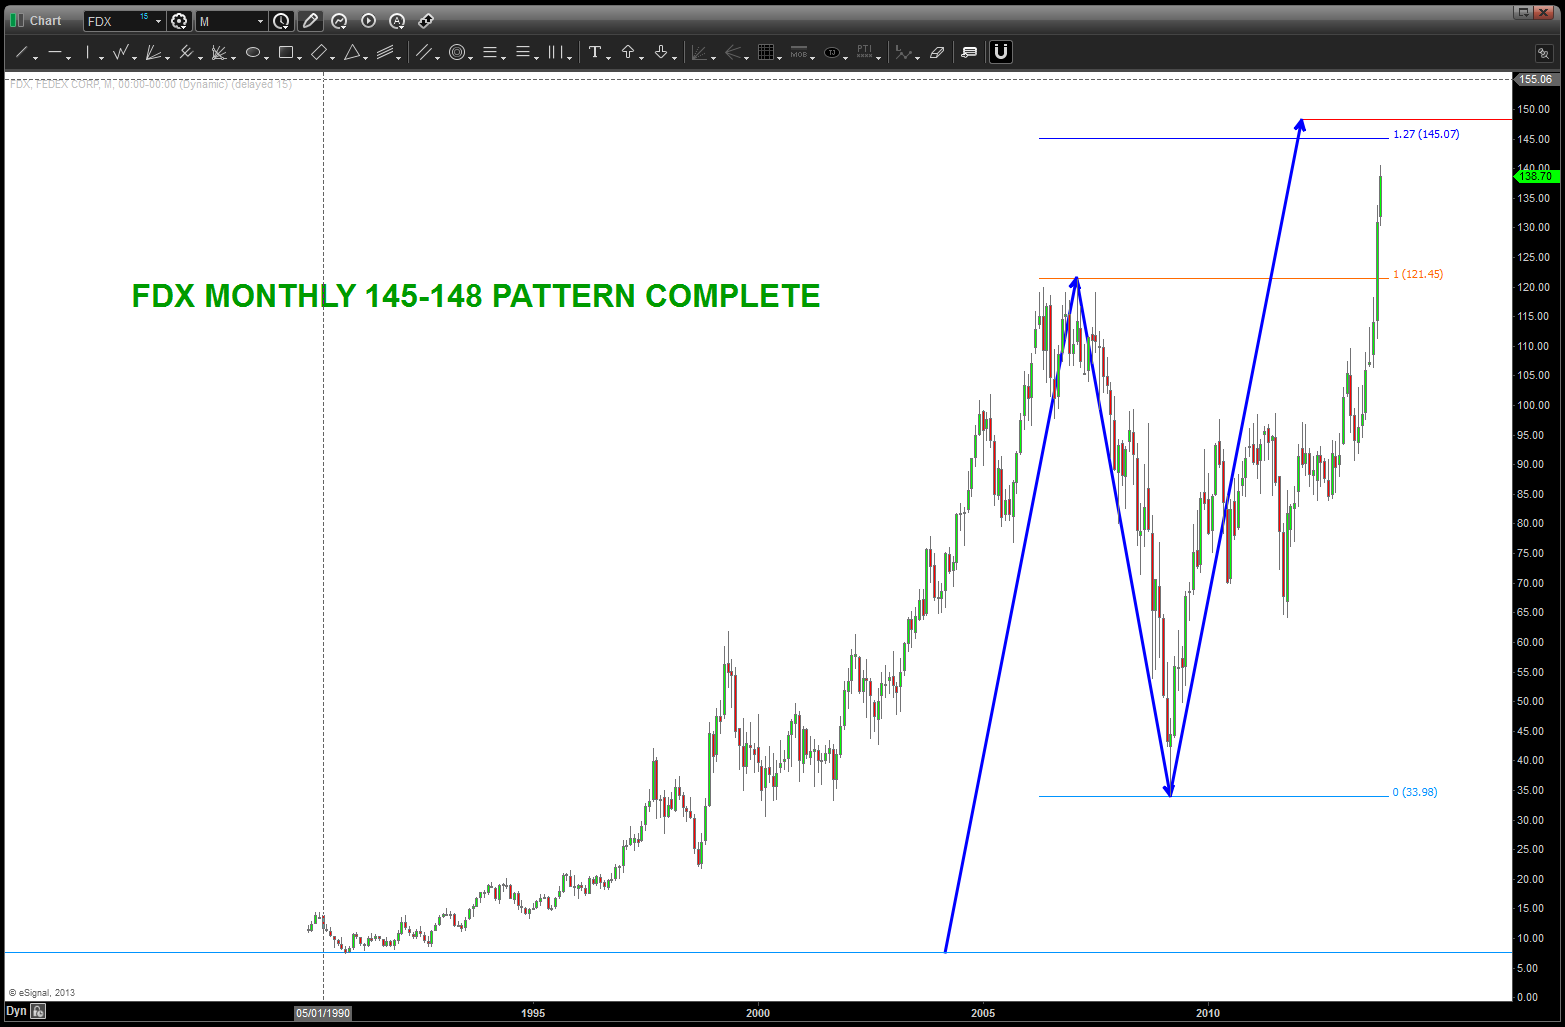
 so, we’ve got just a little bit more to the upside, so I decided to take a peak at the entire DJTA and look for patterns that support a bearish nature once this level is hit. take a view thru the charts, no screaming buys but I do see 1) parabolic rises, 2) monthly sell patterns appearing and 3) some stocks that topped years ago. so, be mindful of this level and, well, we’ll see if the patterns work or not ….