put the needle on the record, put the needle on the BROKEN record – caveat emptor
apologize for falling off the blog bandwagon early this week…got smacked like a brick in the face w/ a stomach bug. just resurfaced … actually got some emails from you asking where the posts are…thanks! since my record appears to be broken, thought I would add some thoughts from 50+ years of trading…each of these men are friends and mentors of mine …
Larry Pesavento (www.tradingtutor.com) put out a chart on the Shiller P/E ratio but actually added some “other” criteria to the chart in the following manner:
- Shiller P/E anything > 18 (current is 25+)
- S&P 500 at a 5 year high
- S&P 500 at least &% above 40 weeks smoothing
- Bulls > 50%, Bears < 20% (Investors Intelligence)
- Prior Instances of this happening: 1972/1987/2007
- note – in 2000 bears never fell below 2000
- note – this happened in 1929 on imputed sentiment
the most recent clusters have been in May 2013 / Aug 2013/Nov 2013 …. why hasn’t the market gone down, just a bit? Well here’s why …
mentor/friend Mike Jenkins (www.stockcyclesforecast.com) recently explained the amazing run in these terms:
“The FED buying of treasury bonds actually spills into the area of the FED buying stocks because indirectly they are. The ‘banks’ like Goldman Sachs now can borrow billions from the FED at a fraction of a percent and buy an ETF basket of stocks with 2% dividends and sell futures short as the hedge and also sell puts and calls to make up the spread difference arbitraging a good profit on the FED loan. This has had the effect of ratcheting up the market with each new buy program. The proof that this is at work is the fact that the biggest correction seen so far took place in late June when the S&P futures were expiring and in a downtrend and the September contract was at too steep a discount to roll out profitably so they had to liquidate some long baskets. This will happen again either in December or March and then there could be hundreds of billions of baskets unwinding just like the portfolio insurance of 1987. The big institutions learned in 2008 that no matter what the ‘valuation’ of a stock was, it could go to almost zero if a large enough seller was out there. They won’t wait around this time and they’ll create a ‘flash crash’ getting out…”
I’ll just leave you w/ two charts …one is the IWM (Russell 2000 ETF) and the continued march of the DJ Transports …
it’s coming folks … keep riding this wave but when you get smashed into the coral at the end of the break, hope you brought a breathing apparatus. What a great run it’s been…
one last, man, I hope I am 100% complete wrong ….
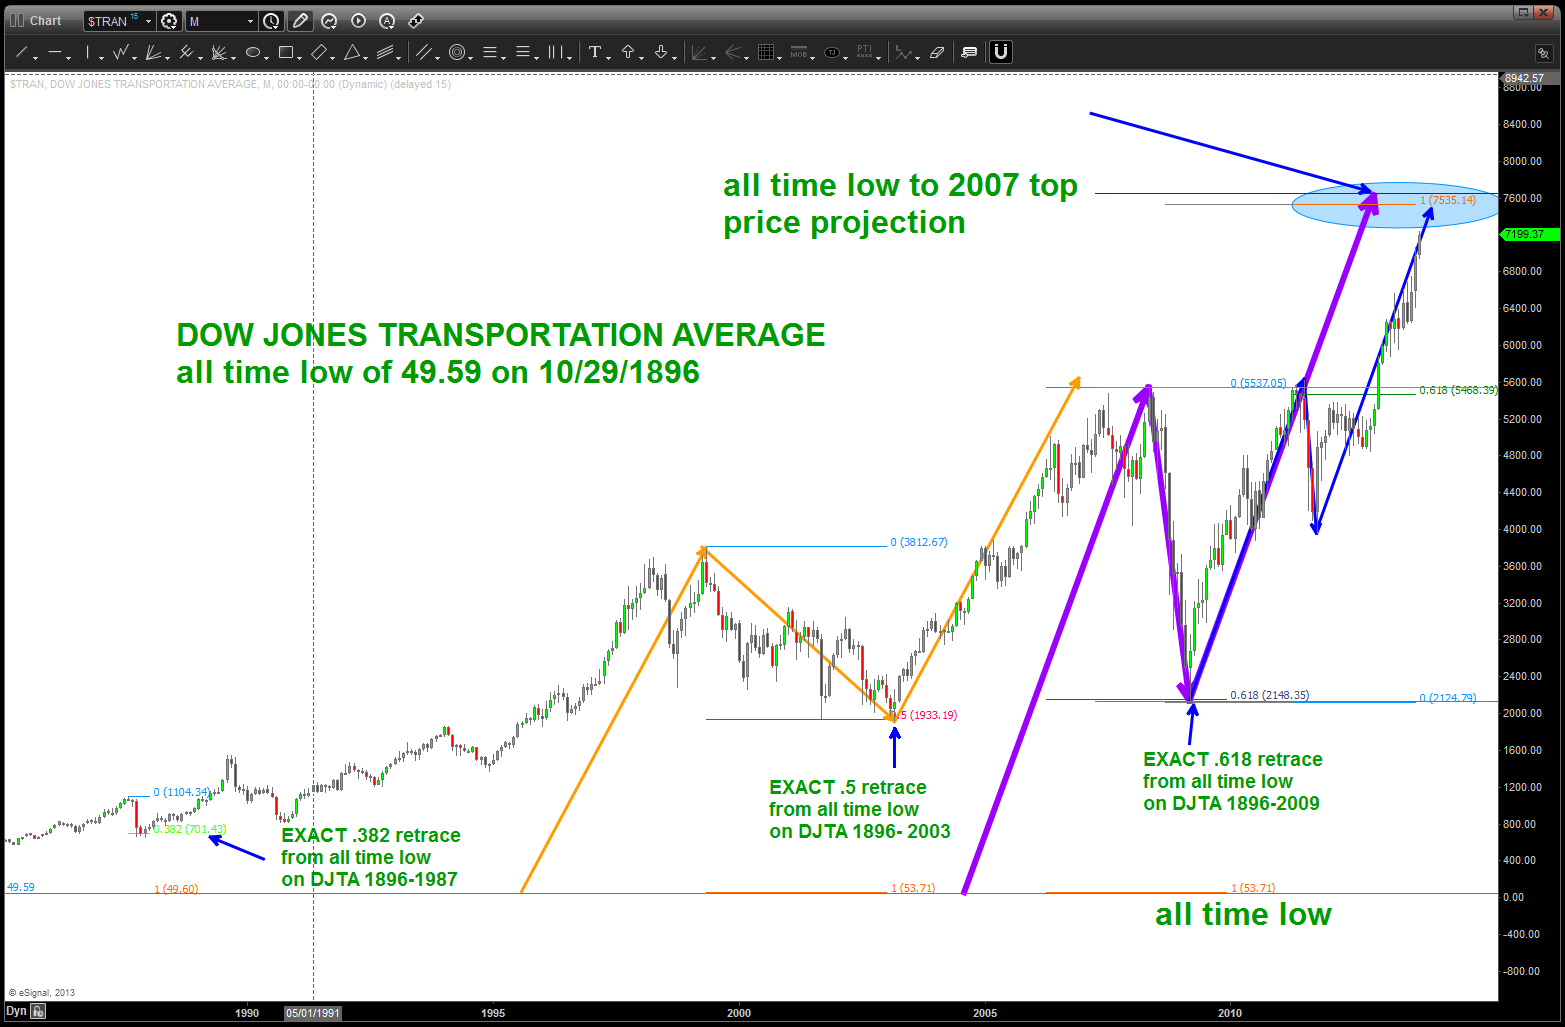
update of DOW TRANSPORTS
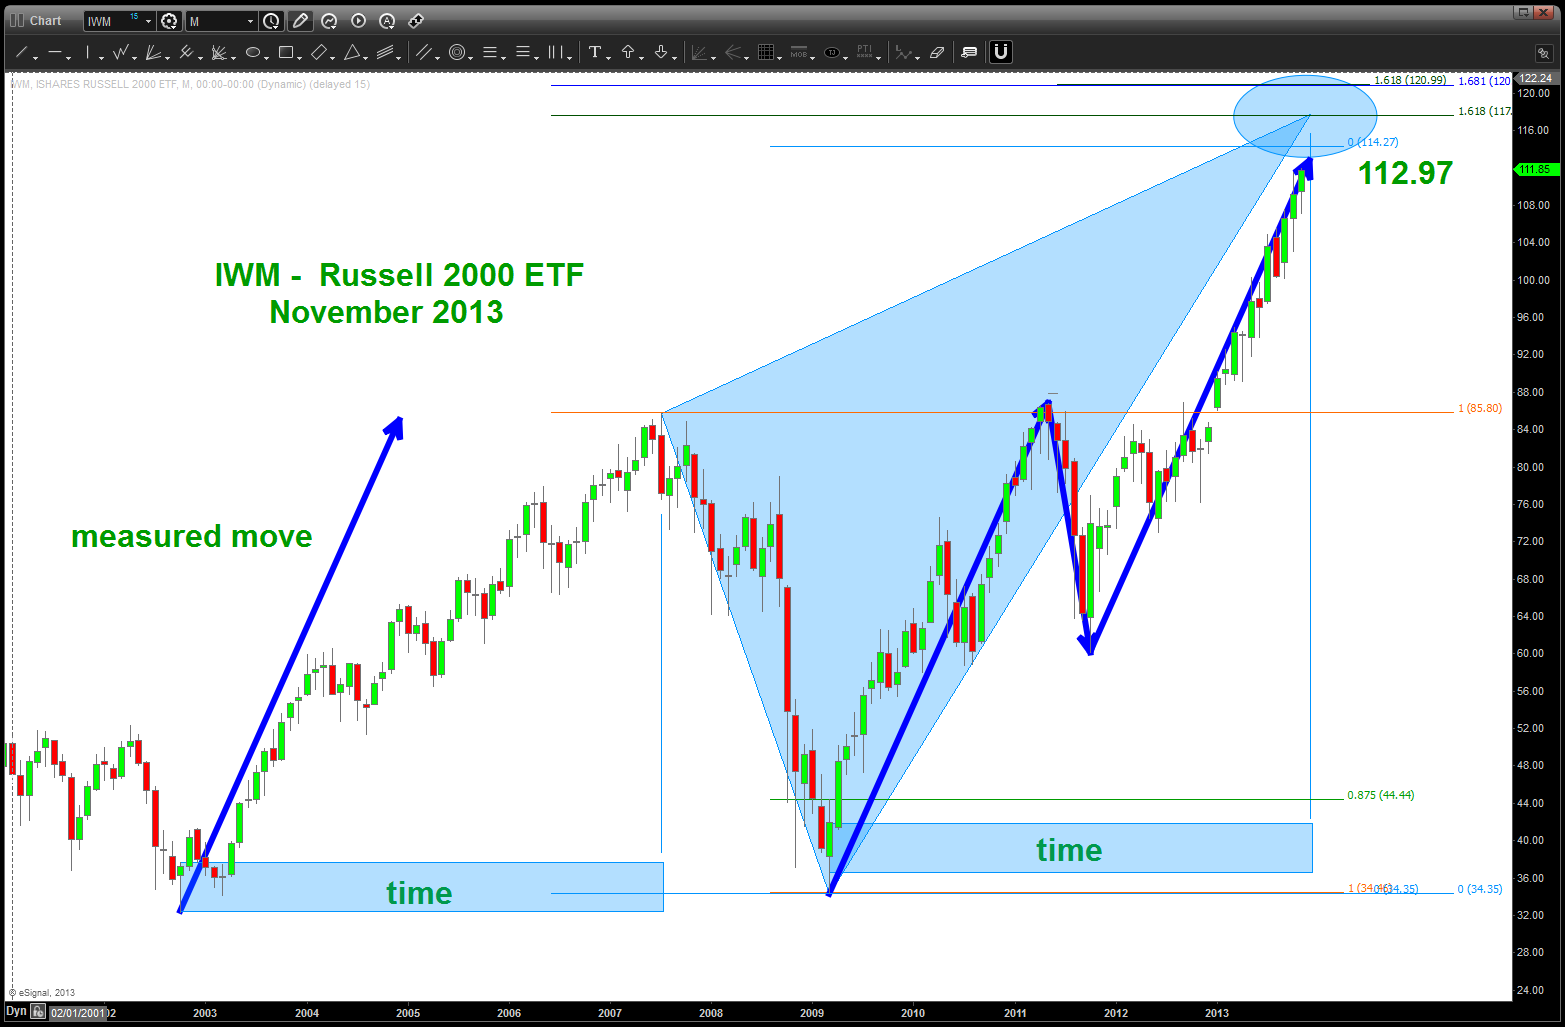
SHORT Pattern on the IWM
