DJIA – July 15, 2024

DJIA has topped or is topping a little higher.

Last post on DJIA: https://bartscharts.com/2023/12/18/dow-jones-industrial-average-december-18-2023/

Folks, if you want to see why 40,655 isn’t a random number then take a peak at the link above. I was taught this technique by my mentor and friend, Michael Jenkins, and it’s basically using logs – the actual numbers – for projections. In the case above, I noticed something interesting w/ “musical note E” as its projection was present – almost to the point – at the highs in 1987 and 2007. Yeah, no kidding, take a look.

Hence – 40, 655 is a key level and take a note, just a little higher is my favorite technique – Mr. Measured Move.

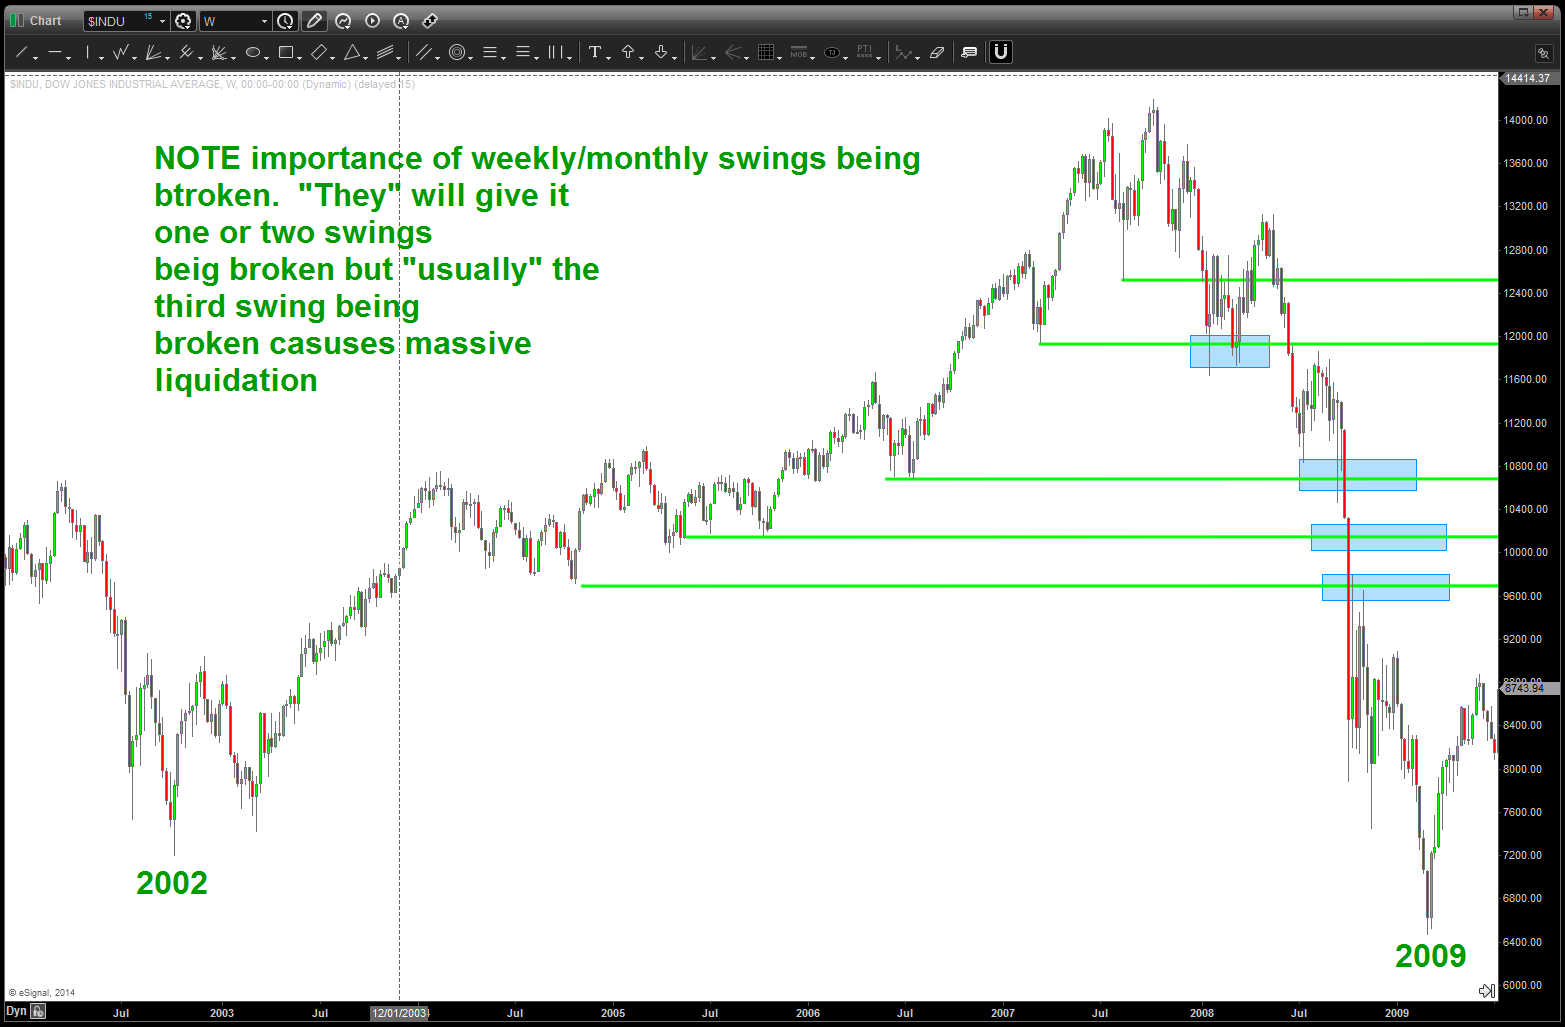
Now, want to see something amazing? Take a peak to the left side of the chart and you’ll see the harmonics of EVERY MAJOR move in the DJIA. Amazing.

So, just a little higher than the level above, is the measured move and then, when we go down to the daily, you’ll see an almost perfect three drives to a top – right at our level! Can’t make this crap up peeps, can you?

So, that red zone is my target area.

Of course, I don’t have to remind you that at times all this work gets smoked and run over like a freight train. Hence, you never know folks.

One last, thru a little numerology in there … no kidding as I was typing it just came to me to “check out” the current high w/ the all time low.

1.4142 = square root of 2.

28.48*1414.2 = 40, 283

And, let’s not forget this amazing trend line (hint hint from the all time low) that we are batting up against. Yes, I know I truncated the high in the late 1920’s. The reason I did that is because it fits nicely the rest of the price chart. It “looks good” to me.

The .382 of the entire darn run from 28.48 is – basically – 25,000. I’ll take it and, in the big scheme of things might seem like a big correction, but it really isn’t it. Depending on the environment going around, that might be a superb BUY to get into this insane run.

Who knows, but for now, I’m thinking we hit the breaks for a bit.

Dow Jones Industrial Average – December 18, 2023

Reference Post: https://bartscharts.com/2021/01/20/how-logarithms-music-and-math-yield-40655-as-a-target-for-the-djia/

For those that have been following me a while, you’ll know I enjoy using some mathematical methods to derive targets. I’m not going to dive into the math behind these calculations but I am leaving a copy of the spreadsheet so you can see and test the hypothesis if you like. If/when I’m wrong, please let me know and I’ll correct.

Using logs and musical notes based on the equal octave scale of music, the note of “E” has shown up at pretty much THE major tops of our past century. 1987 and 2007. So, I just moved up another octave and calculate the 40K + ish target shown below. I was always wondering if … or how …we would get to that “number” and we are now w/in percent of that target.

What really gets me excited is that we have a ton of “other” targets coming in to this area/zone. Wowza … I honestly have NO IDEA what is going to happen … but things are certainly lining up.

Let’s wait and see!

Targets a plenty ….

02/24/2020

UPDATE: well today was a pretty smashing day as “days” go but in the big picture it’s really nothing. but, he fact that the NYSE Index hit the target – from the all time low – so nicely, we do have to be defensive as explained, roughly a month and a half ago …

updating the NYSE Index for potential targets and you can see 11500-12100 ish as the most likely move … that’s roughly 7-20%. yes, I know that is a big range but all I’m doing, for now, is looking at past corrective measured moves and projecting down. as can see by the below chart, the blue and red arrows have been responsible for pretty much EVERY correction for the past 20 years. so, isn’t it a high probability that this is where the market will go? Seriously, take a few minutes from your ADD Social Media frenzy to study the chart below … folks, it’s EXACT. EVERY CORRECTION HAS BEEN EITHER THE RED AND/OR BLUE ARROWS. also, take a peak at the 2007-2009 thump. that correction was harmonic to the blue and red arrows being 2.236 (square root of 5 and one of our ratios) * blue arrow and 2.618 (Fibonacci) * red arrow. hence, all of the corrections have been harmonic. now that being said, we have finished a LOT of 5 wave sequences sooooo this corrective move might go a little deeper than any of us think BUT a pattern will emerge to give us an opportunity to BUY … so just chill out, turn off the news and, well, hang on.

rounding out everything from the previous post:

if you have been following my blog of late, I’ve slowed down posting because I was ‘waiting’ for some targets to be hit … it looked like a high level broadening triangle was at work – WRONG. 🙂 and w/ the recent breakout to the upside I had to erase pretty much all of the major indices and, well, go LONG TERM and look for ‘other’ patterns / targets to come into play … well, they have and did last week.

here’s a look at the long term targets that have been hit or are less than 1% away from being hit. if these charts were intraday or daily charts then I would ‘wait’ for 1% but when, in the case of the DJIA, we are looking at a projection a mere 124 years in the making then I’ll take a percent here or there …

in no particular order …

Dow Jones Industrial Average: the all time low on the DJIA was in 1896 at 28.48. Using that low as A we move the line sector AB into the high of 2007. Mulitplying that by 1.618 to get the 1.618 price projection we get 29415. Looks like that was hit on Friday. also, note the dashed green lines going from the all time low up into the 2007 high. same measured move into the 29415 high.

if we put a 14 period RSI on the chart .. yup, we would have bearish divergence present.

New York Stock Exchange Index: take time to study the notes on the chart. bottom line – multiple confirmations (different techniques) of strong resistance

NASDAQ: 1.618 price projection target hit and closed right on it Friday. Also, note we have an overlapping 1.618 extension target hit …

one last, our target zone for the XLP/NYA ratio was hit … continued strength will show the defensive move into staples by the big boys. watch this ratio closely ….

lot’s of cool math, music and square roots – the NASDAQ getting ready to run?

it was ALL THE WAY back in Feb 2015 that I did a post on the upcoming resistance of the NASDAQ and then the breakout to new highs … did it for Andy @seeitmarket here:  http://www.seeitmarket.com/nasdaq-trend-line-converging-with-2000-high-breakout-14142/

in that post I wrote:

“let’s remember that this is a 40+ year chart, so setting up that move could take some time.”

page_16-09-24_10-48-53

one could argue it took almost 20 months …sheesh. anyway, let’s take a look at some “stuff”

how “strong” is the NASDAQ?  Do a ratio analysis quick look:

page_16-09-24_10-09-00

what are we doing here:

  • make a ratio: NASDAQ / DJIA
    • IF chart going HIGHER THEN the NASDAQ is stronger than the DJIA
    • IF chart going LOWER THEN the NASDAQ is weaker than the DJIA
    • NOTE, we’ve been slowly and steadily stronger than the DJIA (chart doesn’t lie) but NOTE there has been no BIG move, yet.
    • Stair Steps UP (where no swing low is broken) are powerful indicators of an underlying trend ….this trend is strong in a relative strength sense…
    • folks, again, IT TOOK 14 YEARS for the NASDAQ relative strength to retrace .382 percent of the 2000 blow off tech top.  Slow and steady move higher …
    • HERE’S the KEY …note the RSI.  the support transition that has occurred tells you that the market has possibly shifted into a much more bullish mode and is one that should be noted and taken seriously!  frankly, we might be on the verge of a big parabolic move like 2000 … g
  • PATTERNS work ….note the blue shaded areas, those are “likely” targets for this move … could it go to new all time highs? Yes, the RATIO could do that but, for now, let’s pay attention to the breakout about to occur at the .382 (red line)

page_16-09-24_10-25-57

the chart above is a “long term” LOG chart of the NASDAQ from it’s all time low …

  • note the two red trend lines.  the lower trend line is pretty powerful and price is just clinging to it …with this breakout to a new high I believe the NASDAQ has, at a minimum 10% move coming into the 6100-6200 level.
  • also – NOTE the FRACTAL on the RSI.  It certainly appears to be doing the “exact” same move ..
    • a high, a couple bumps and then a dump into a low and then a move higher to build negative divergence.

6100-6200 represents THE AB=CD from the all time low and a 1.27 extension from the 2000 high … as a pattern recognition expert – this SHOULD BE SIGNIFICANT RESISTANCE.

page_16-09-24_10-35-06

“I think this is a song of hope …” Robert Plant Live Stairway to Heaven

The S&P 500 has been climbing a stairway to Heaven ..

download

folks coming into 2015 we had some pretty strong patterns appearing.  some worked and some didn’t – isn’t that what we expect? that being said, it was prudent to be cautious due to their presence.

here’s what I posted around a year ago:

“Let’s don’t jump up and down and scream the BEAR MARKET is here till this chariot of the bulls breaks a swing low.”

so, while we’ve sold off for the past couple days let’s not go crazy.  we have broken ONE swing low and that’s it, and it’s ONLY a weekly.  WE HAVE NOT BROKEN A MONTHLY SWING LOW.

so, keep it ALL context of the big picture.  We break a swing low on a MONTHLY and then a second then we have “issues.”

but for now, EVERYONE knows this puppy was on steroids and need some shaking out so let’s look for a pattern to BUY on a weekly (hint hint – it needs to breathe a bit) and if a bear I would still be very cautious.

what do we know and see … ?

  • we know a weekly swing low is about to be taken out and we’ll know that ONLY WITH THE CLOSE TOMORROW … we also know this has NEVER happened since March 2009 bull market began.

so, here’s the logic:

  • if weekly close below a swing low … get defensive.
  • if not, then keep in mind, we have pressure on the downside and it probably needs to breathe down so just chill …

enjoy the post below .. you’ll see some of the patterns were early, some were spot on.  that’s not the point .. the entire post below is around the market action around a SWING LOW or SWING HI and to respect them — very very strongly.

let me know if you have any questions.

chart below is the ES .. note the red horizontal swing lows. those have never been broken on close. it might happen tomorrow …

Bart

S&P Futures Swing Lows since 2009


chariot-topper

As we have discussed multiple times in this venue, the move since 2009 has been one heck of a ride.  This chariot of stock market emotion is, literally, off the charts.  It is at an extreme that has surpassed 1929, 2000 and 2007.  For the past 6 months it has defied the powerful cycles and patterns we follow.  However, we are at another “potential” inflection point and based on this weeks price action the chariot appears to be running out of gas.  So, objectively, the cycles and patterns we follow appear to be working.  Let’s don’t jump up and down and scream the BEAR MARKET is here till this chariot of the bulls breaks a swing low.

djia march 15 2014

Below you’ll see a quick demonstration of the Dow Jones Industrial Average from 2002-2009.  No patterns shown but just an example of the power of the swing low.  Take note, when we lose one swing low there is usually some selling and then it bounces back and, here’s the key point, it fails to make a new high.  Price might congest in this area (going either direction – up or down) and then it starts down.  One thing to watch is “usually” the third swing low. When that gives away, selling is vicious.  So, as much as we see MAJOR patterns completing let’s not get to confident.  THE MAJOR US INDICES HAVE NOT BROKEN ONE SWING LOW IN 5 YEARS.  Over the coming weeks, pay attention to these swing lows and swing highs (note the VIX chart – not one swing high has been taken out since 2007!)
swings
VIX SWING HIGHS
Also, note the Dollar Index swing low track record and the very thin neckline that is coming into play a little lower.  We’ve reached some daily extremes in metals (Gold, Silver) and the Euro and Pound.  Sentiment means nothing when a multi year extreme is taken out and one that has been tested roughly 10 times since 2012.  Folks, a lot of stops are hiding beneath 78-79 on the dollar index.  Certainly hope support holds here …
Dollar Index Swings
so, keep an eye on the swing lows and highs over the coming days and weeks … note price action after a first or second swing low is taken out and, seriously consider safety if/when a 3rd long term swing low is taken out to the up or down side ….
CHINESE YUAN 3152014
DJU March 15 2014 utility and industrials
dow jones transports march 15 2014
COPPER CORRELATIONFXI 032014 EEM 03152014

Swing Low, Sweet Chariot ….

chariot-topper

As we have discussed multiple times in this venue, the move since 2009 has been one heck of a ride.  This chariot of stock market emotion is, literally, off the charts.  It is at an extreme that has surpassed 1929, 2000 and 2007.  For the past 6 months it has defied the powerful cycles and patterns we follow.  However, we are at another “potential” inflection point and based on this weeks price action the chariot appears to be running out of gas.  So, objectively, the cycles and patterns we follow appear to be working.  Let’s don’t jump up and down and scream the BEAR MARKET is here till this chariot of the bulls breaks a swing low.

djia march 15 2014

Below you’ll see a quick demonstration of the Dow Jones Industrial Average from 2002-2009.  No patterns shown but just an example of the power of the swing low.  Take note, when we lose one swing low there is usually some selling and then it bounces back and, here’s the key point, it fails to make a new high.  Price might congest in this area (going either direction – up or down) and then it starts down.  One thing to watch is “usually” the third swing low. When that gives away, selling is vicious.  So, as much as we see MAJOR patterns completing let’s not get to confident.  THE MAJOR US INDICES HAVE NOT BROKEN ONE SWING LOW IN 5 YEARS.  Over the coming weeks, pay attention to these swing lows and swing highs (note the VIX chart – not one swing high has been taken out since 2007!)
swings
VIX SWING HIGHS
Also, note the Dollar Index swing low track record and the very thin neckline that is coming into play a little lower.  We’ve reached some daily extremes in metals (Gold, Silver) and the Euro and Pound.  Sentiment means nothing when a multi year extreme is taken out and one that has been tested roughly 10 times since 2012.  Folks, a lot of stops are hiding beneath 78-79 on the dollar index.  Certainly hope support holds here …
Dollar Index Swings
so, keep an eye on the swing lows and highs over the coming days and weeks … note price action after a first or second swing low is taken out and, seriously consider safety if/when a 3rd long term swing low is taken out to the up or down side ….
CHINESE  YUAN 3152014
DJU March 15 2014 utility and industrials
dow jones transports march 15 2014
COPPER CORRELATIONFXI 032014 EEM 03152014

around the world update … part II

Around the world update …

the link above is where you’ll find our around the world cruises since August.  this post is an update …what do we see?

  • nothing has changed, significantly.
  • none of the international indices have made new highs like the US equity markets …
  • patterns have provided resistance, BUT not necessarily overt sell signals
  • for the BEARS we are concerned about the SIZE and STRENGTH of the past two weeks of candles.  the only country that doesn’t have this feel, as we see the world (literally) is Japan.  The European ETF’s show strength in the bullish weekly engulfing patterns.
  • for the BULLS this is a good sign HOWEVER I’ve enclosed a chart of the DJIA that shows a very strong move UP from the low 9-10 days ago but a VERY significant lack of VOLUME.  the VOLUME was BIG going down and SMALL going up (in fact it decreased) hence I find this to be overtly bearish.  A very nice 5 waves down can be seen in most of all the indices except the NASDAQ but that is also completing a 1) 5 point reverse wave, 2) 3 drives to a top and 3) all of em’ are smacking into the .786 retracement from 2000.  If the US Market starts down again in a “daily C wave” or “continuation 3” we find it hard to believe that the rest of the world won’t also …
  • so, we believe this week will be pivotal …
  • last, believe it or not, the Dollar is going to be Gorilla that get’s this thing truly rocking and rolling ….one target was hit and held late Friday afternoon.

Gorilla’s juggling dynamite … and the US Dollar

Here’s a representative example of the VOLUME going UP on the way down and VOLUME going DOWN on the way up …

Feb 15 2014 DJIA

Main20140215105418 Main20140215105520 Main20140215105729 Main20140215105816 Main20140215105914 Main20140215110047 Main20140215110315 Main20140215110519 Main20140215110615 Main20140215105012


Equal Octave Scale of Music and the DJIA …

my friend, fellow chartist and trader gave me the chance to do this post on his blog as a “guest blogger”

http://allstarcharts.com/the-math-behind-historic-dow-charts/

at the time, I was watching, extremely closely, the “standard” .618 price projection and it’s importance due to using the all time low from 1896 at 28.48.  the market opened/closed in and around this level for roughly 5-6 months an then exploded higher.

one of the lesser know price projection techniques is actually based on the equal octave scale of music. this is NOT going to be a diatribe about musical theory, if your so inclined see a website like this: http://www.phy.mtu.edu/~suits/scales.html .  as a trader, I know the musical note ratio’s and I also have some fundamental understanding of the importance of square roots and their inverses and we’ll leave it at that….

so, if we take musical note F# ratio of 1.68179 and then subtract 1 we get  .68179.  that is the multiple that we project from and that nails the recent high and also intersects the expanding triangle that is bearish.  (1.618-1 = .618)

stay tuned and as we’ve been saying for a while, things certainly seem to be adding up ….

DJIA and musical note F# of the equal octave scale of music