Equal Octave Scale of Music and the DJIA …
my friend, fellow chartist and trader gave me the chance to do this post on his blog as a “guest blogger”
http://allstarcharts.com/the-math-behind-historic-dow-charts/
at the time, I was watching, extremely closely, the “standard” .618 price projection and it’s importance due to using the all time low from 1896 at 28.48. the market opened/closed in and around this level for roughly 5-6 months an then exploded higher.
one of the lesser know price projection techniques is actually based on the equal octave scale of music. this is NOT going to be a diatribe about musical theory, if your so inclined see a website like this: http://www.phy.mtu.edu/~suits/scales.html . as a trader, I know the musical note ratio’s and I also have some fundamental understanding of the importance of square roots and their inverses and we’ll leave it at that….
so, if we take musical note F# ratio of 1.68179 and then subtract 1 we get .68179. that is the multiple that we project from and that nails the recent high and also intersects the expanding triangle that is bearish. (1.618-1 = .618)
stay tuned and as we’ve been saying for a while, things certainly seem to be adding up ….
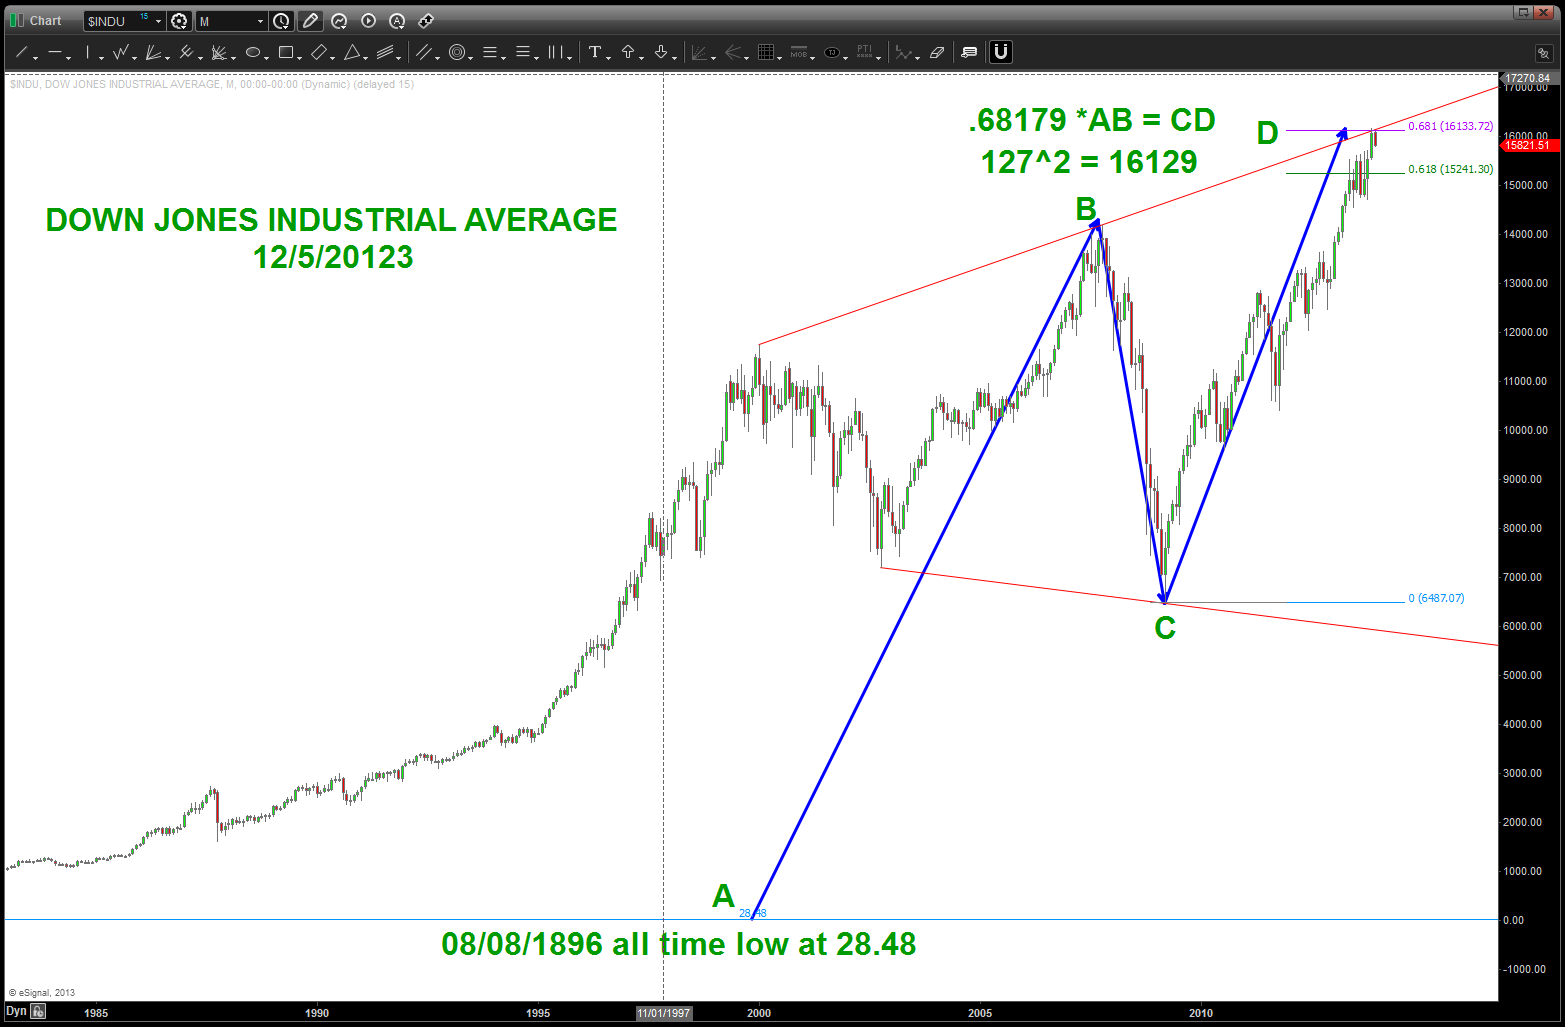
DJIA and musical note F# of the equal octave scale of music
