around the world update … part II
the link above is where you’ll find our around the world cruises since August. this post is an update …what do we see?
- nothing has changed, significantly.
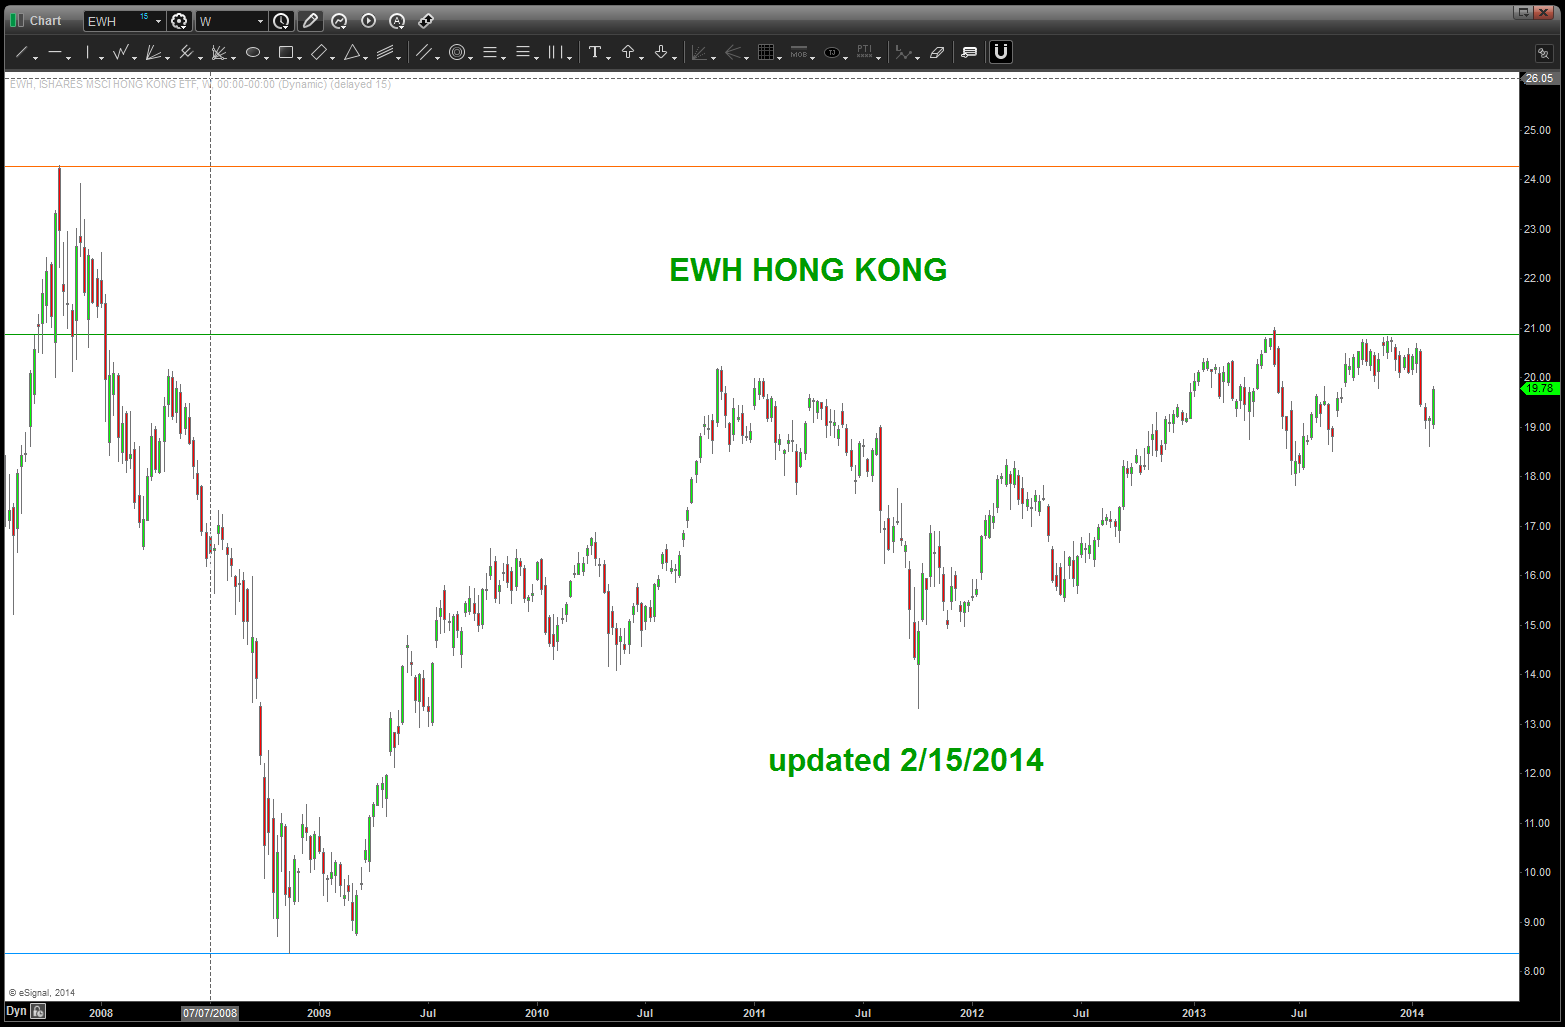
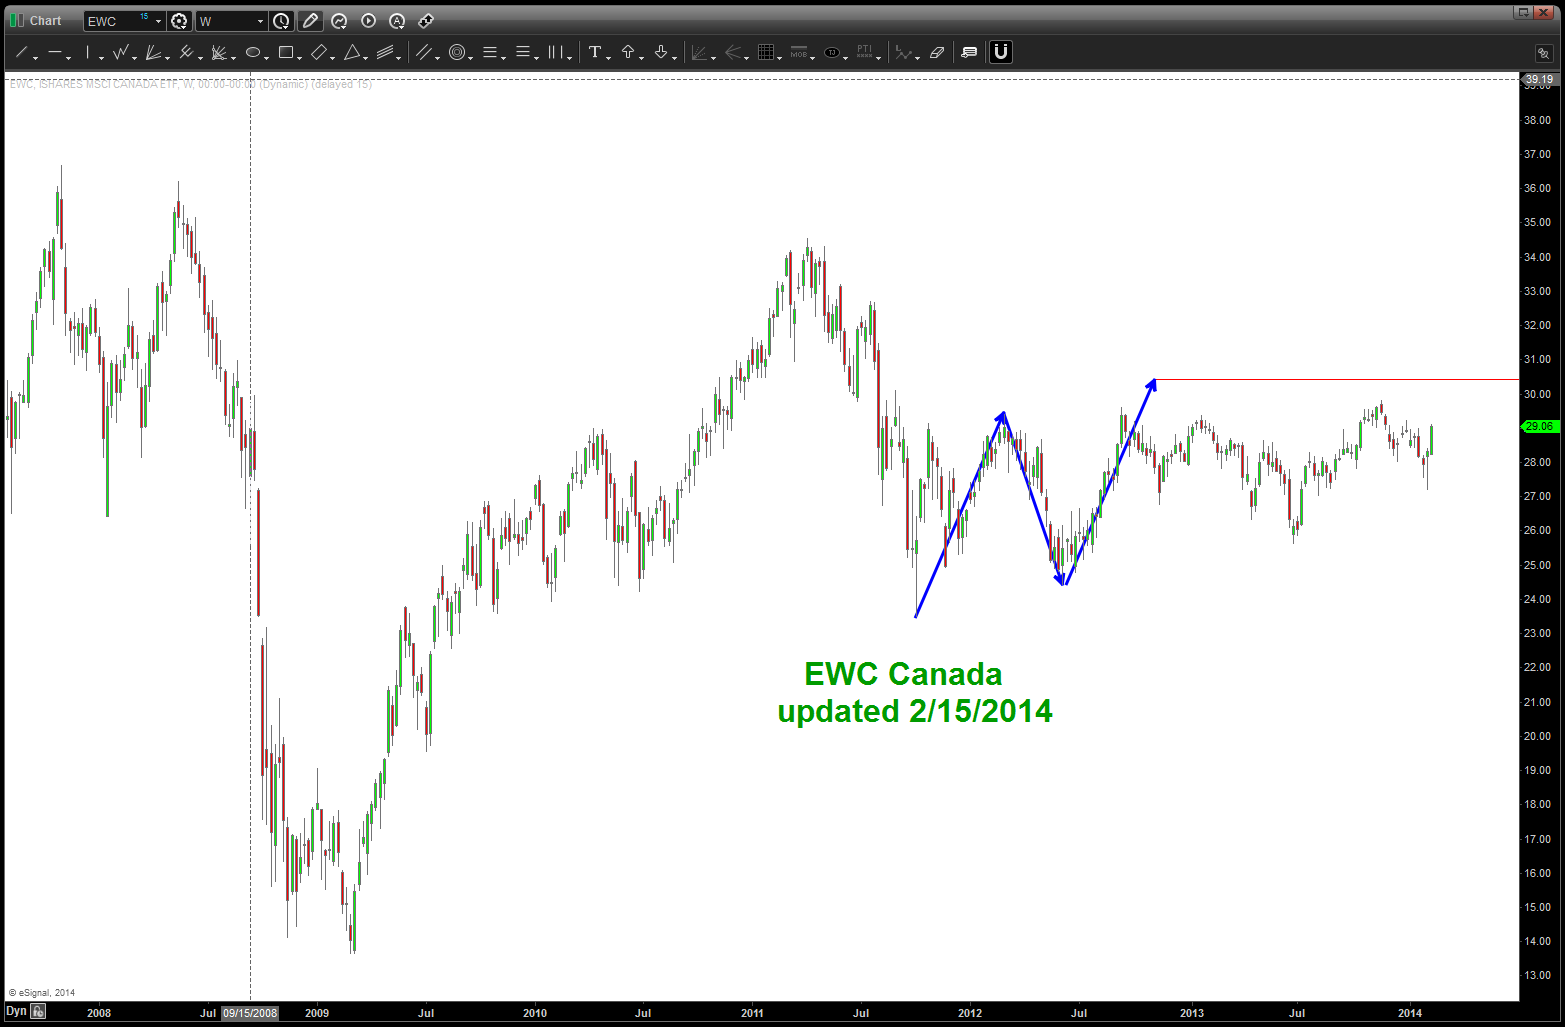
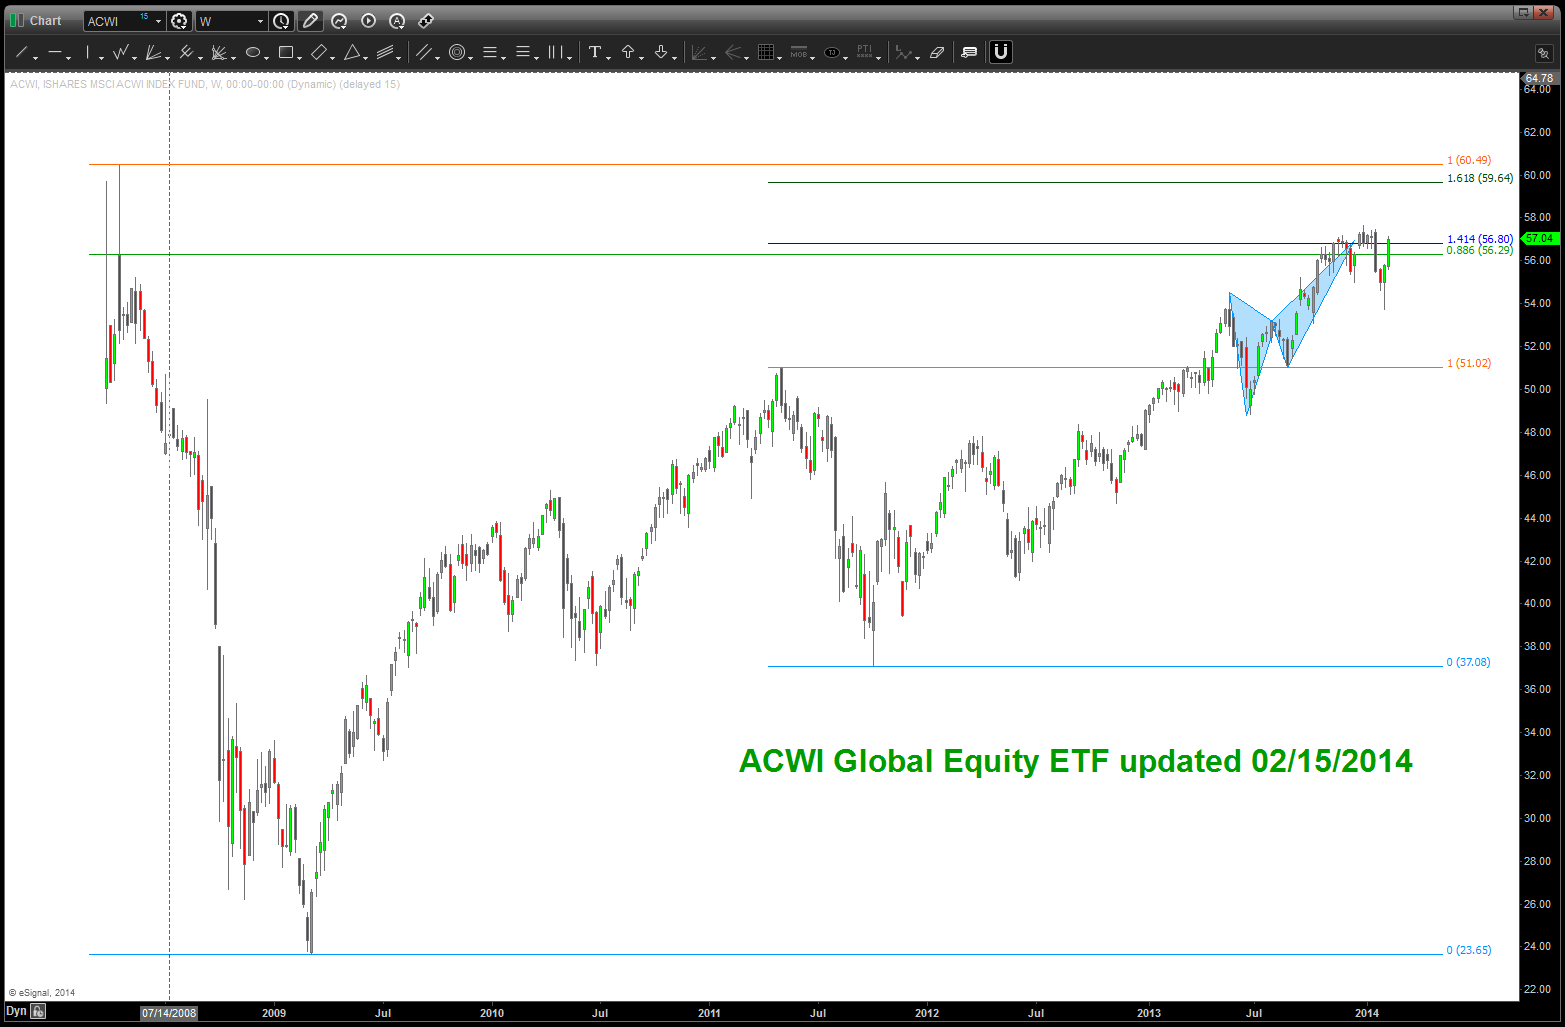
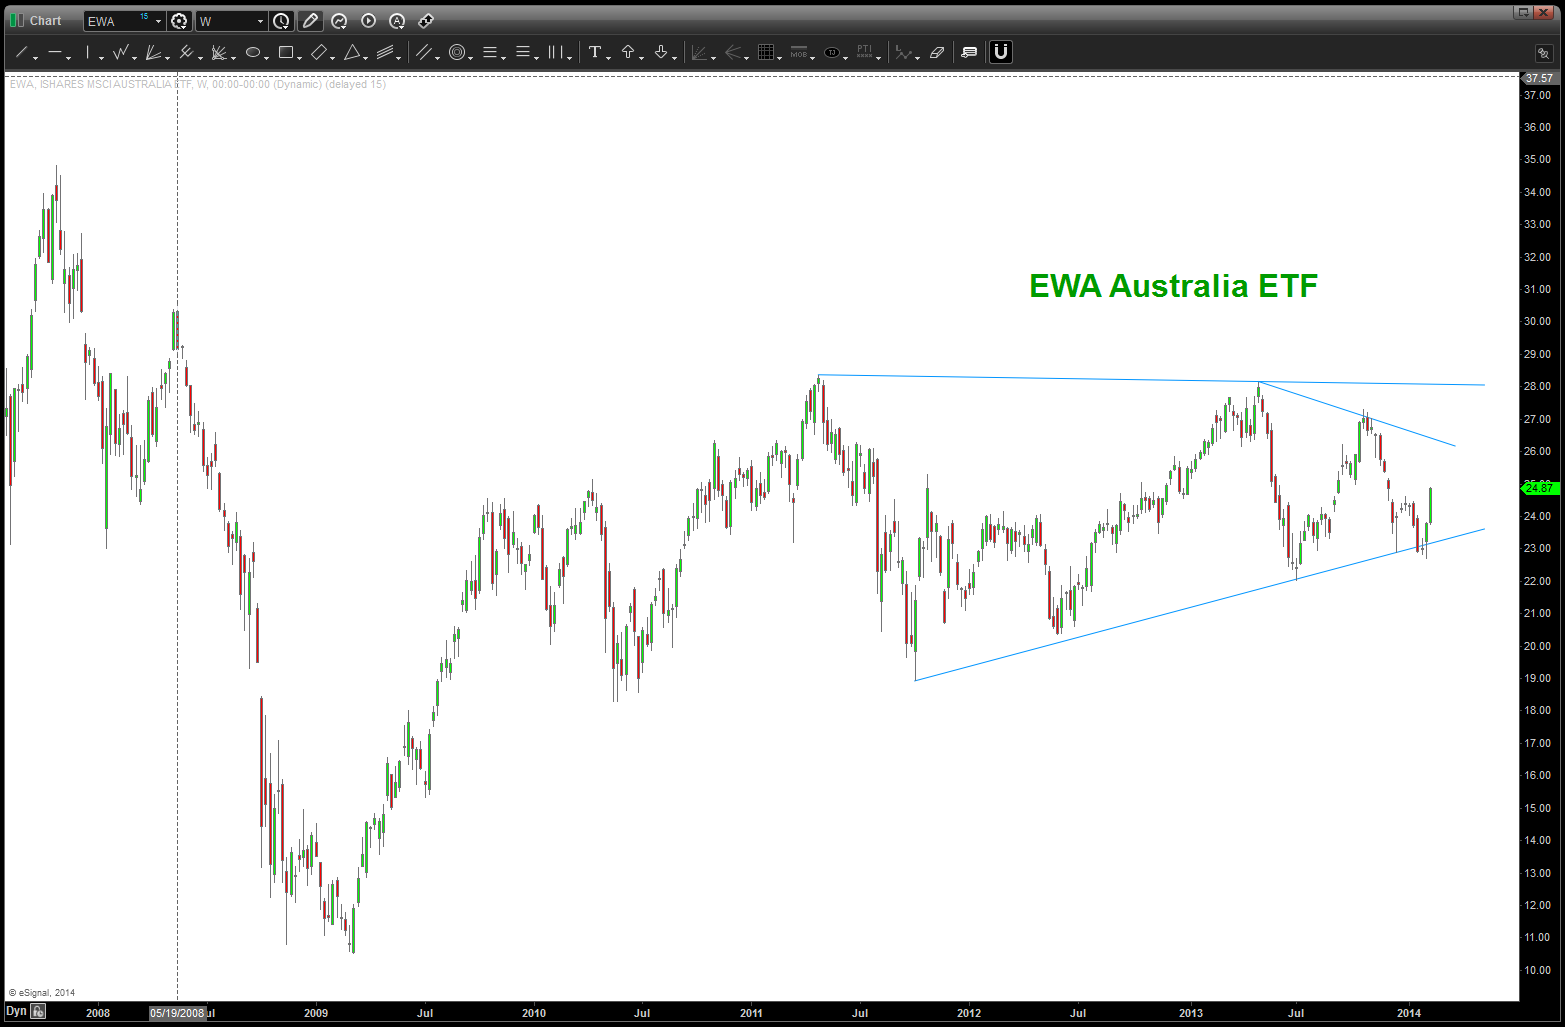
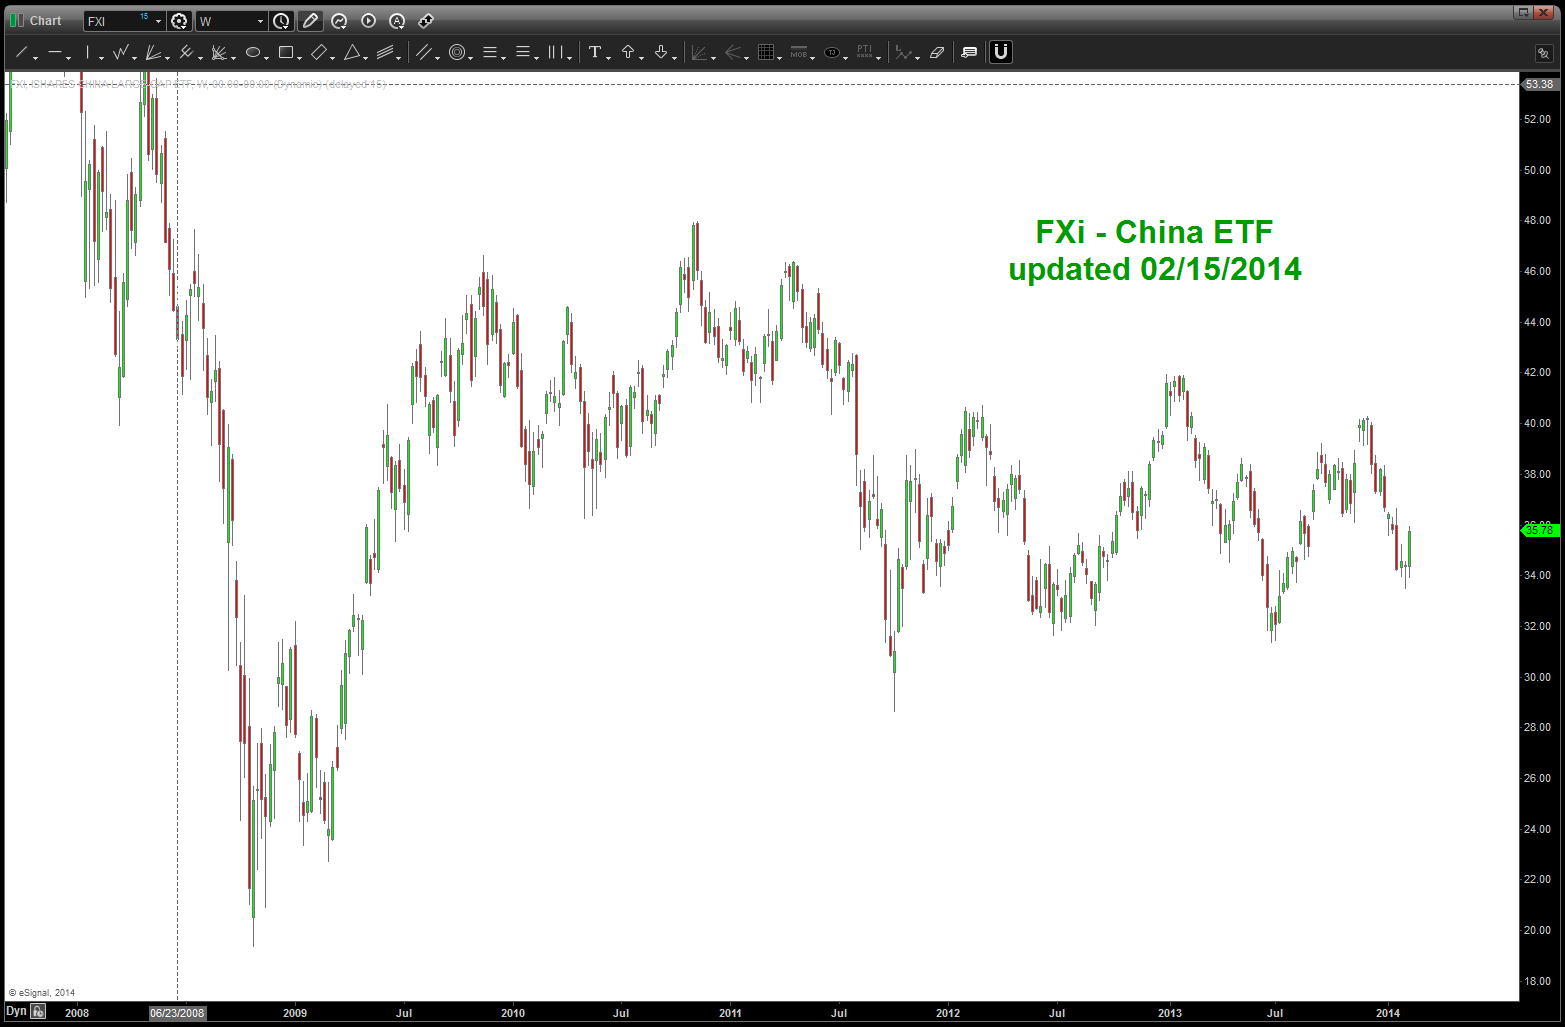
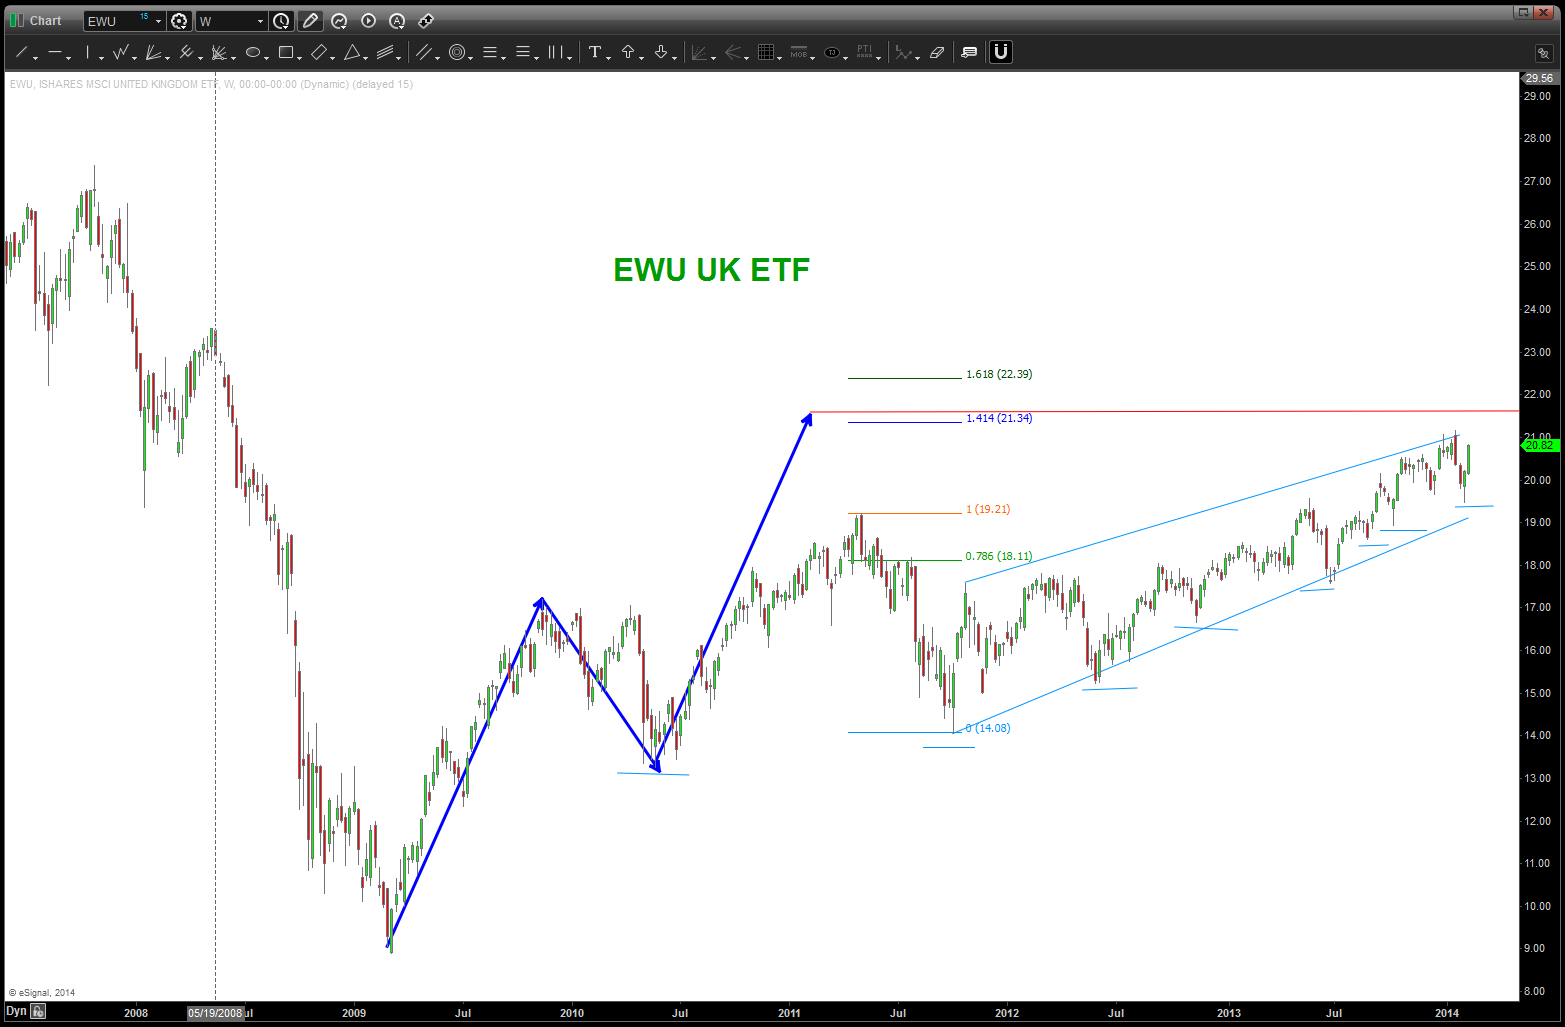
- none of the international indices have made new highs like the US equity markets …
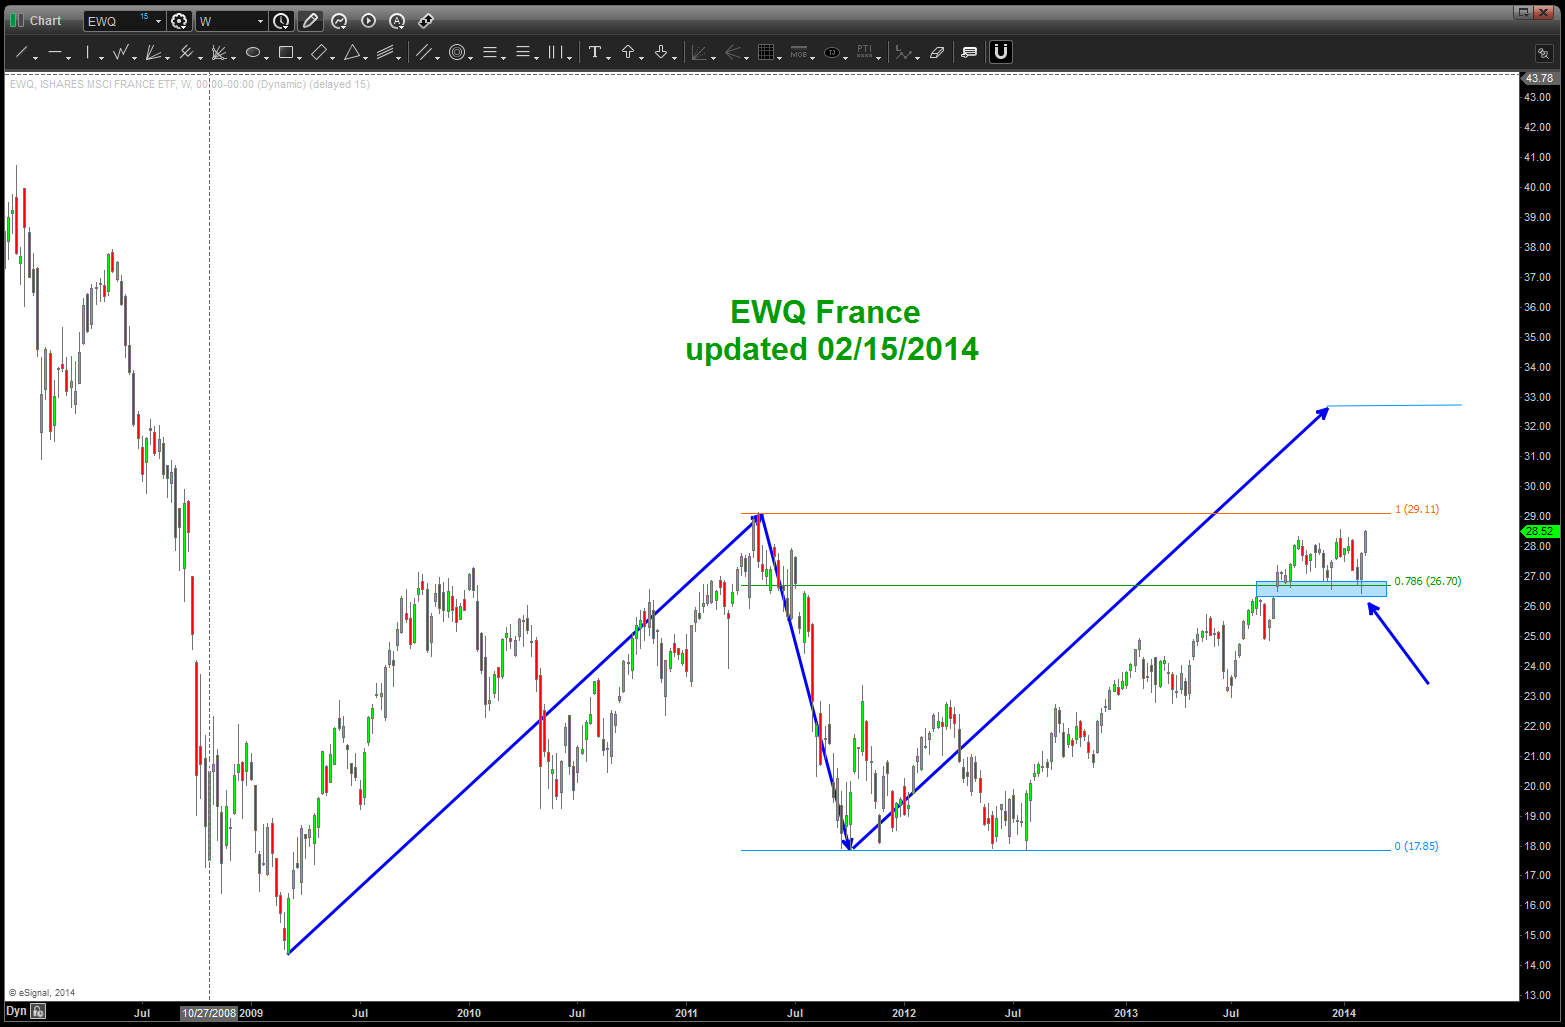
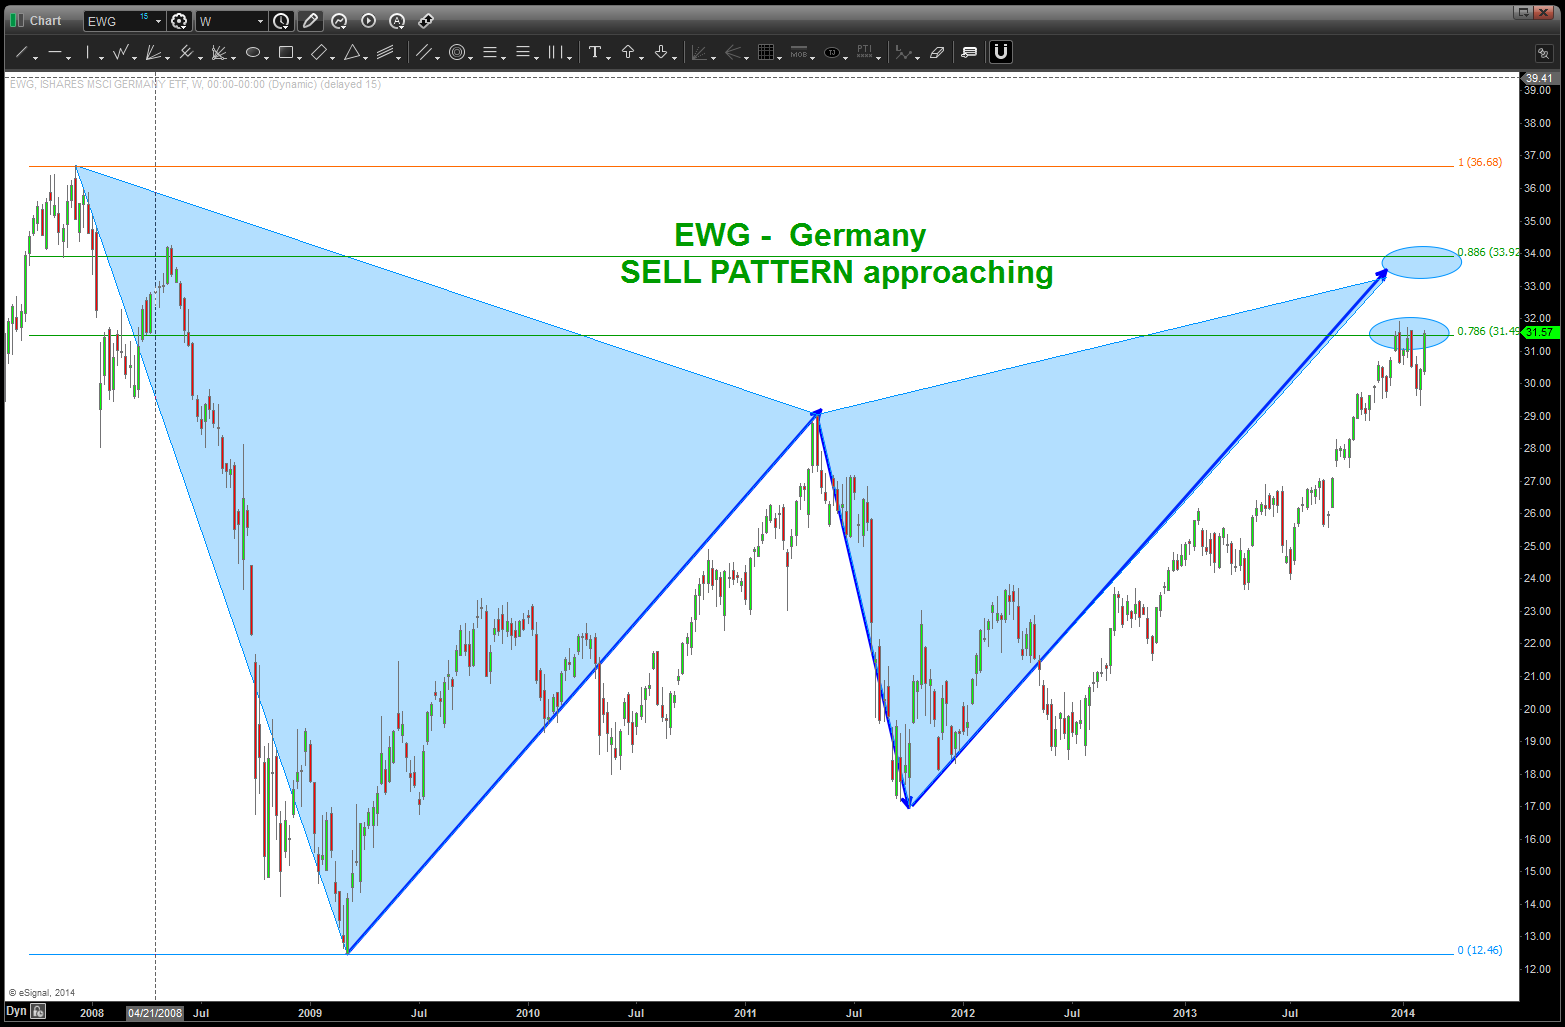
- patterns have provided resistance, BUT not necessarily overt sell signals
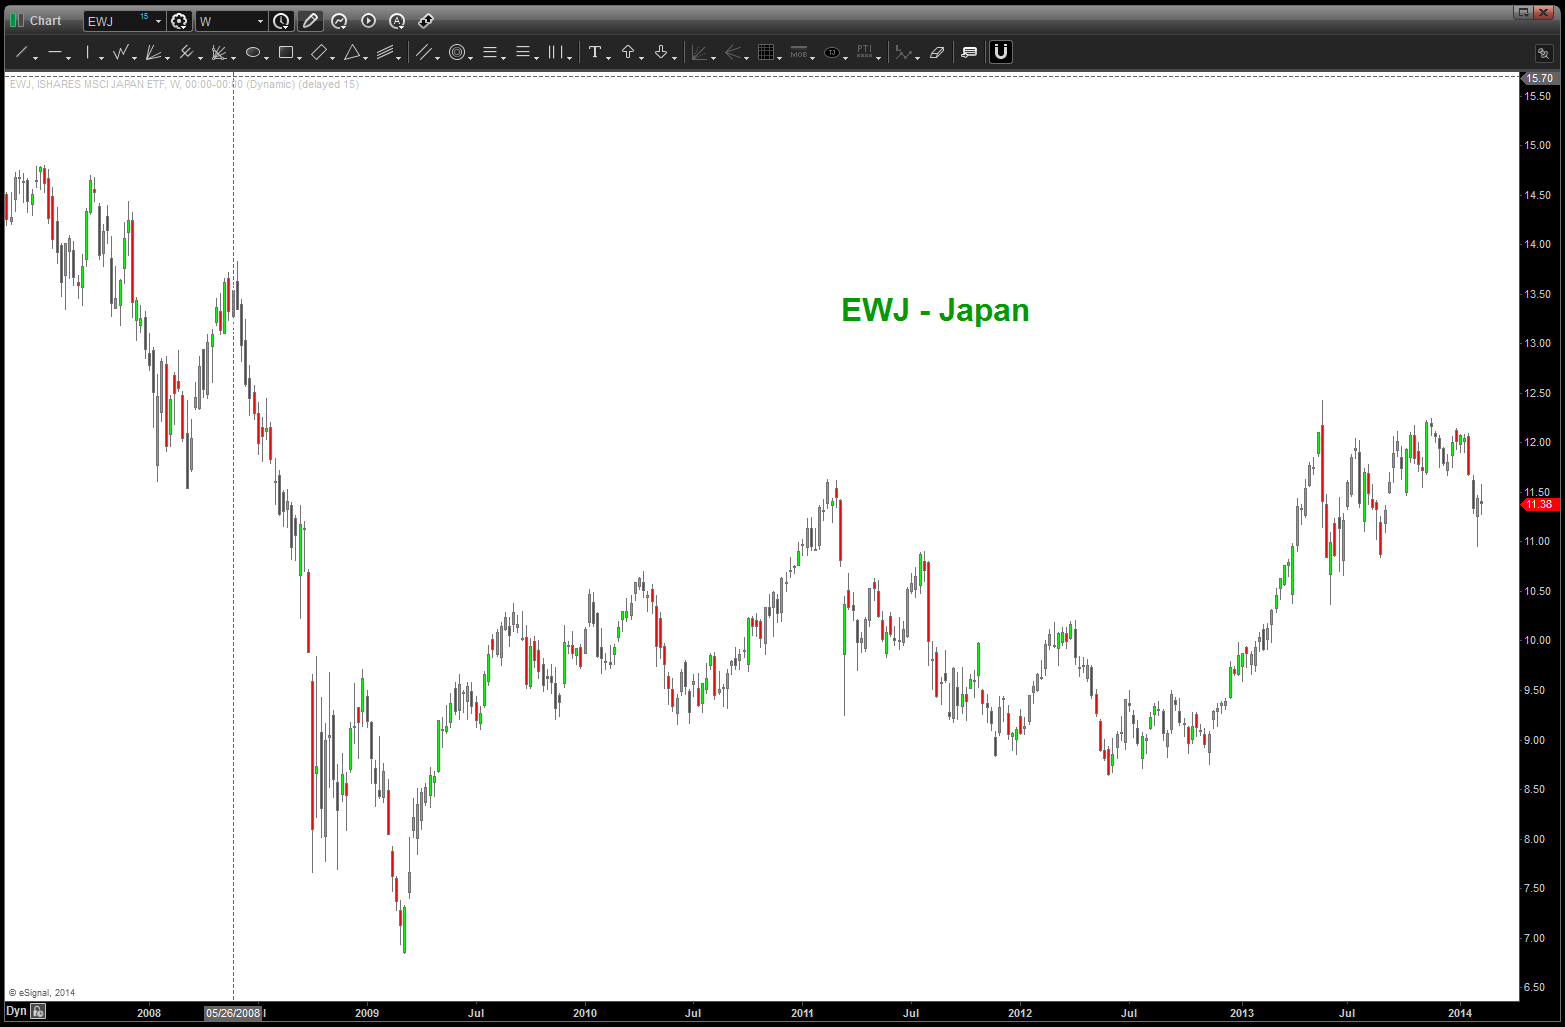
- for the BEARS we are concerned about the SIZE and STRENGTH of the past two weeks of candles. the only country that doesn’t have this feel, as we see the world (literally) is Japan. The European ETF’s show strength in the bullish weekly engulfing patterns.
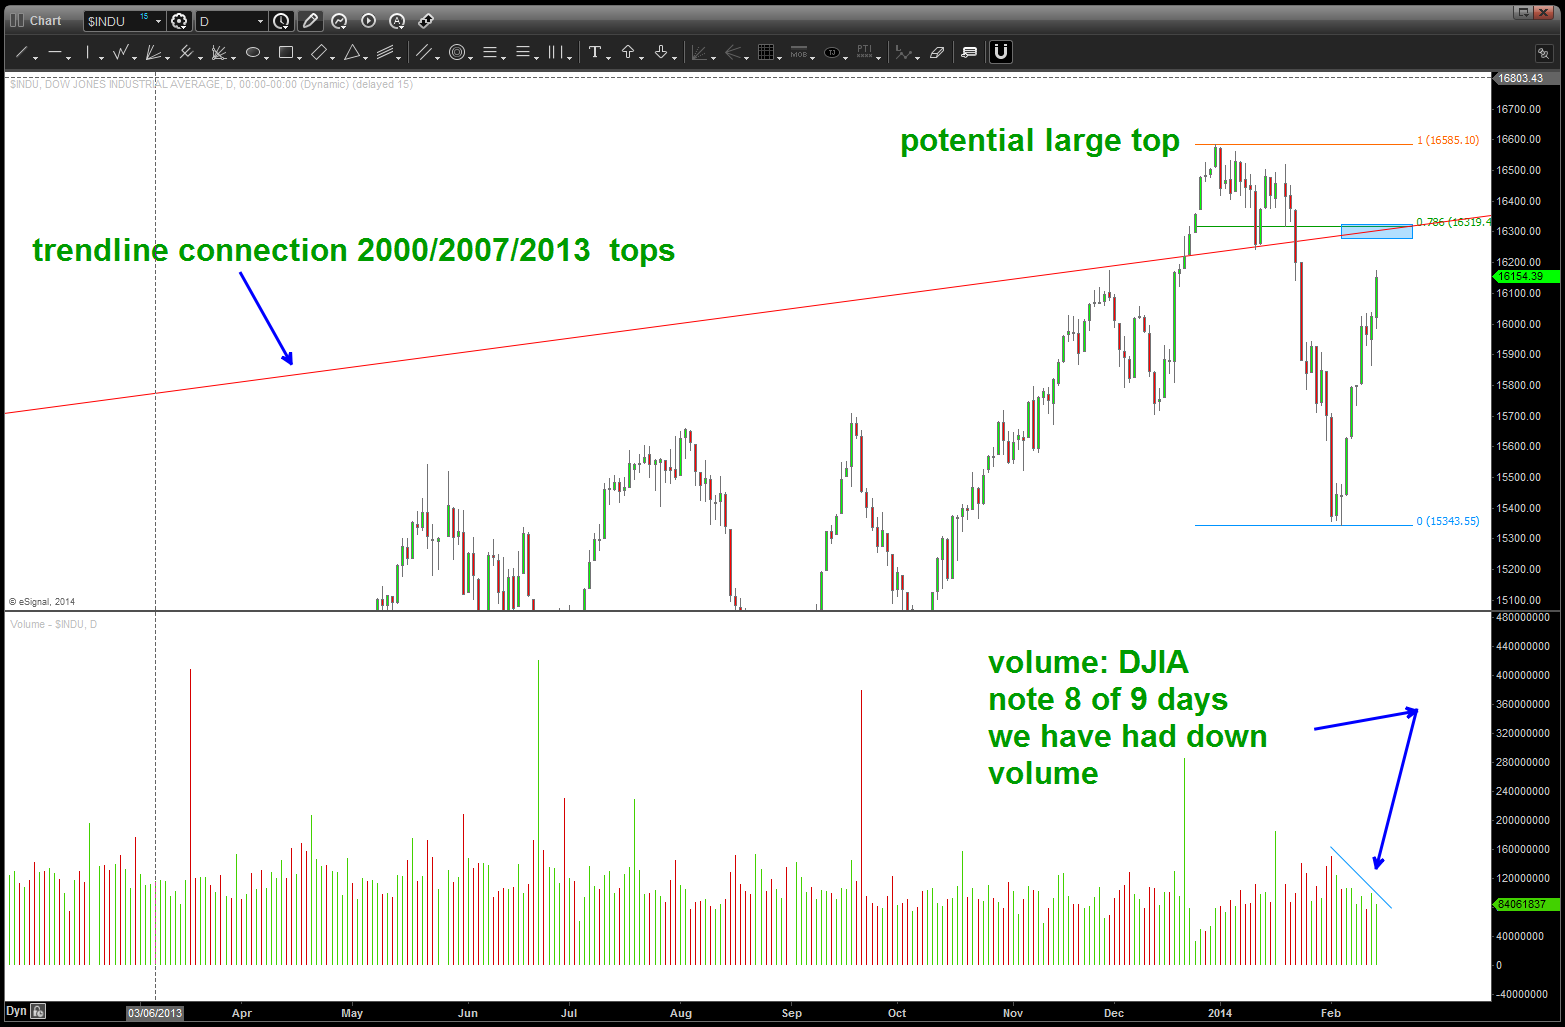
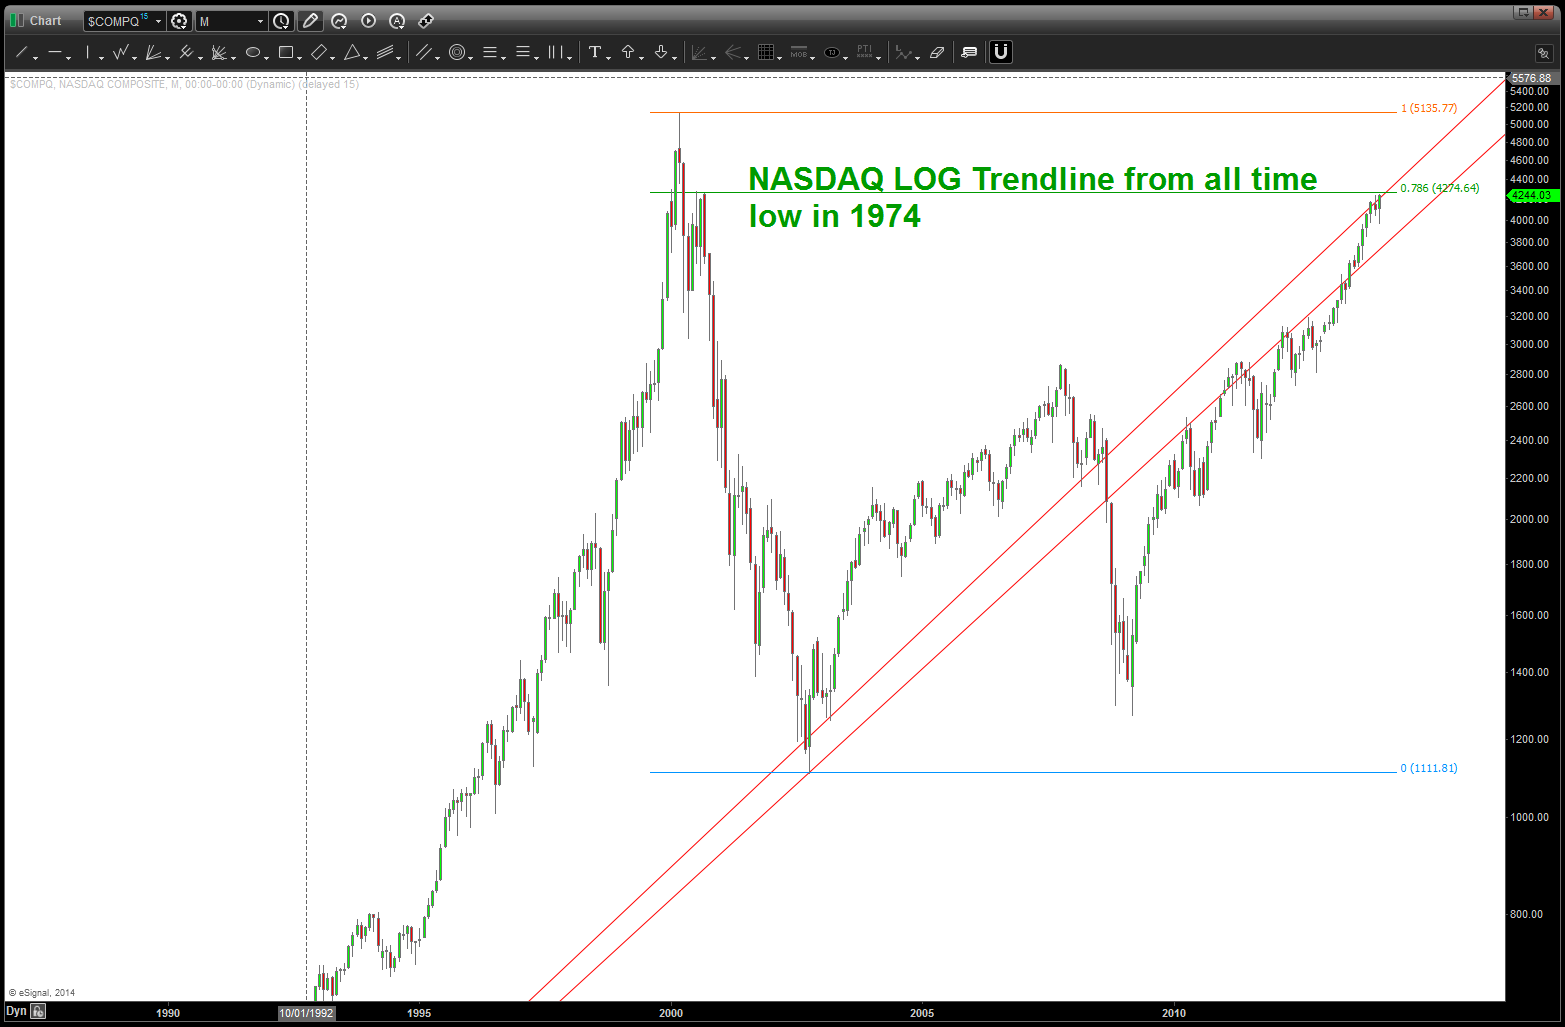
- for the BULLS this is a good sign HOWEVER I’ve enclosed a chart of the DJIA that shows a very strong move UP from the low 9-10 days ago but a VERY significant lack of VOLUME. the VOLUME was BIG going down and SMALL going up (in fact it decreased) hence I find this to be overtly bearish. A very nice 5 waves down can be seen in most of all the indices except the NASDAQ but that is also completing a 1) 5 point reverse wave, 2) 3 drives to a top and 3) all of em’ are smacking into the .786 retracement from 2000. If the US Market starts down again in a “daily C wave” or “continuation 3” we find it hard to believe that the rest of the world won’t also …
- so, we believe this week will be pivotal …
- last, believe it or not, the Dollar is going to be Gorilla that get’s this thing truly rocking and rolling ….one target was hit and held late Friday afternoon.
Here’s a representative example of the VOLUME going UP on the way down and VOLUME going DOWN on the way up …