right click, drag mouse over “clear all drawing tools”, drag mouse over “all charts”, left click. ALL CLEAR
Posted on November 16, 2013 Leave a Comment
the power of a advanced pattern recognition is finding key levels and seeing what the market does around them …while I remain in the BEAR camp, I do recognize some patterns have failed. so, w/ no attachment to the outcome I have deleted all my work on all my charts and will, methodically, go thru each of them w/ a clear mind. My charts now look like below – (read: nothing on them)
$TWTR first sell pattern coming into play
Posted on November 14, 2013 2 Comments

TWTR SELL Pattern Potential
the DNA is the initial impulse move
Posted on November 14, 2013 Leave a Comment
the DNA of any move in a liquid asset is the initial impulse move off of a low or a high. In that, all else will take fold.
below we have a chart of the EURO w/ nothing on it…
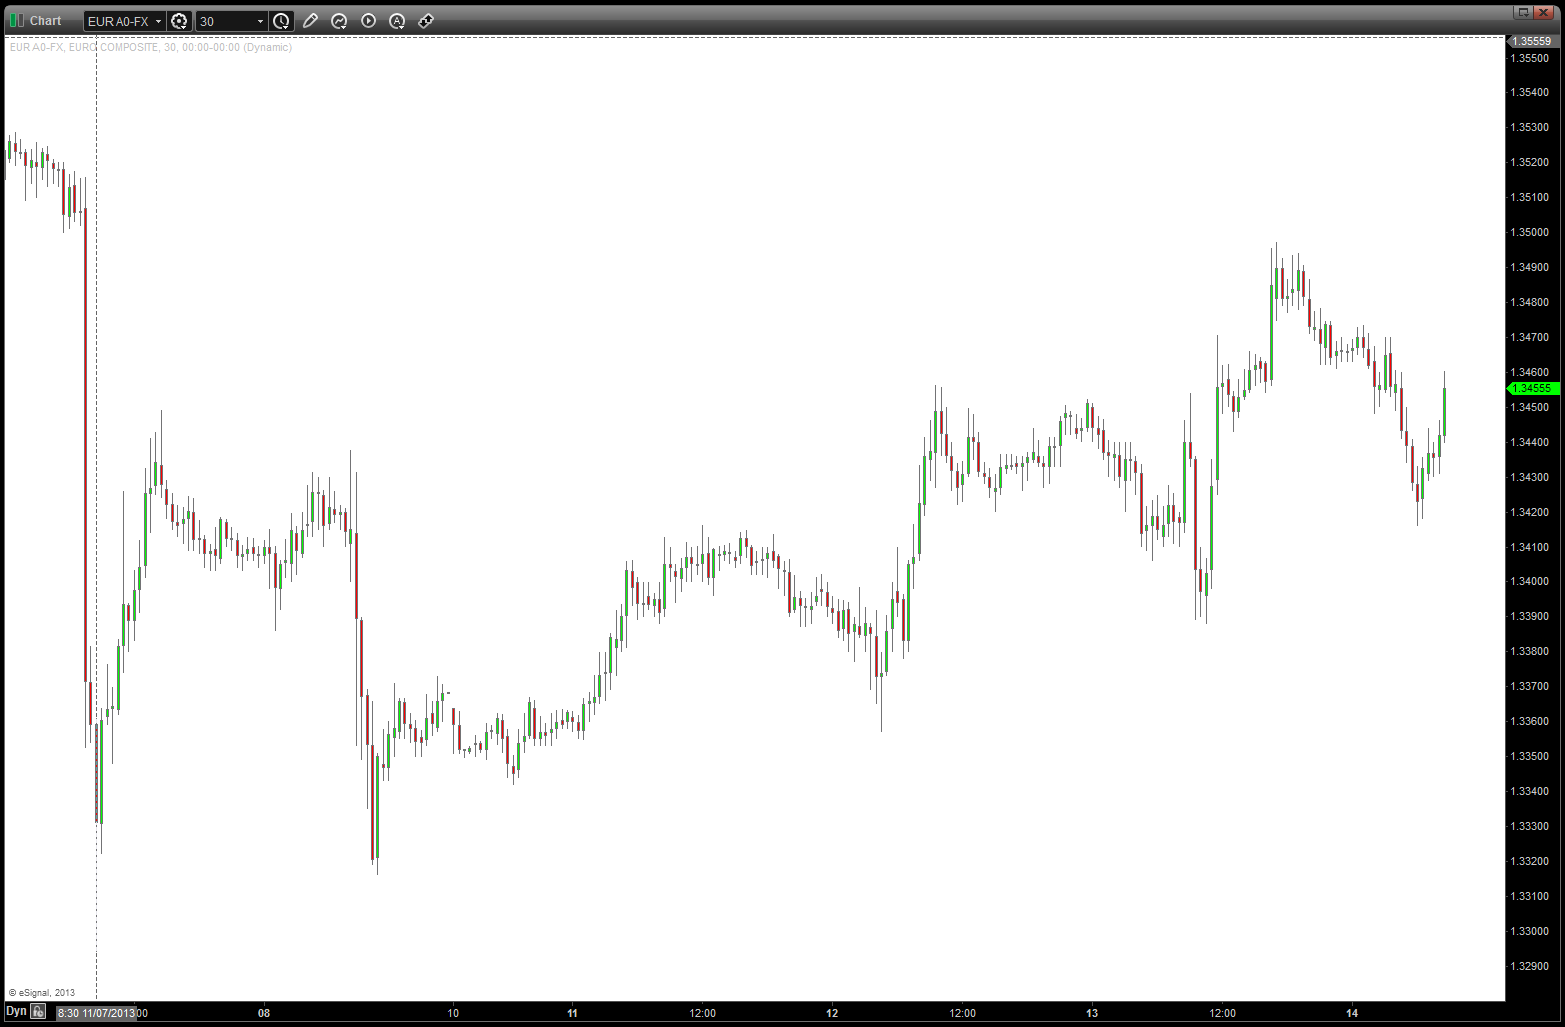
EURO 30 minute chart
here’s the four things we need to do to give birth to ALL of the trend lines on the EURO from the most recent low…
- now, we draw a VECTOR (vectors have both a PRICE and a TIME) off the low into the first high. that is the bold blue arrow and is the DNA
- draw a 45 degree angle UP from that low point. (the famous GANN 1×1) that is the bold purple line
- draw a 90 degree angle from the top of the blue arrow to connect to the purple line. that is the light blue line …
- draw a 26 1/4 degree line up from the low and, note, it intersects the square exactly in the middle. That is the red line ..(the famous GANN 2×1)
- now simply copy/paste these lines into the future to give rise to all future turns …
is it possible to trade every hit of these lines? I would submit “no” but perhaps someone out there or some computer program can … for me, they are simply a very powerful roadmap to follow. I’ll look for a pattern and I have, in my head, “gates” or “intersections” to follow …
our “short zone” worked and we have had a very feeble 5 day rally … 1.3500 could have done it but I still “feel” a little higher might be in the cards.
hope you enjoyed
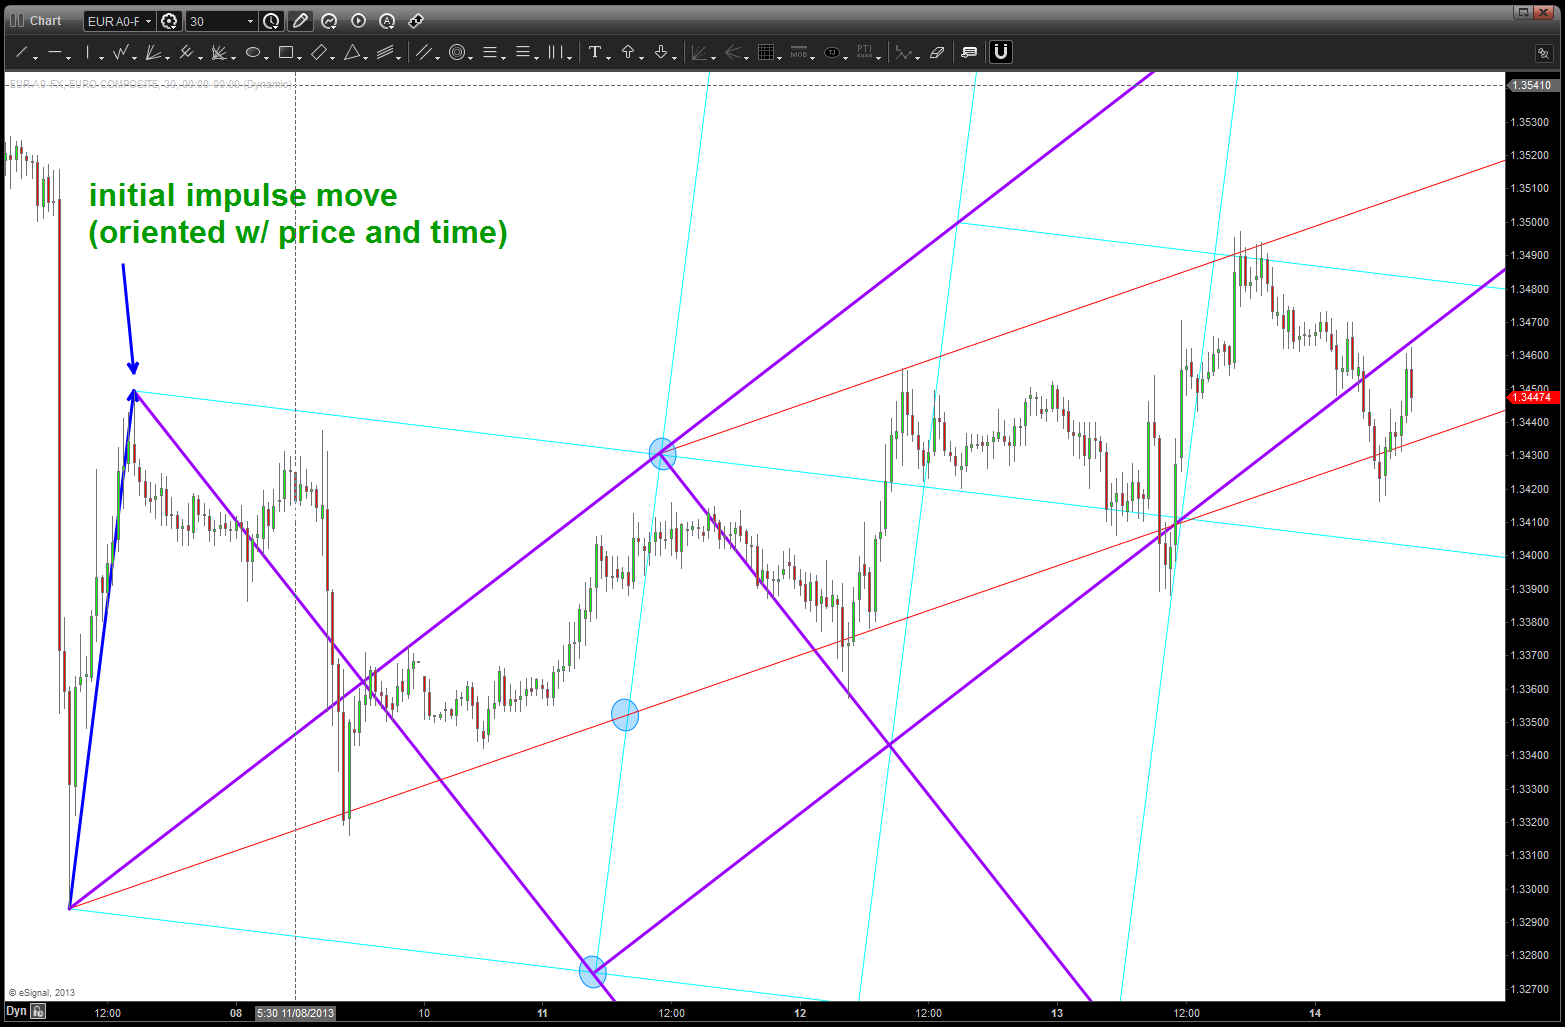
EURO angles
relative strength of GOLD vs the USDJPY importance
Posted on November 13, 2013 5 Comments
a line in the sand was drawn at 75 in the USD vs JPY when the BOJ, after the horrible tsunami, said – enough is enough this is where the buck stops! the rest is history and a big KABOOM occurred. everyone and the brother can see the coiling occurring w/in this very important currency pair and, quite frankly, everyone and their brother is EXPECTING it to resolve to the upside. here is the case for that ..
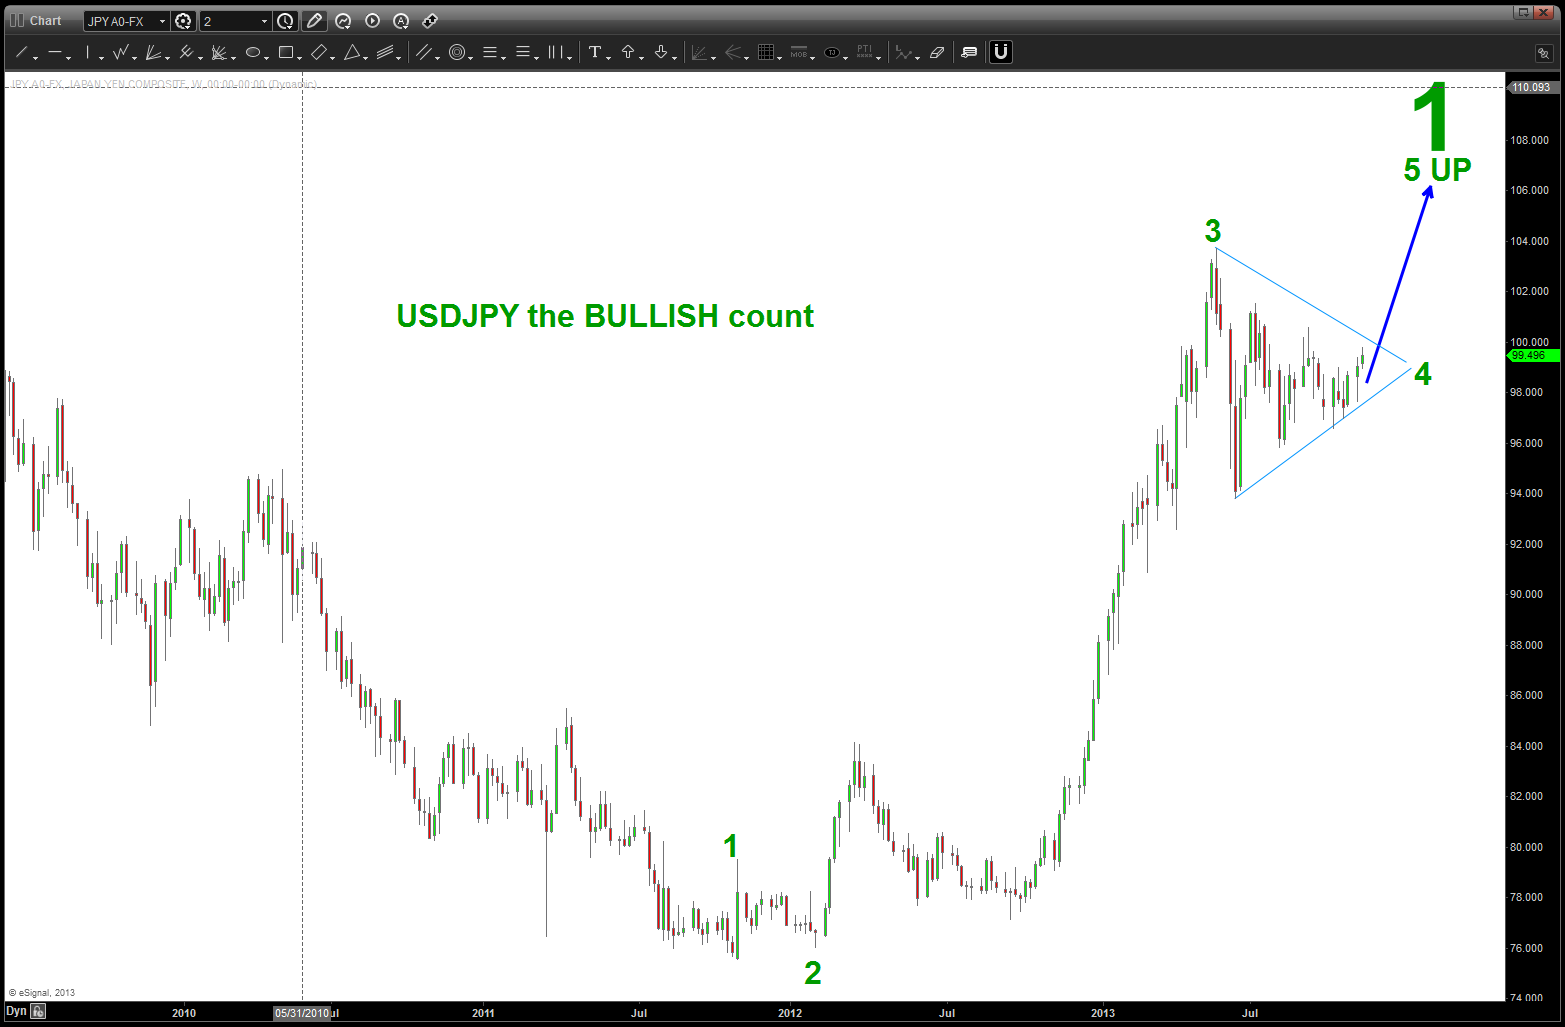
BULLISH POTENTIAL
now, here is where it gets interesting … is there any possibility of this moving DOWN? A couple weeks ago, I didn’t think so and here’s the post:
https://bartscharts.com/2013/10/10/japanese-yen-advance/
if you look at that post, we nailed the low and the pair has moved up from the levels indicated.
now it gets interesting, a lot of BEARISH PATTERNS have been completing on the equities side of the house and IF this is marking an important top/pause in the run from 2009, THEN the Nikkei 225 shouldn’t keep going straight up – one would think. So, being very focused on the FX markets I decided to look at the JPY vs a lot of the pairs from around the world
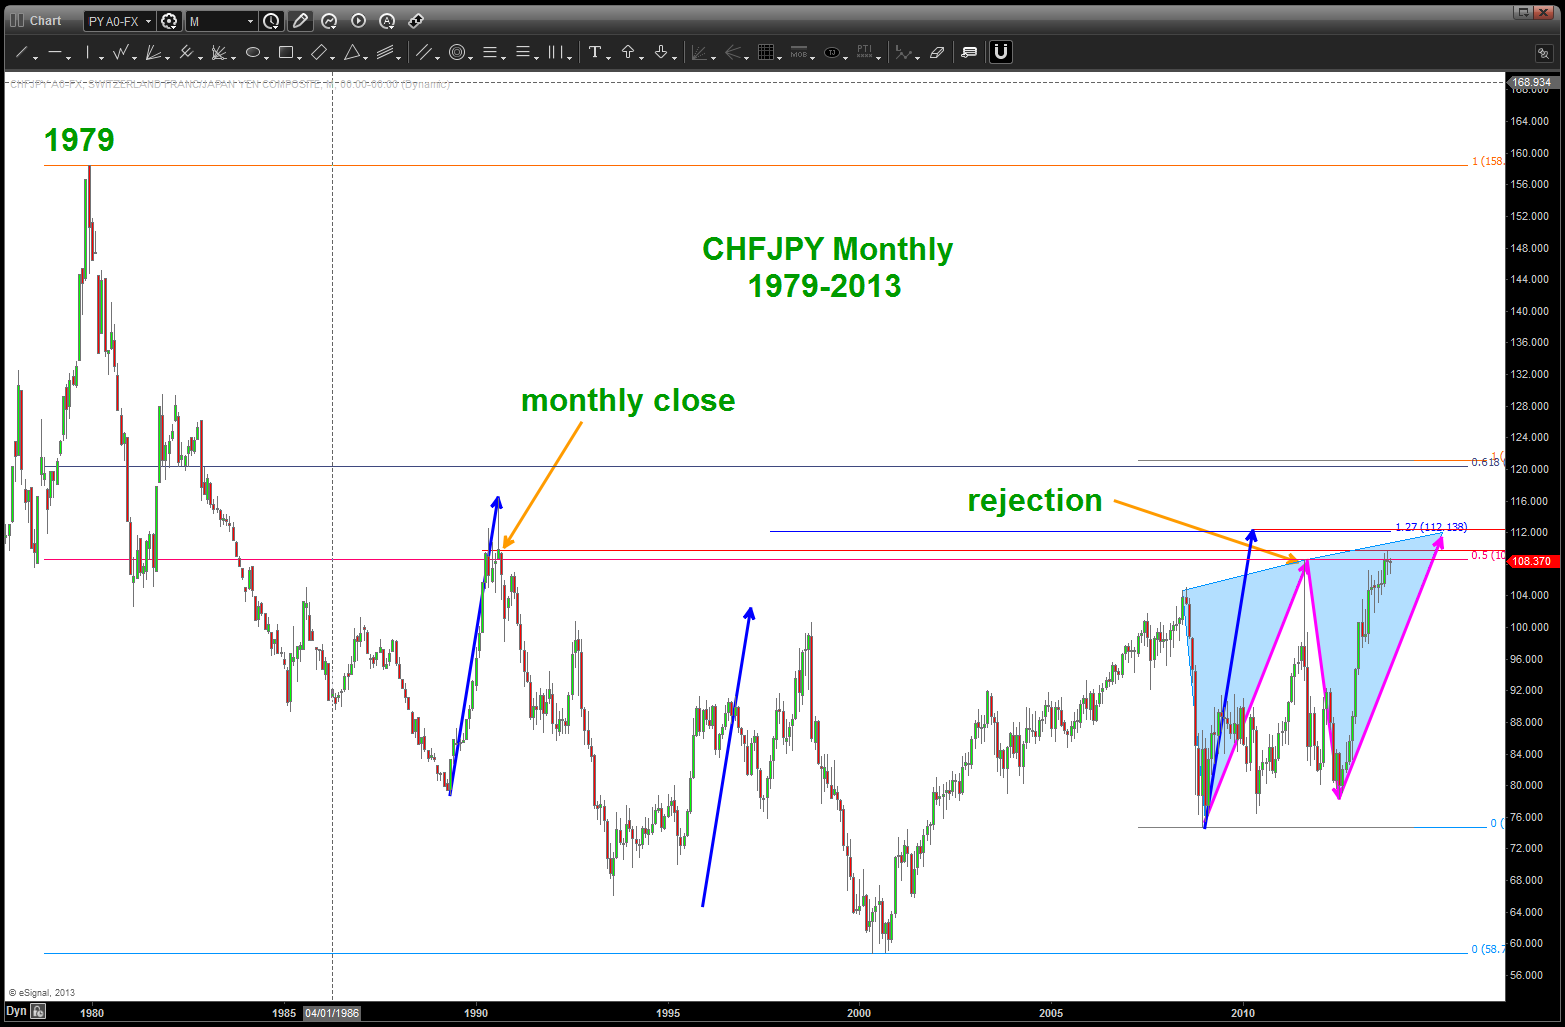
 CHFJPY: stopping exactly where it got smashed a couple years ago and in 1999. (JPY strength) / this is the most fascinating chart IMHO.
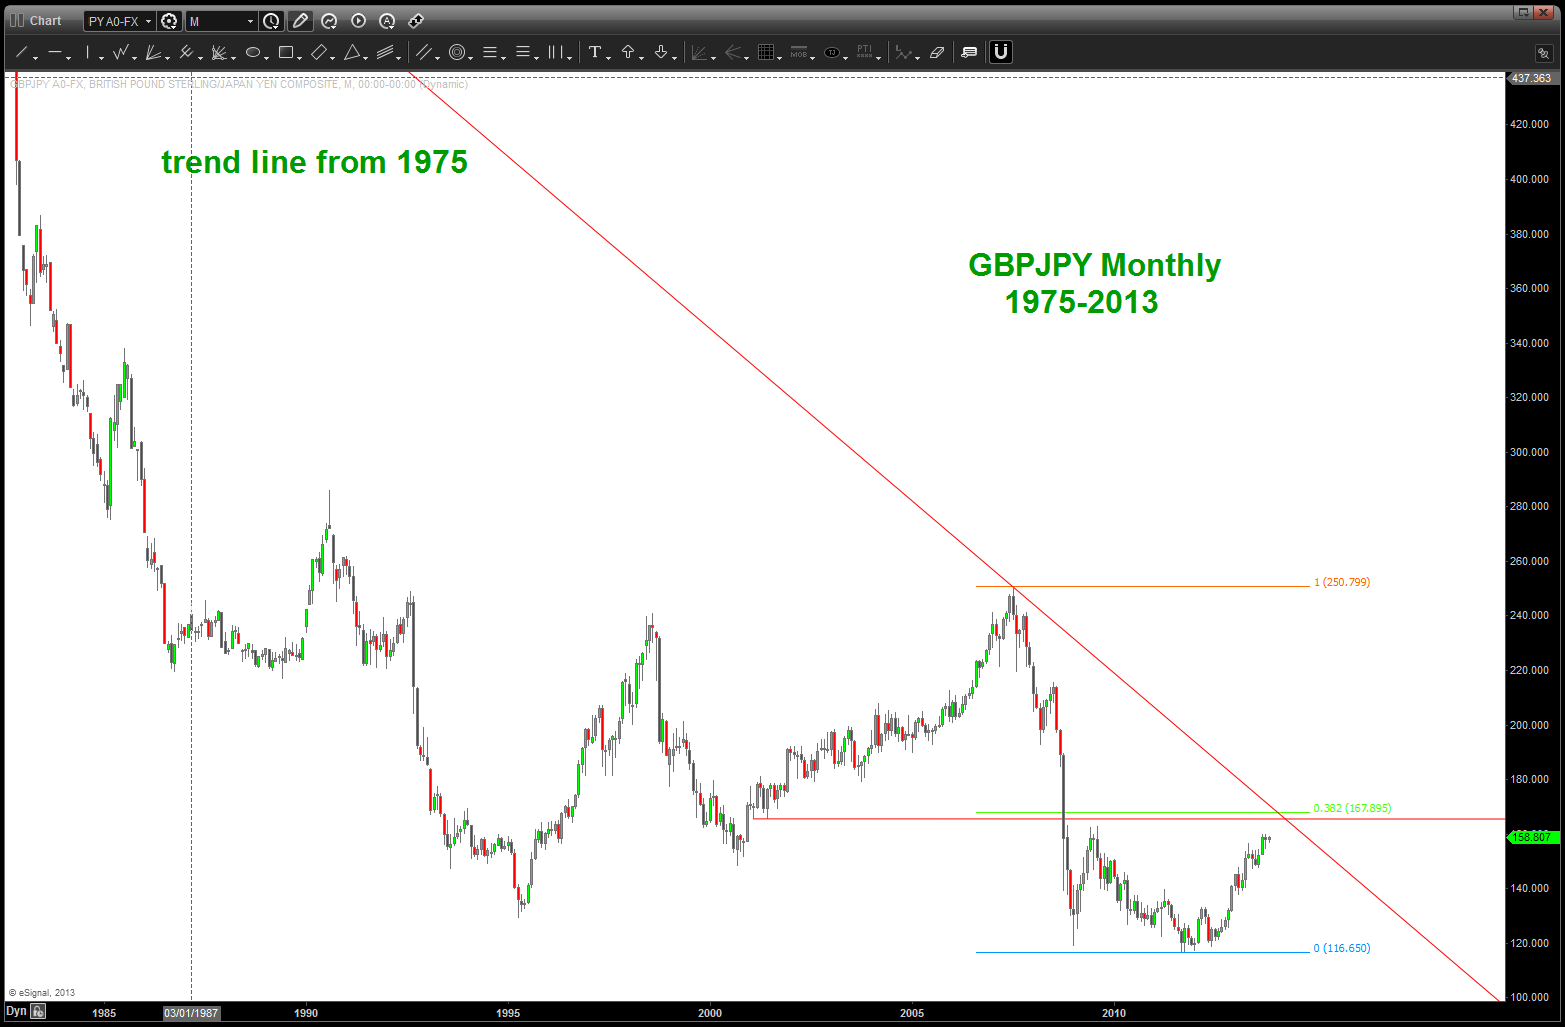
GBPJPY: little higher and then major resistance. (JPY strength)
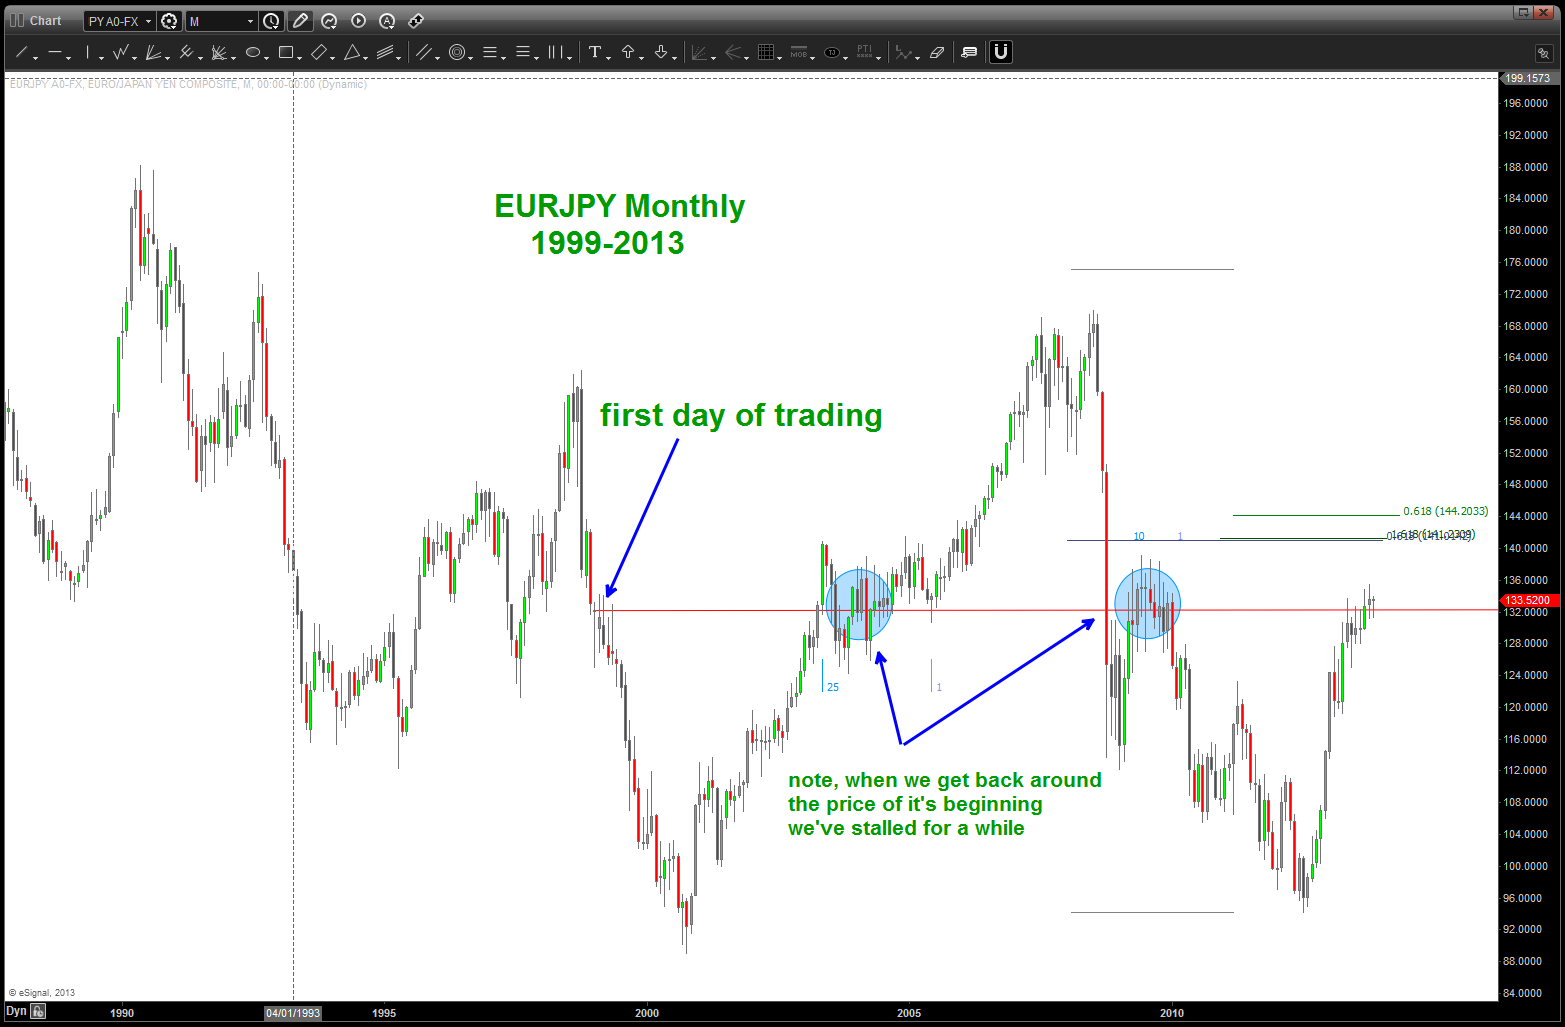
EURJPY: tough call, but higher and we have major resistance (EUR strength? Seriously? perhaps if the EURO smashes down, the JPY will strengthen?)
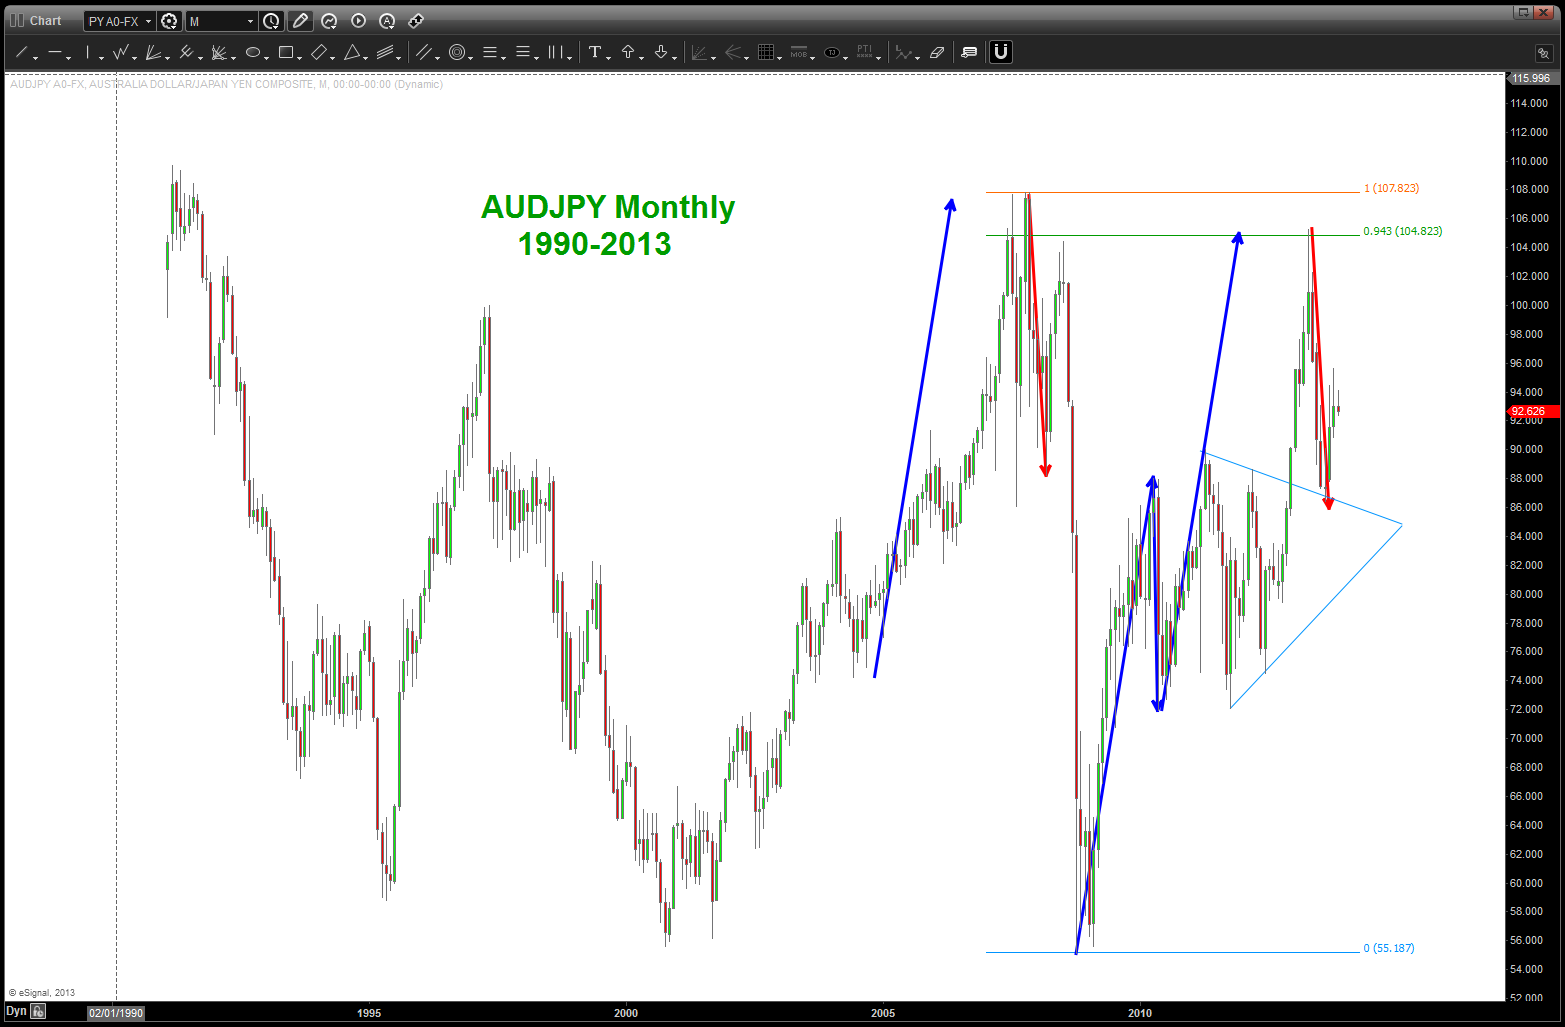
AUDJPY: major sell signal HIT and AUD is weak against the JPY (JPY strength)
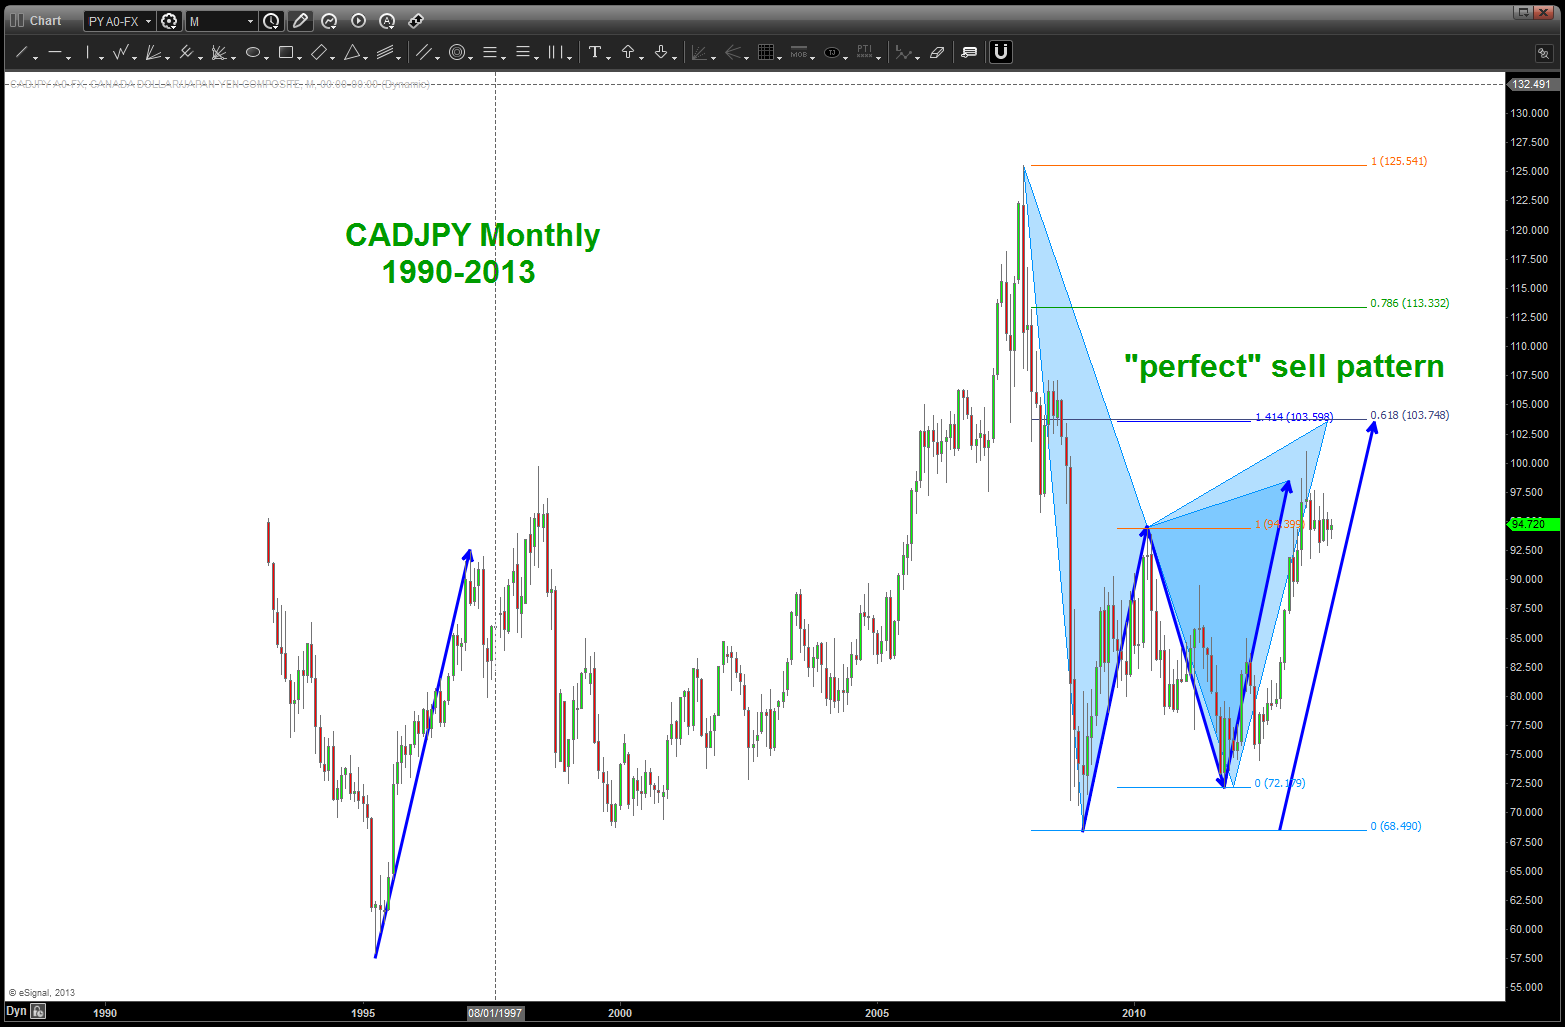
CADJPY: major sell pattern HIT and if it holds we’ll get a move low. Another target is higher also..( but JPY strength)
These 5 pairs do not show the coil and they are showing some JPY strength afoot? (Cue Wayne’s World – “something is afoot at the circle K”
What to do … well, let’s go back to our ratio’s. in this case let’s do a ratio analysis of SPOT GOLD / USD vs JPY. Well, look at that …
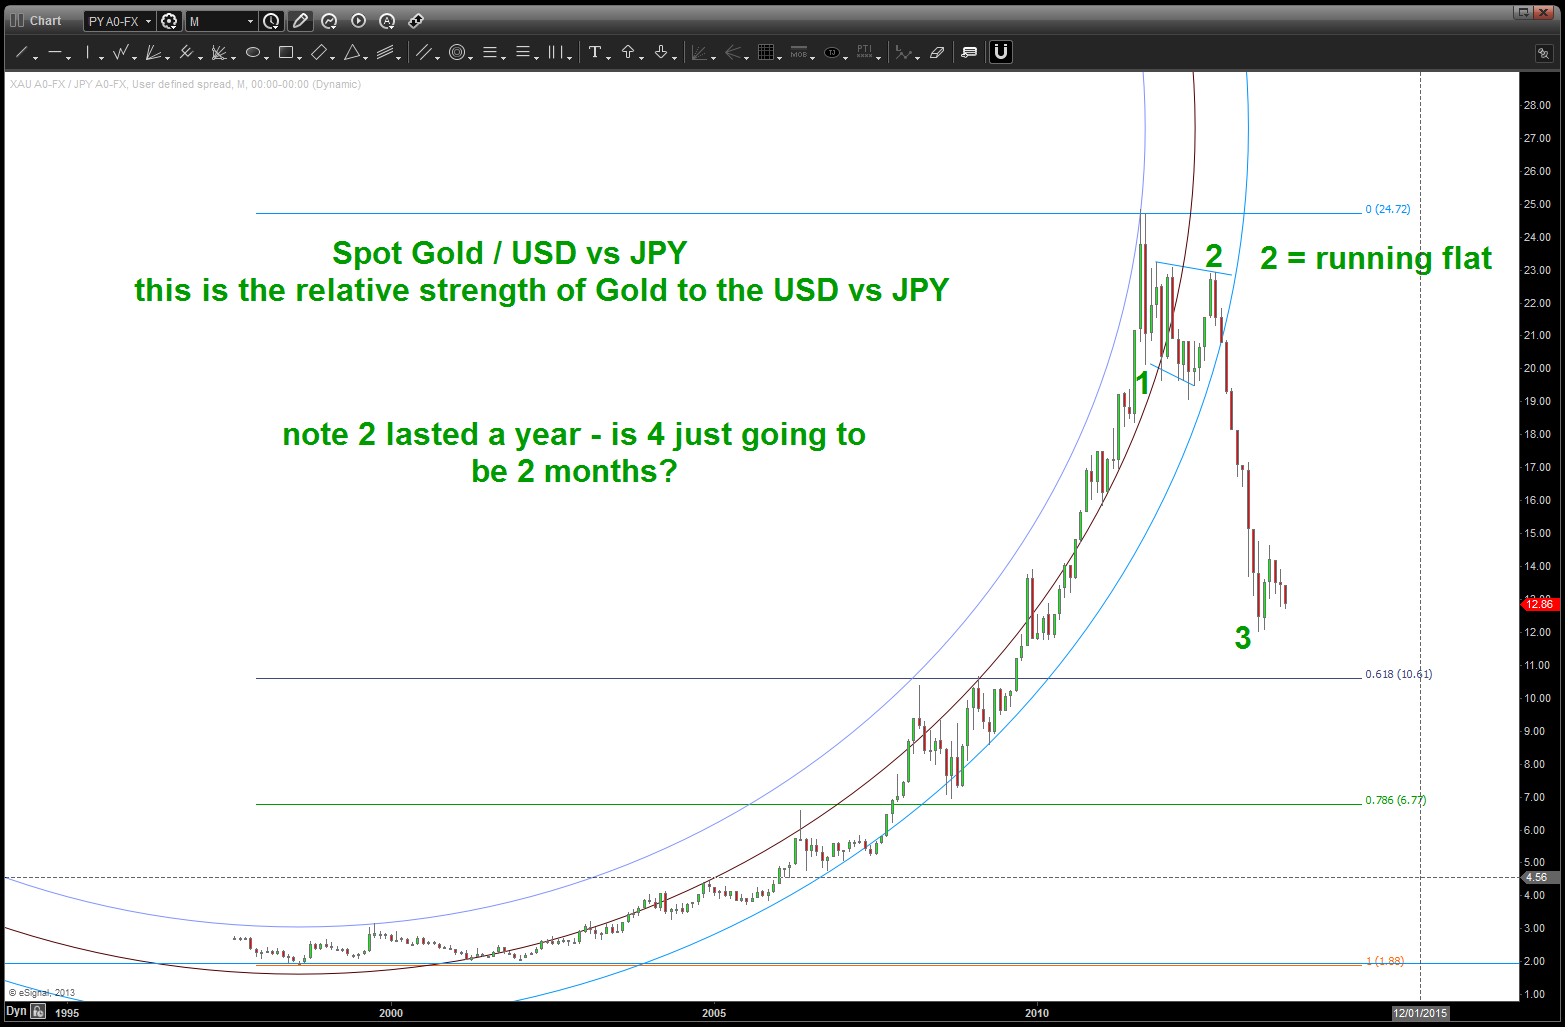
Relative Strength of Spot Gold vs USDJPY
another parabolic run that is ending badly … but here’s what REALLY makes me go “hmmmm.” It’s not a stretch to say we are in a very powerful wave 3 down right now in this relative strength chart … but notice how long the wave 2 took to correct! A pretty long time before things got interesting. one of the things we are taught in the CMT is form/proportion and balance. I would just think that wave 4 would take a little more TIME. So what do we do – go to a time frame lower:
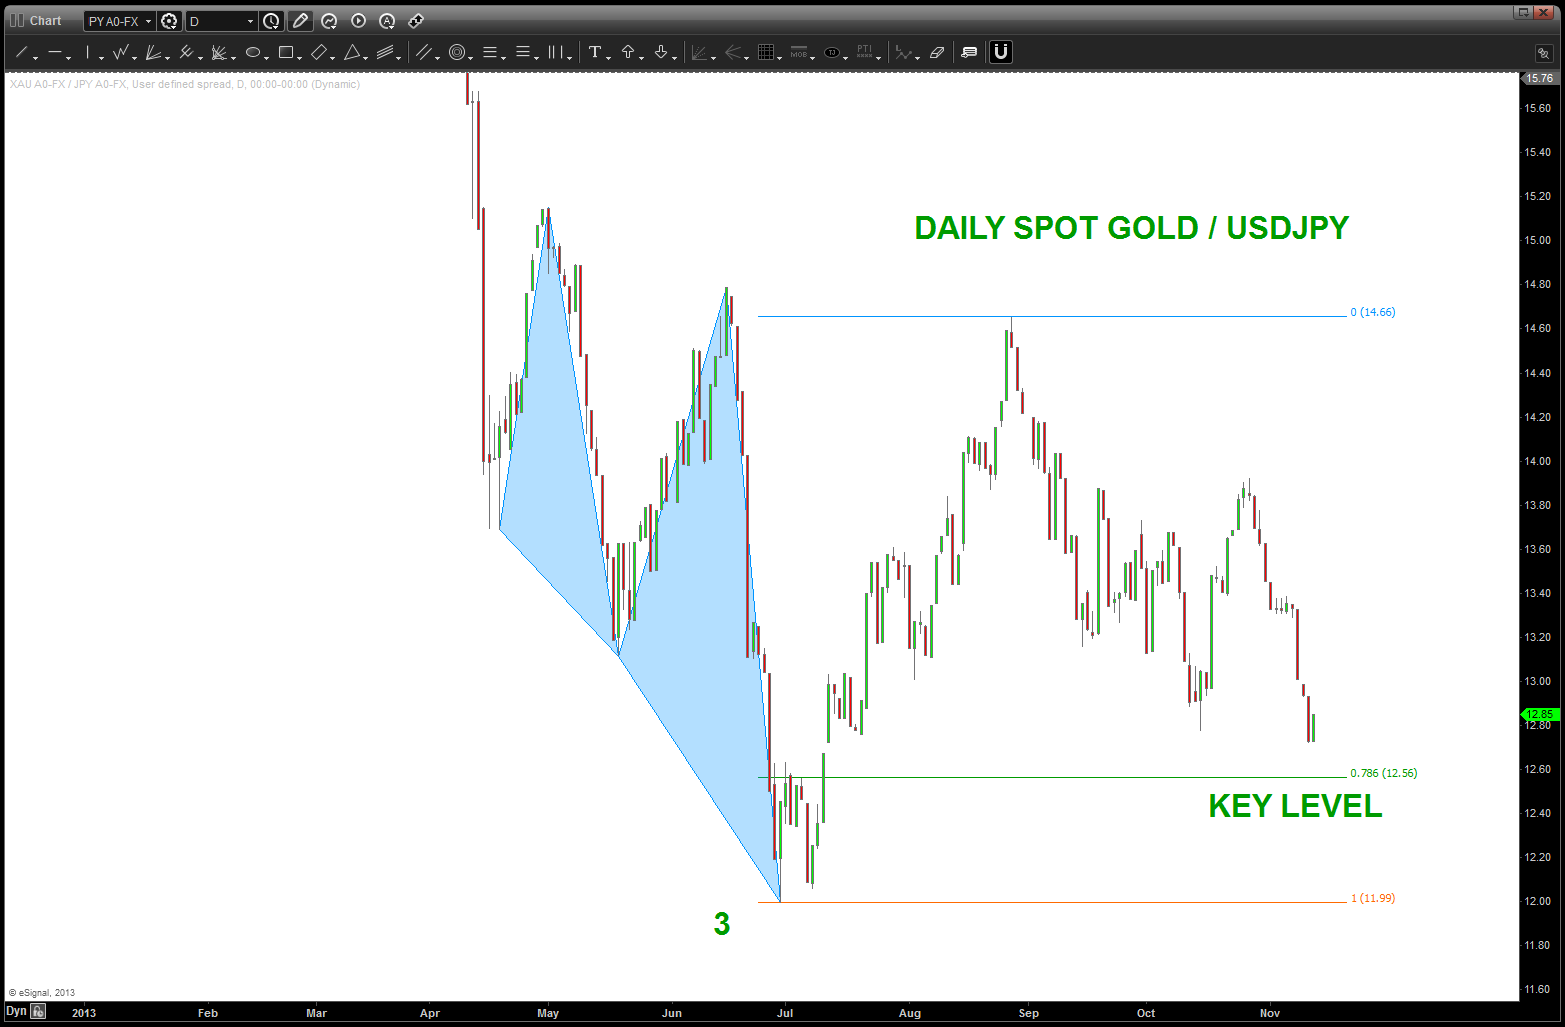
spot gold vs USDJPY relative strength
so, if we can get to the lower level at 12.56 on the ratio we’ll get a good a idea of where we are…my thesis is that if 1) this level holds and bounces it will cause the YEN to strengthen and if we lose this level to the downside it will cause the YEN to weaken and the triangle of USDJPY will resolve UP. Here’s why this is so important:
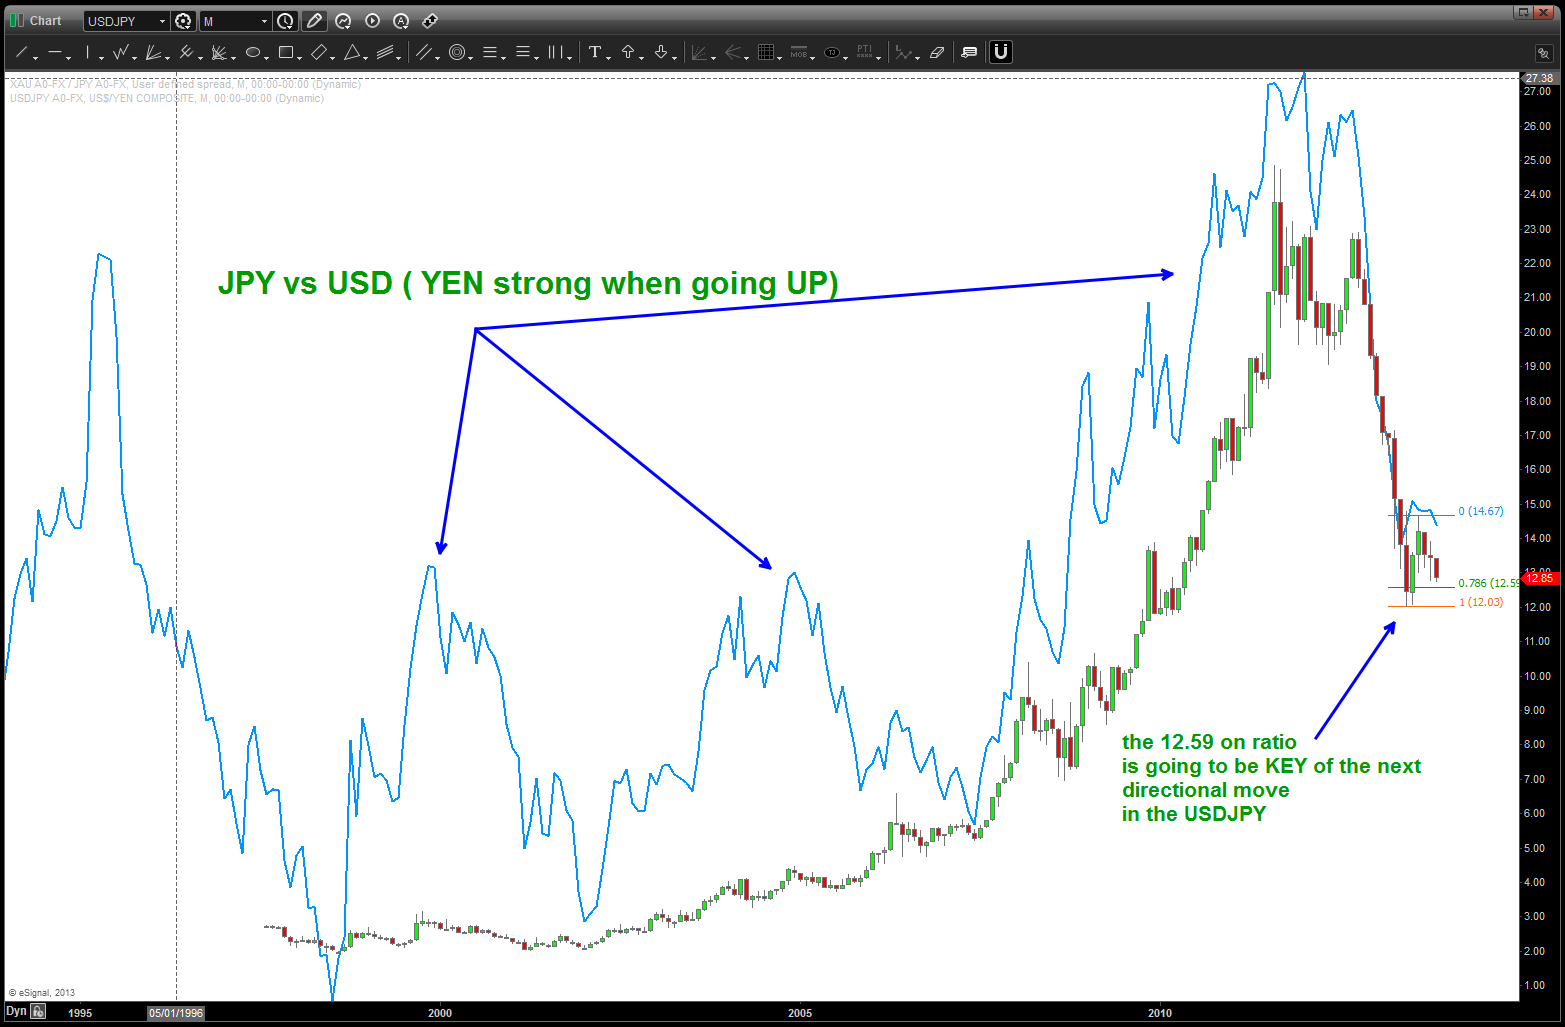 the line is the JPY vs USD. the JPY is “strong” when the blue line is going up and it’s weak when the blue line is going down. note the TIMING of the inflection points in the ratio.
SUMMARY: yes, we are at a critical level in the USDJPY contraction …if we keep any eye on the Ratio of SPOT GOLD / USDJPY we might be able to get a “peak” at the directional movement of the coil …
Last, here’s the BEAR count of the USDJPY:
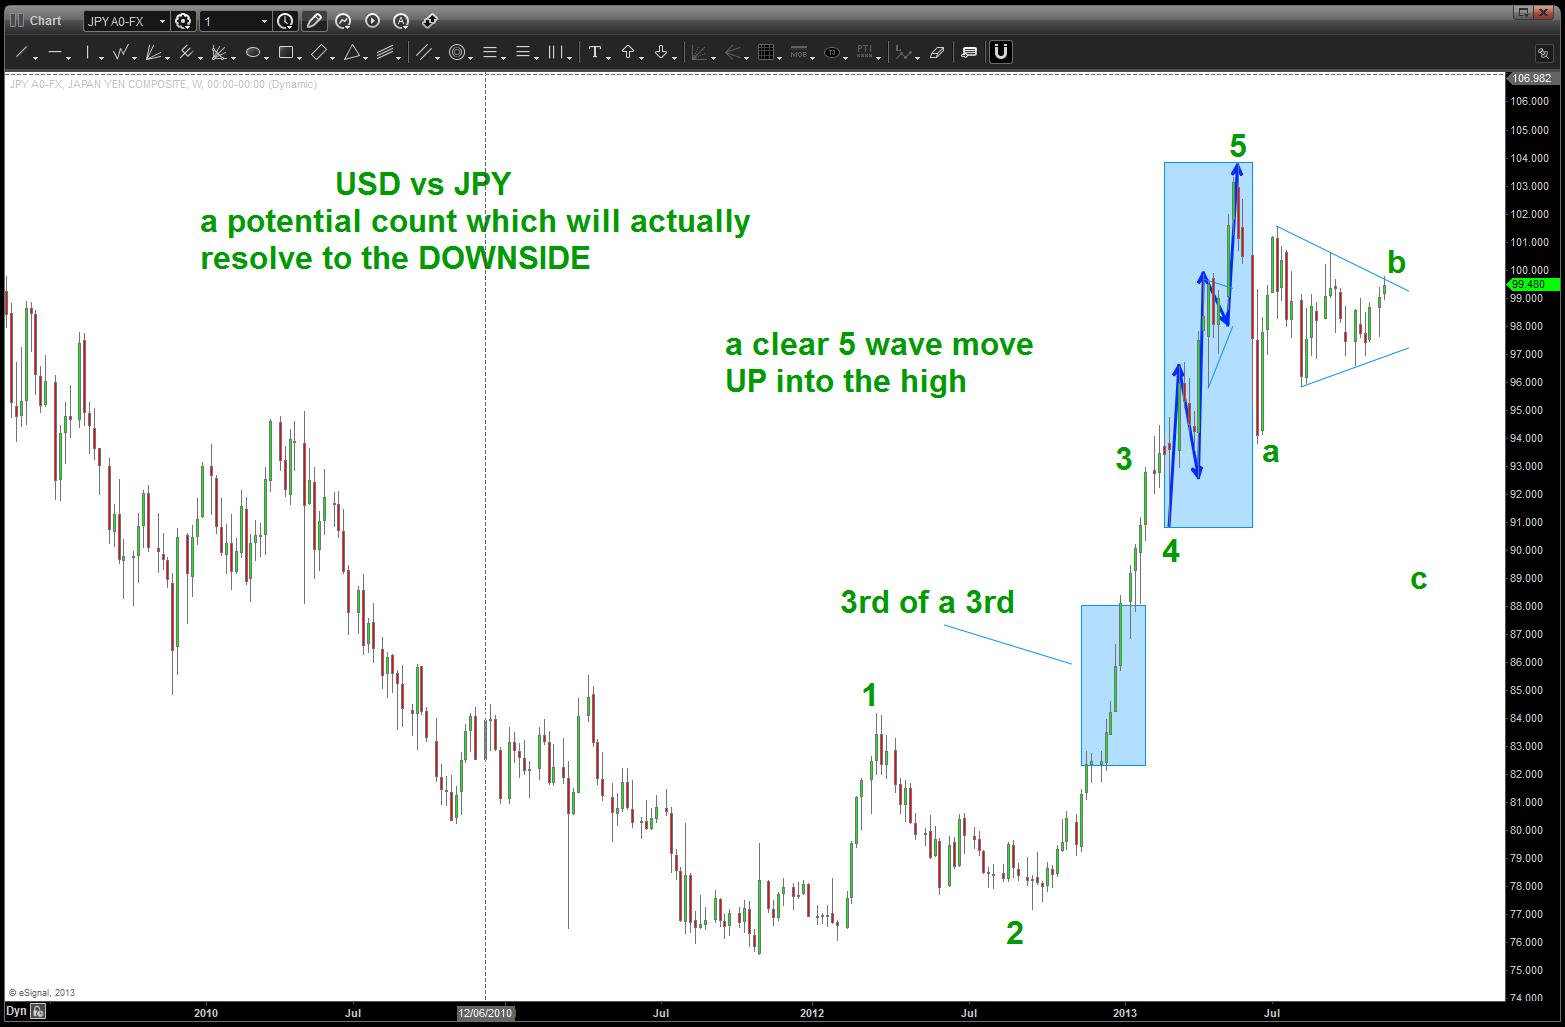
a bearish interpretation ….perhaps?
the issue here is the 4th wave .. with such a powerful move i would expect more consolidation. But look at the wave labeled 1 – the 4th in that move was a quick “bump in the road” and the 4th before the top at 104 is kind of a mirror image. perhaps forcing it, but is something to consider.
the last thing to consider is the CLEAR 5 WAVE MOVEMENT INTO the 104 zone. 1,2,3 triangle 4, 5 … quite frankly, why isn’t this count a possibility? especially if our ratio finds support and goes up some more to relieve the beating it has taken ..
just saying ….stay tuned.
EURO correction complete, shall we resume lower?
Posted on November 12, 2013 Leave a Comment
MACRO SUMMARY: the correction on the EURO from 07/2012 is showing signs of being complete. Additionally, if you have been following our dollar index posts, you’ll see that the next advance of the US Dollar “should” be getting underway. Since the EURO is a major component of the US Dollar index we need to look at it to work a “first opportunity” to get short on a nice pullback.
TRADING SUMMARY: we are at or nearing completion of a final corrective leg that will target 1.3167 for a potential first support zone for this next leg down. near term, favor support to be found on an intra-day basis around 1.3410’ish and one final move up into the 1.3460-1.3520 area to SELL and signal a start of the next wave down. consider this analysis incorrect if we get an hourly close, with thrust, above 1.3550.
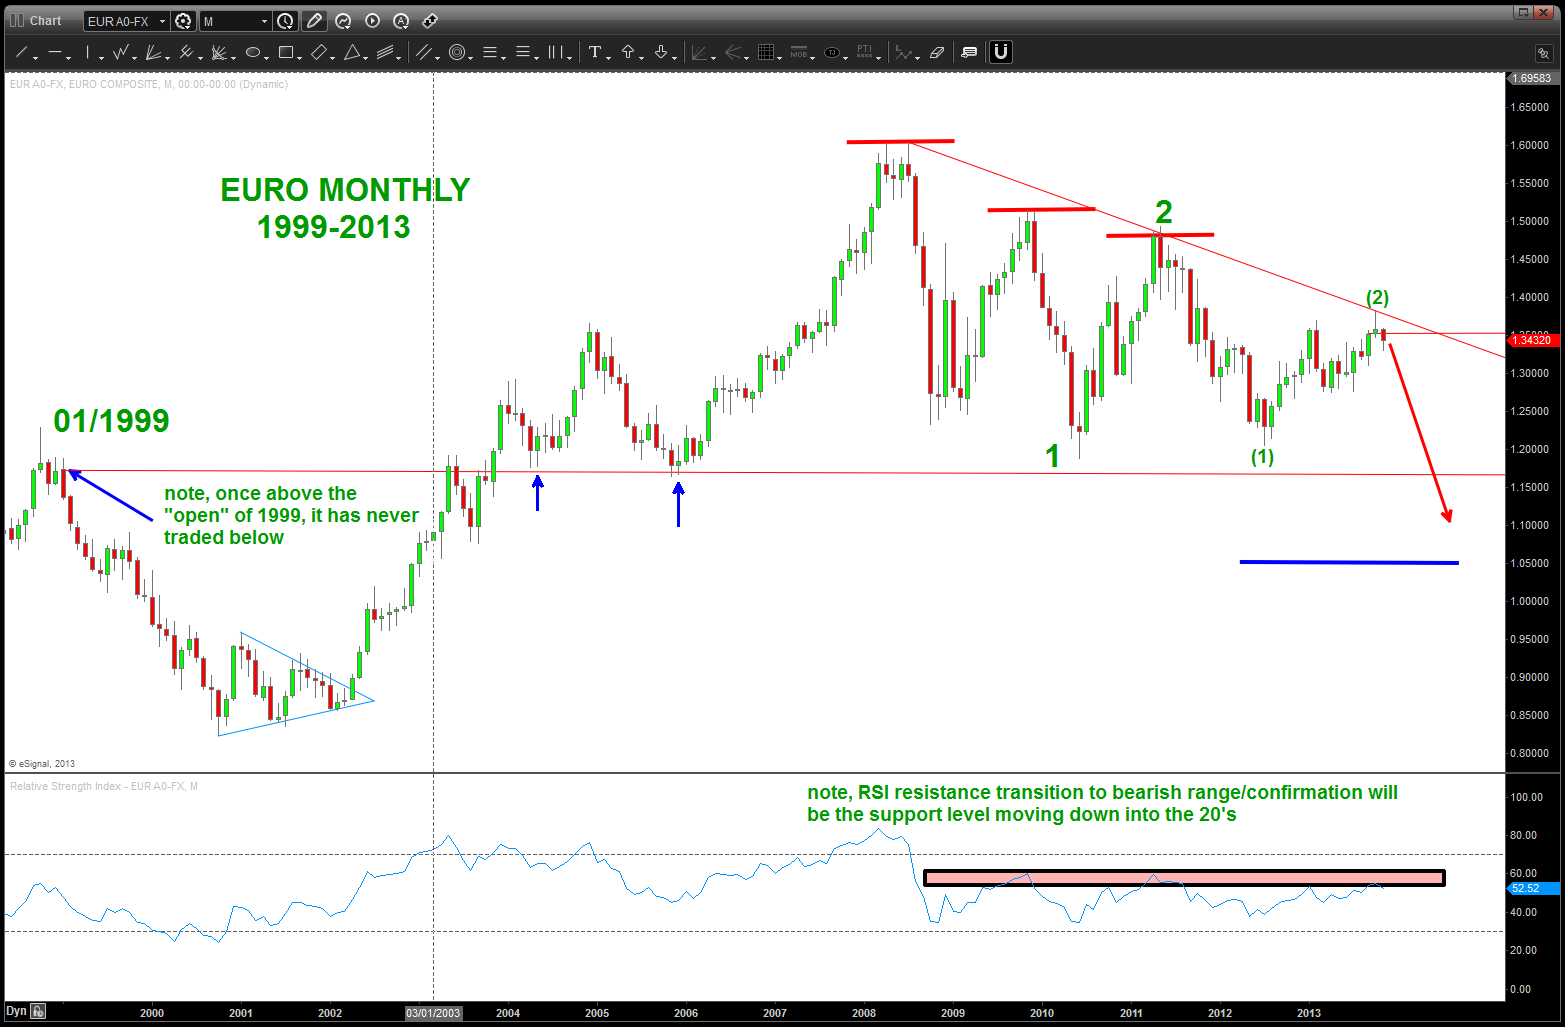
EURO vs USD Monthly
- note, once the high was in during 2007 that on the pullback’s the RSI resistance band had “shifted” to the bear market range.
- note, that the opening price in 01/1999 (once regained) has been a line in the sand, so to speak that the EURO has never been back below since regaining in 2003. that level is approximately: 1.17
- the count, even on this monthly has been tough. right now I am favoring that wave (2) of 3 just completed and we are in the very beginning stages of the swift, powerful (3) of 3.
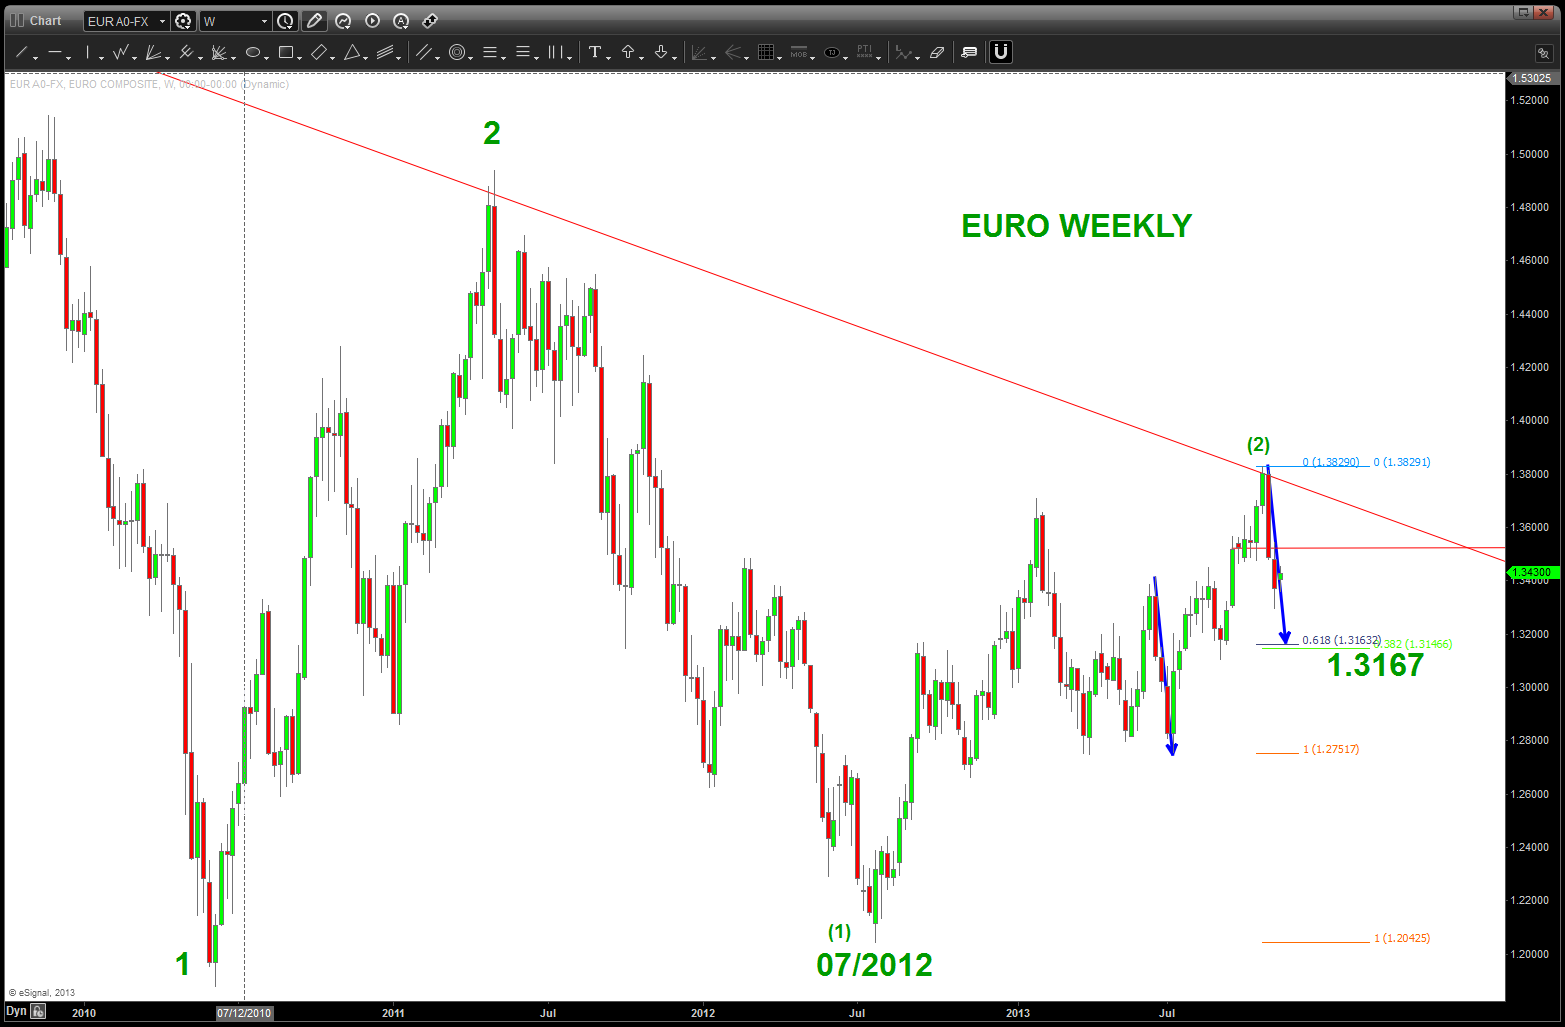
EURO WEEKLY
- blue arrows showing max corrective move since 07/2013 w/ nice confluence level, am expecting that to be first bounce area
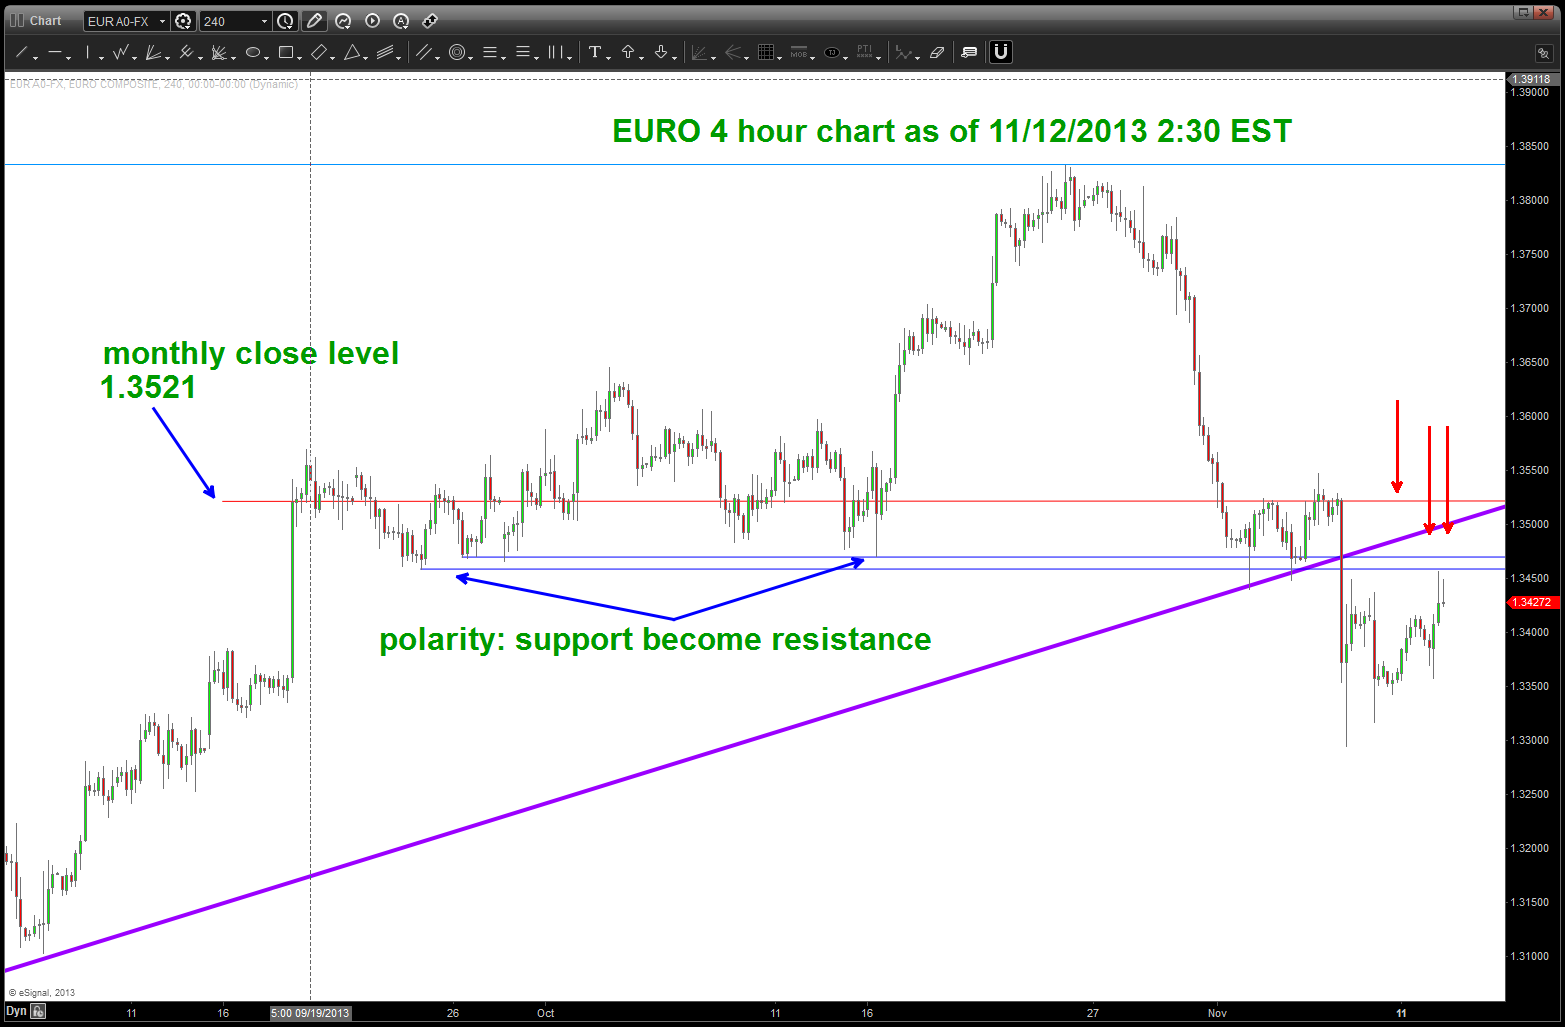
EURO 4 hour
- note the “slice thru” strongly of roughly 3 weeks of support at/around the 1.3460-1.3470, that “should” now act as resistance
- just as important is our red line showing the monthly close level of 1.3521 that held and had the market bouncing around for a while, that should also offer continued resistance.
- last, the purple trend line is the channel trend line that had it’s origin w/ the 07/2013 low. that should also be formidable resistance
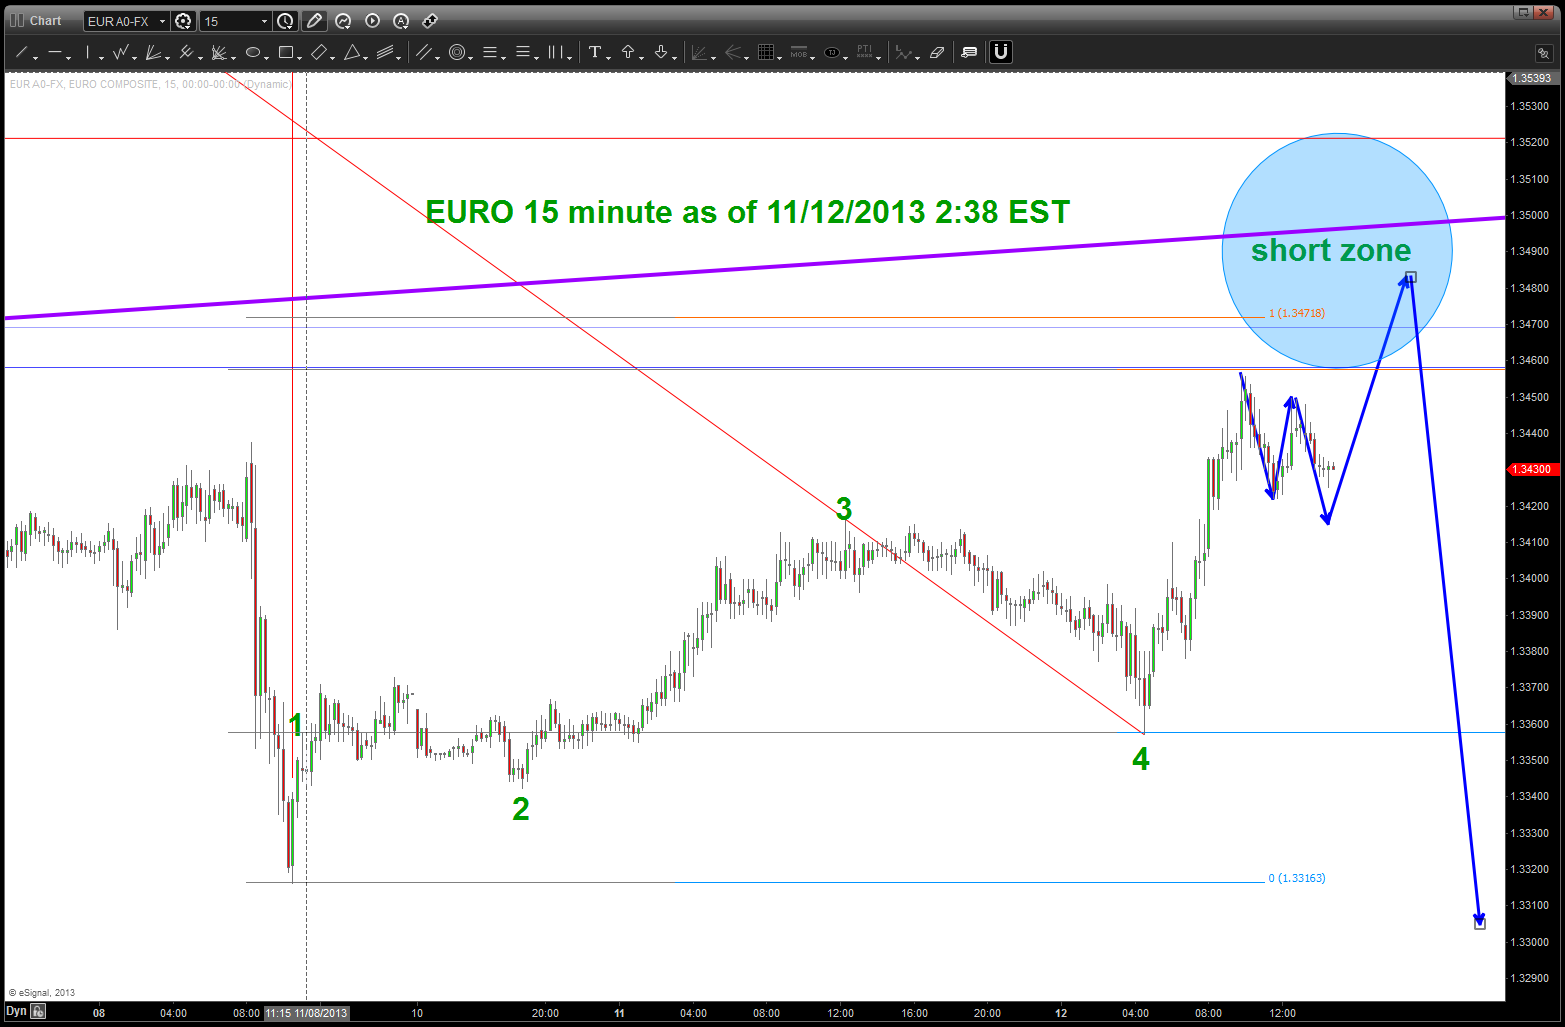
EURO 15 minute intra-day
- final leg of a 1,2,3,4,5 C wave in progress .. favor one more push into the BLUE ELLIPSE for a SHORT zone to resume bearish posture. Unfortunately, right now, that entire zone has all kinds of targets …looking for 1.3410 to signal a minor correction complete for one more advance.
questions to me – Bart
having fun w/ 1776 and the confessions of a QE Junky
Posted on November 12, 2013 Leave a Comment
I love Business Development in any industry and any product or service …it’s actually extremely strategic and w/ a well focused and actionable set of benchmarks or criteria can usually guarantee success. This AM I have been working on a proposal for a company to make a major LOB move into a new arena. After spending some brains cells and finger strength typing I took a break for lunch …
While eating my cold spaghetti (I never heat up the next day spaghetti) there in front of me was the following news (breaking OBTW):
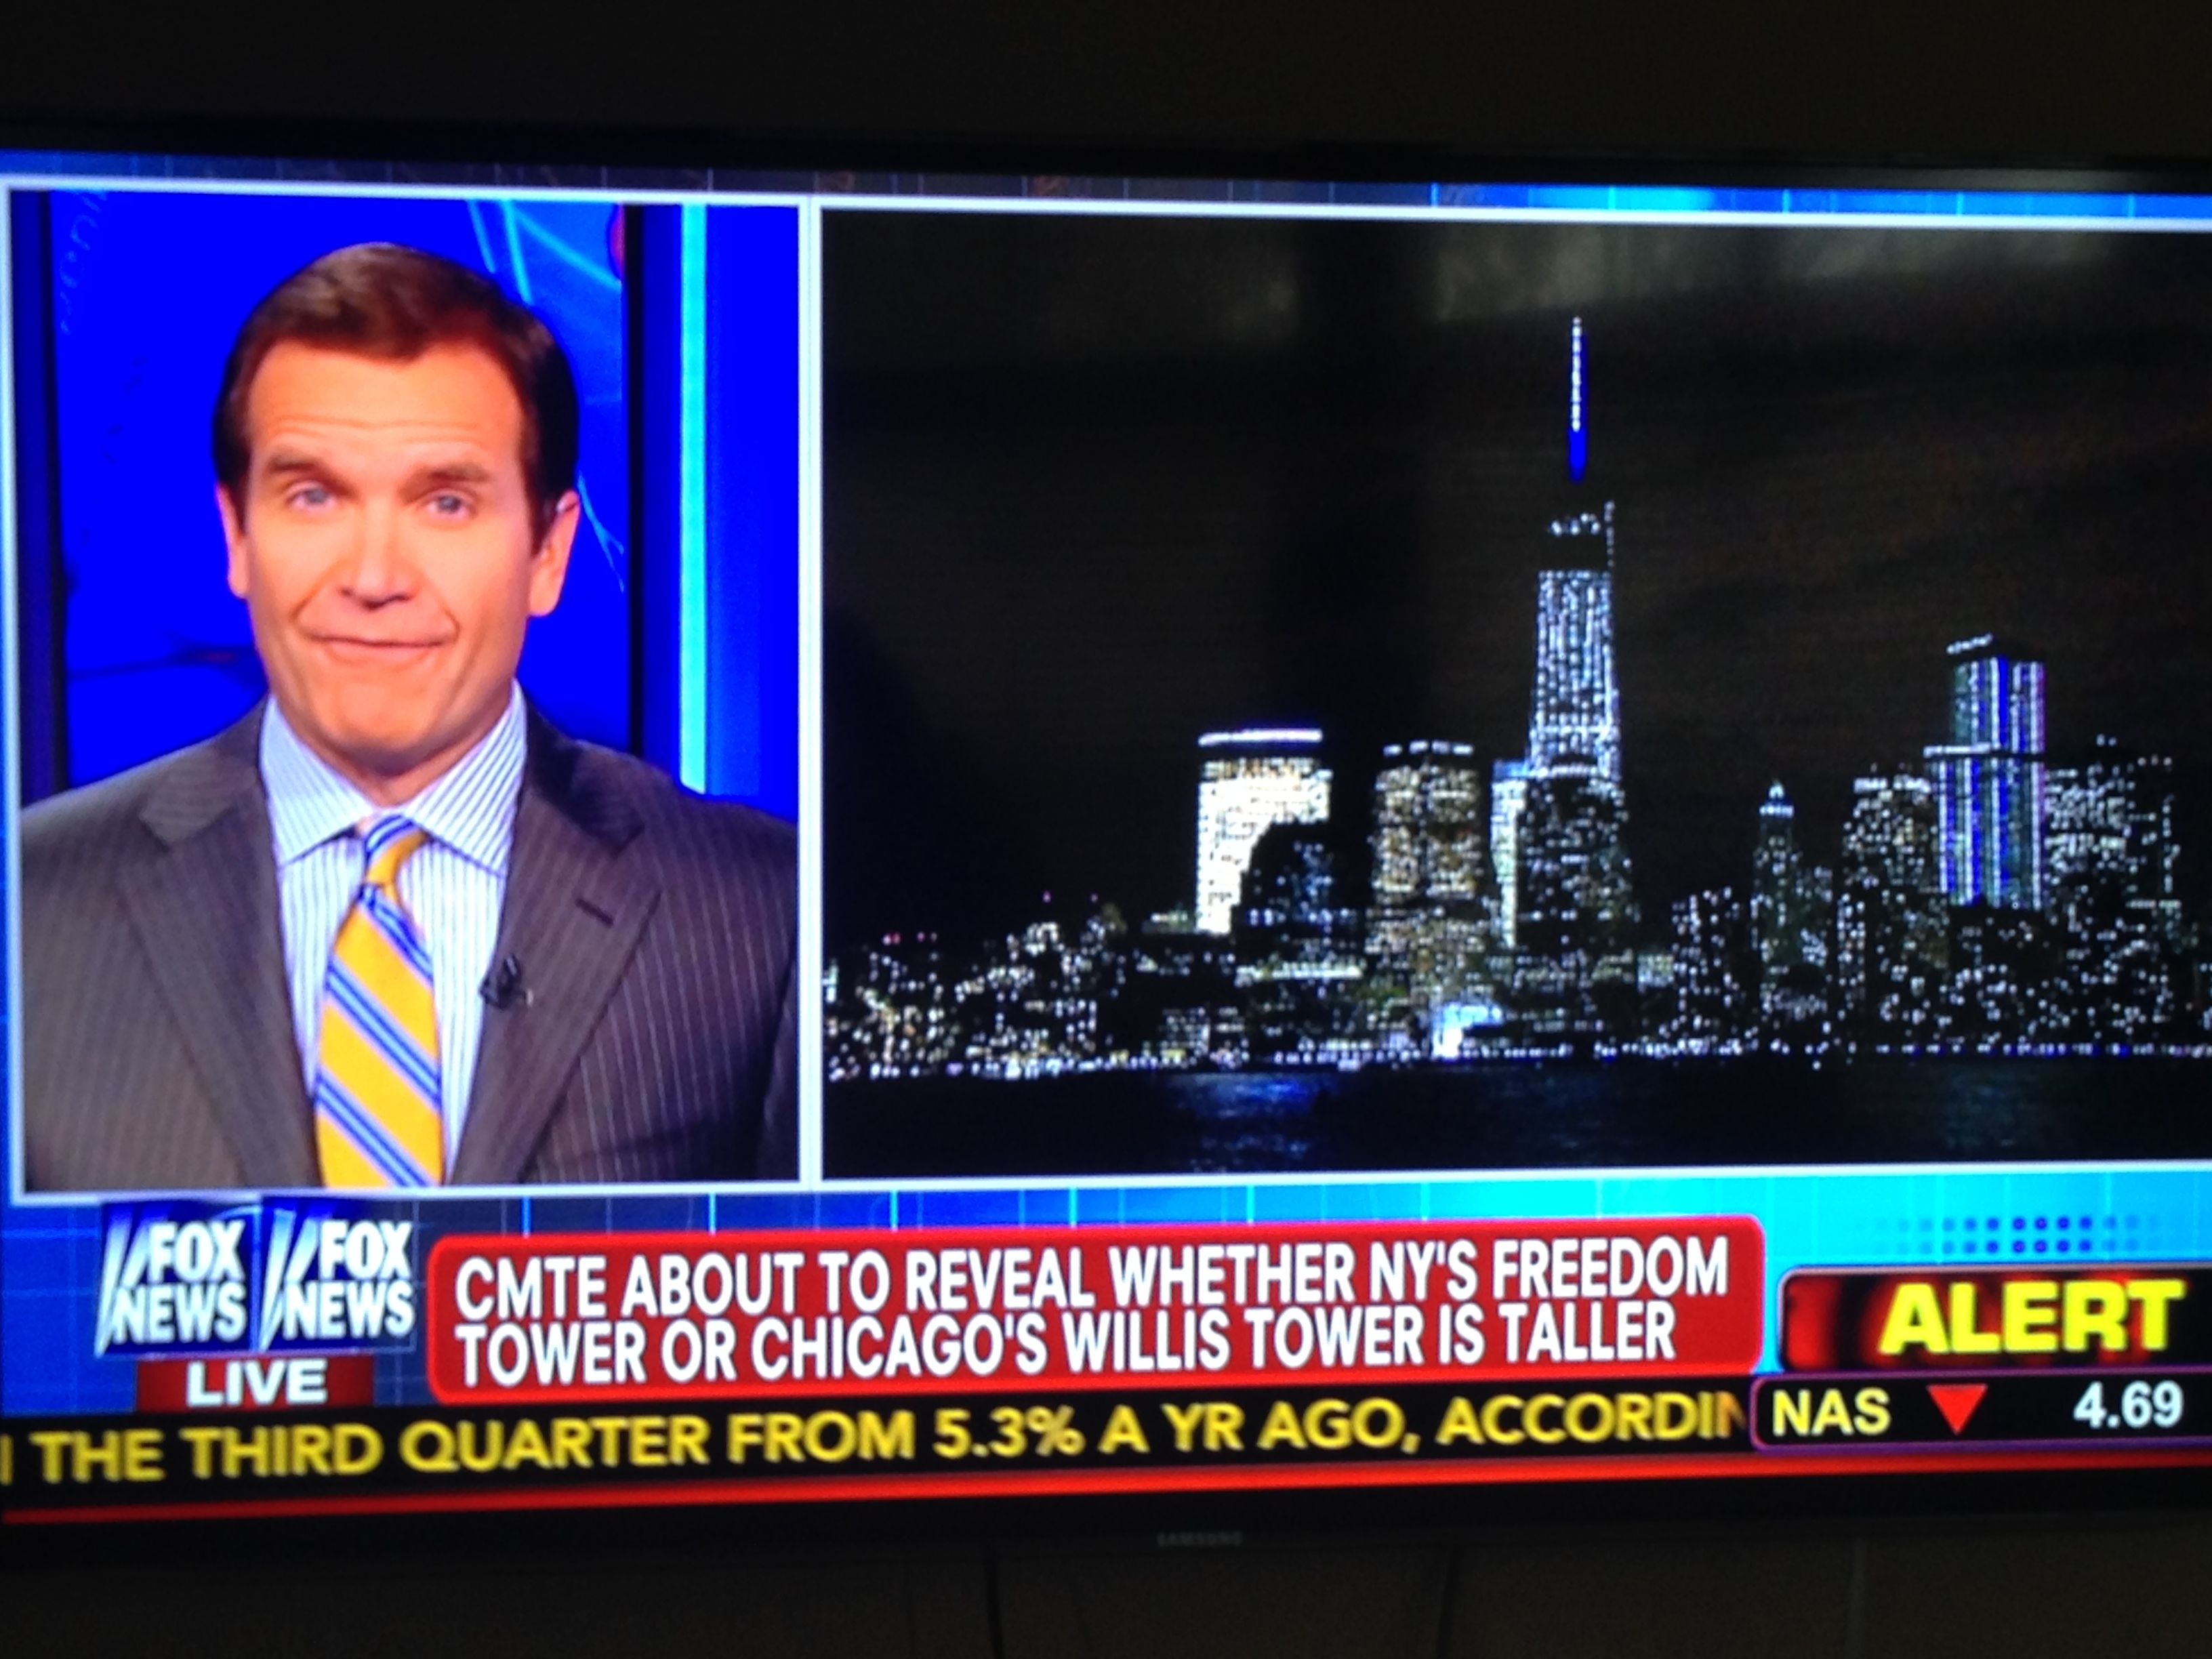
the Skyscraper Index in full affect?
I remember studying socioeconomic indicators during the CMT and also remember the same type of “announcement” in 2007. So, I went to the authority for everything – Wikipedia – and found: http://en.wikipedia.org/wiki/Skyscraper_Index
Pretty interesting, to say the least … some say it’s true, some say it’s not. I don’t know u’all but I do find it pretty fun to conjecture …
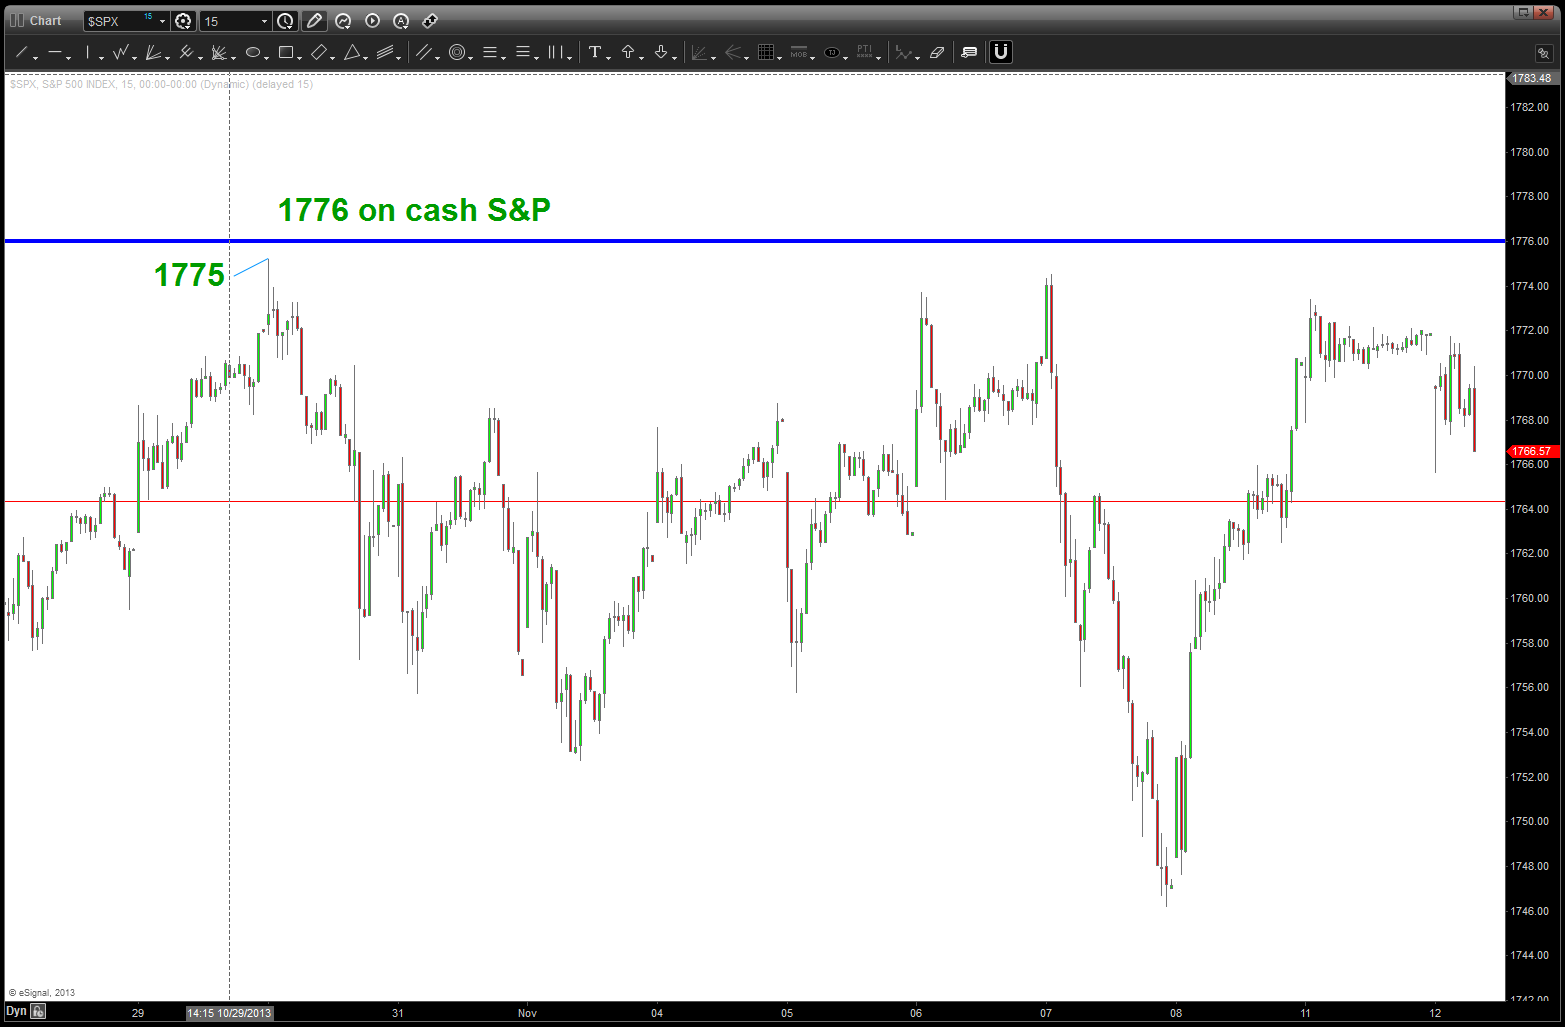
Everyone thought the market was pretty sinister when we found support at 666 on the cash SPX. And, now, well don’t you know that Freedom Plaza is 1776 feet tall, 1776 was a pretty important date in the US History and, the cash S&P closed w/ in one point at 1775. OK, give me slippage and just touch 1776 to make it official – but close enough for government work?
now, come on and work w/ me wouldn’t that be a hoot if 1775 (1776) was the all time high?
so we get the BREAKING NEWS of the tallest skyscaper and then in the WSJ we have the following: http://online.wsj.com/news/articles/SB10001424052702303763804579183680751473884
Take time to read the article … here’s some quotes for digestion:
- The central bank continues to spin QE as a tool for helping Main Street. But I’ve come to recognize the program for what it really is: the greatest backdoor Wall Street bailout of all time.
- In its almost 100-year history, the Fed had never bought one mortgage bond. Now my program was buying so many each day through active, unscripted trading that we constantly risked driving bond prices too high and crashing global confidence in key financial markets. We were working feverishly to preserve the impression that the Fed knew what it was doing.
- Where are we today? The Fed keeps buying roughly $85 billion in bonds a month, chronically delaying so much as a minor QE taper. Over five years, its bond purchases have come to more than $4 trillion. Amazingly, in a supposedly free-market nation, QE has become the largest financial-markets intervention by any government in world history.
- Having racked up hundreds of billions of dollars in opaque Fed subsidies, U.S. banks have seen their collective stock price triple since March 2009. The biggest ones have only become more of a cartel: 0.2% of them now control more than 70% of the U.S. bank assets.
- As for the rest of America, good luck. Because QE was relentlessly pumping money into the financial markets during the past five years, it killed the urgency for Washington to confront a real crisis: that of a structurally unsound U.S. economy.
tick tick tick tick – http://www.ranker.com/list/seinfeld_s-greatest-george-steinbrenner-moments/the-doctor – OMG everyone under the desk …
Bart
PS – Mr. Huszar, you are forgiven. Quick question, can you give me a hint of when they are going to stop intervening? Would help the case for a short or do we not have free flowing markets anymore? Just curious …
Pound Foldback Updated
Posted on November 12, 2013 1 Comment
last post on the Pound:
https://bartscharts.com/2013/11/05/jec-silver-past-fractals-and-the-pound/
updated charts to the pound .. notice the Head and Shoulders that has formed:
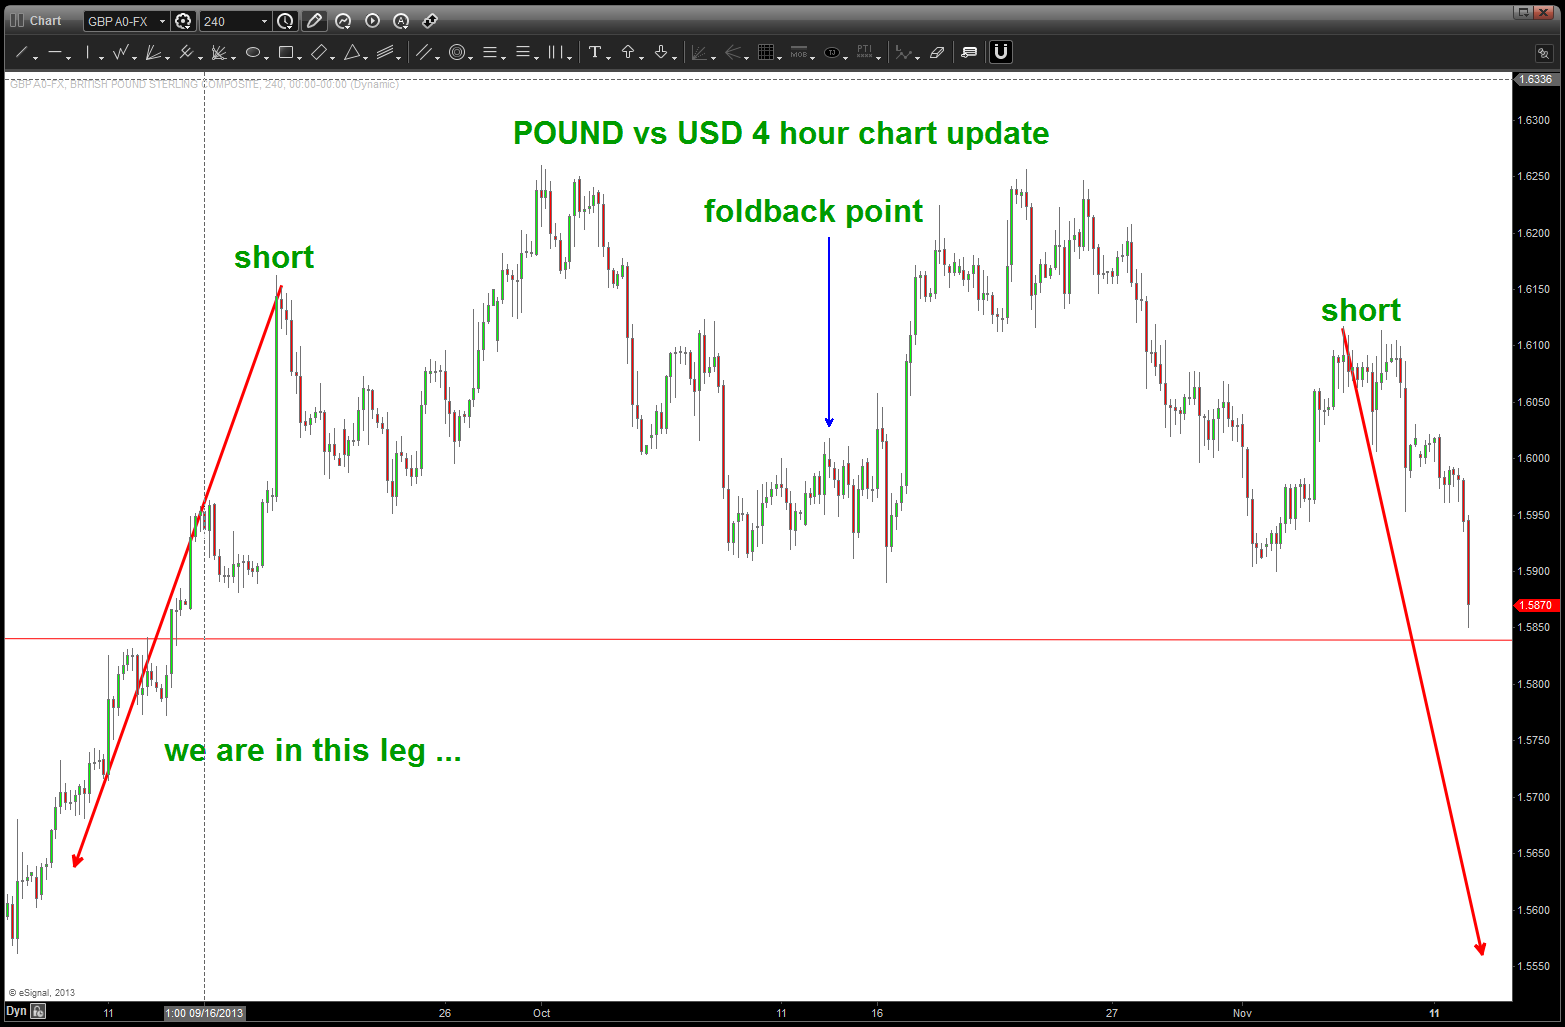
Pound Foldback in action
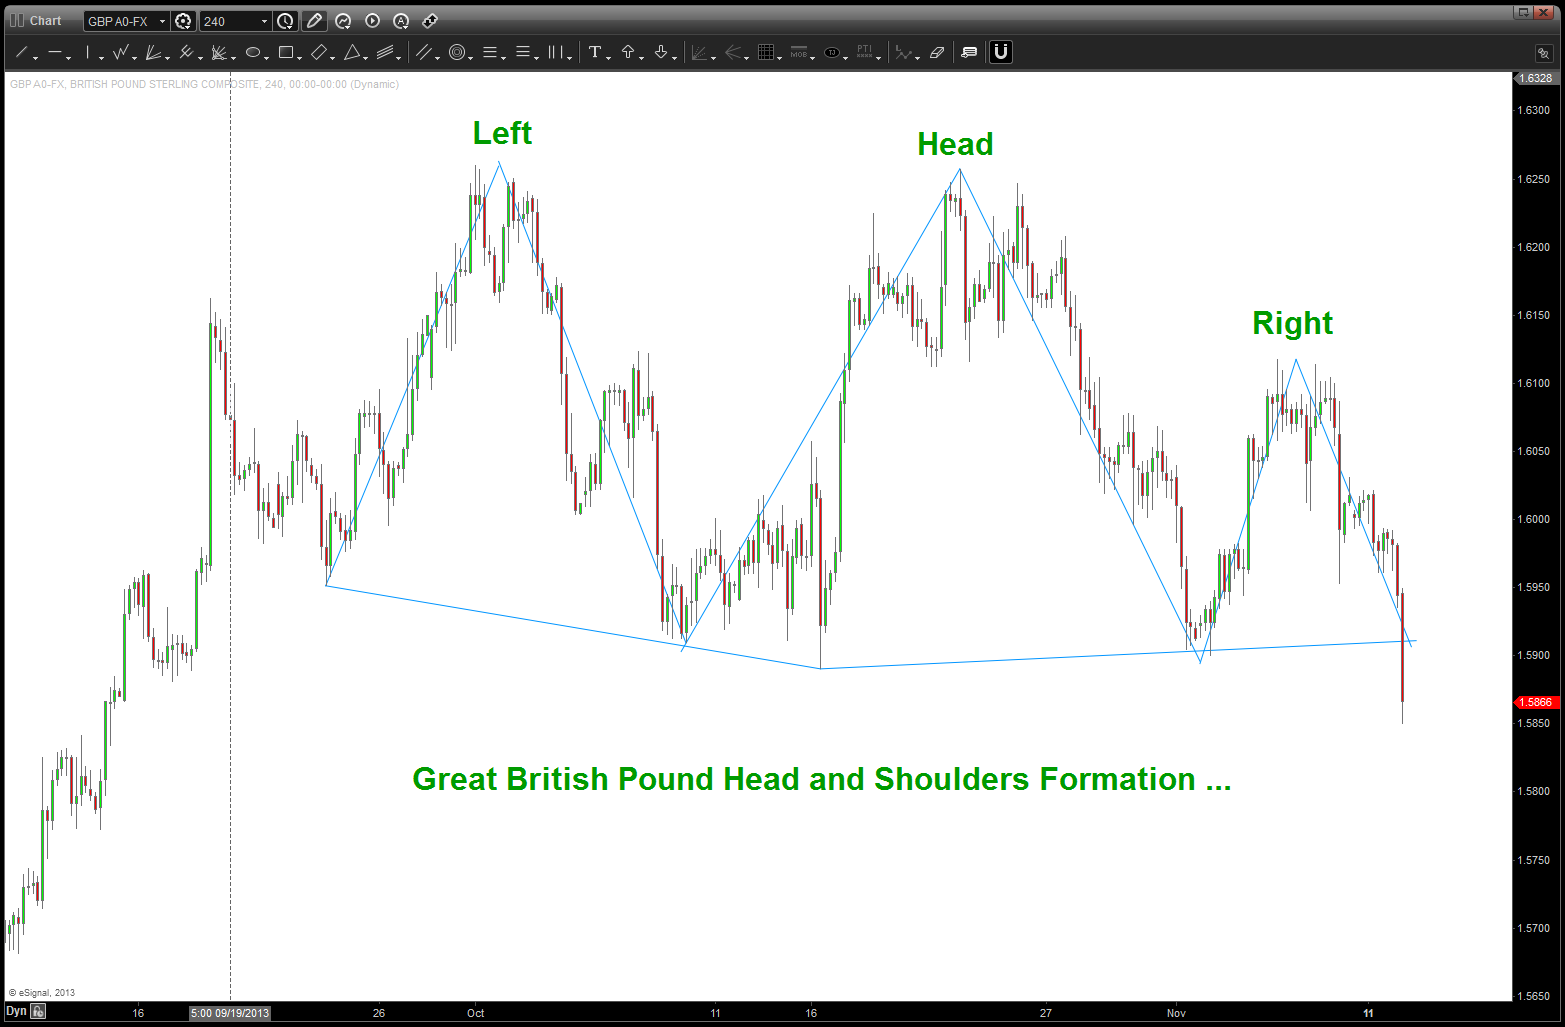
Potential Neckline Break and Head and Shoulders Top
New York Stock Exchange … PATTERN COMPLETE in Price and Time. CAVEAT EMPTOR
Posted on November 11, 2013 Leave a Comment
Personally, I like this index – why? as far as I know, they no longer have a futures market for it so “what you see is what you get.”
From Wikipedia: The NYSE Composite is a stock market index covering all common stock listed on the New York Stock Exchange, including American depositary receipts, real estate investment trusts, tracking stocks, and foreign listings. Over 2,000 stocks are covered in the index, of which over 1,600 are from United States corporations and over 360 are foreign listings; however foreign companies are very prevalent among the largest companies in the index: of the 100 companies in the index having the largest market capitalization (and thus the largest impact on the index), more than half (55) are non-U.S. issues.[1] This includes corporations in each of the ten industries listed in the Industry Classification Benchmark. It uses free-float market cap weighting.
Funny, it hasn’t made a new high has it? if you have been following our work of late, we have rolled 6 major thesis points in the intermarket world that shows a top is at hand or in place. We have also looked at ratio’s of staples/spx and wallmart/spx and have shown PATTERNS that have completed. we also have used extremely long term points to look for resistance areas (see DOW post) and now we are using the all time low on the NYSE Index to show how in October 1974 at 347.7 and showing how that is a key node for projections and retracements ..
so what do we have now … we have a major pattern completing on this “pure index” on a monthly basis. also, and I think most importantly, we have the purple triangles equal to each other in PRICE and TIME.
but, I’m going to be objective here — PATTERNS do fail. I am an intermarket musician and I try to weave patterns across multiple aspects of the circle of life and look for key inflection points. I am NOT a TIMER or a BOTTOM/TOP picker. I’m a pattern recognition trader and if that is a top or bottom, I really don’t care …
I’ll leave you w/ one final thought … a fellow trader, mentor and dear friend has lived and breathed and still trades the market after 60 years of being in the game… his quote today was “I have never seen anything like this in my trading life. SOMETHING is not right in camelot.”
And the band played on … a chart for your viewing pleasure:

New York Stock Exchange Index
so, TSLA did like that i drove in one .. but i didn’t buy
Posted on November 11, 2013 Leave a Comment
post from Friday:
update …notice the blue trend line that held as support — that is the reason (polarity) that we came back and touched it and now it’s support. that could do it for the bounce but after such a strong sell move, believe we ‘ll pop up and do another measured move UP into the low 160’s or even 170 before more selling …we still have a lot of emotional/parabolic “feelings” to work off …I expect another wave down after this bounce completes.
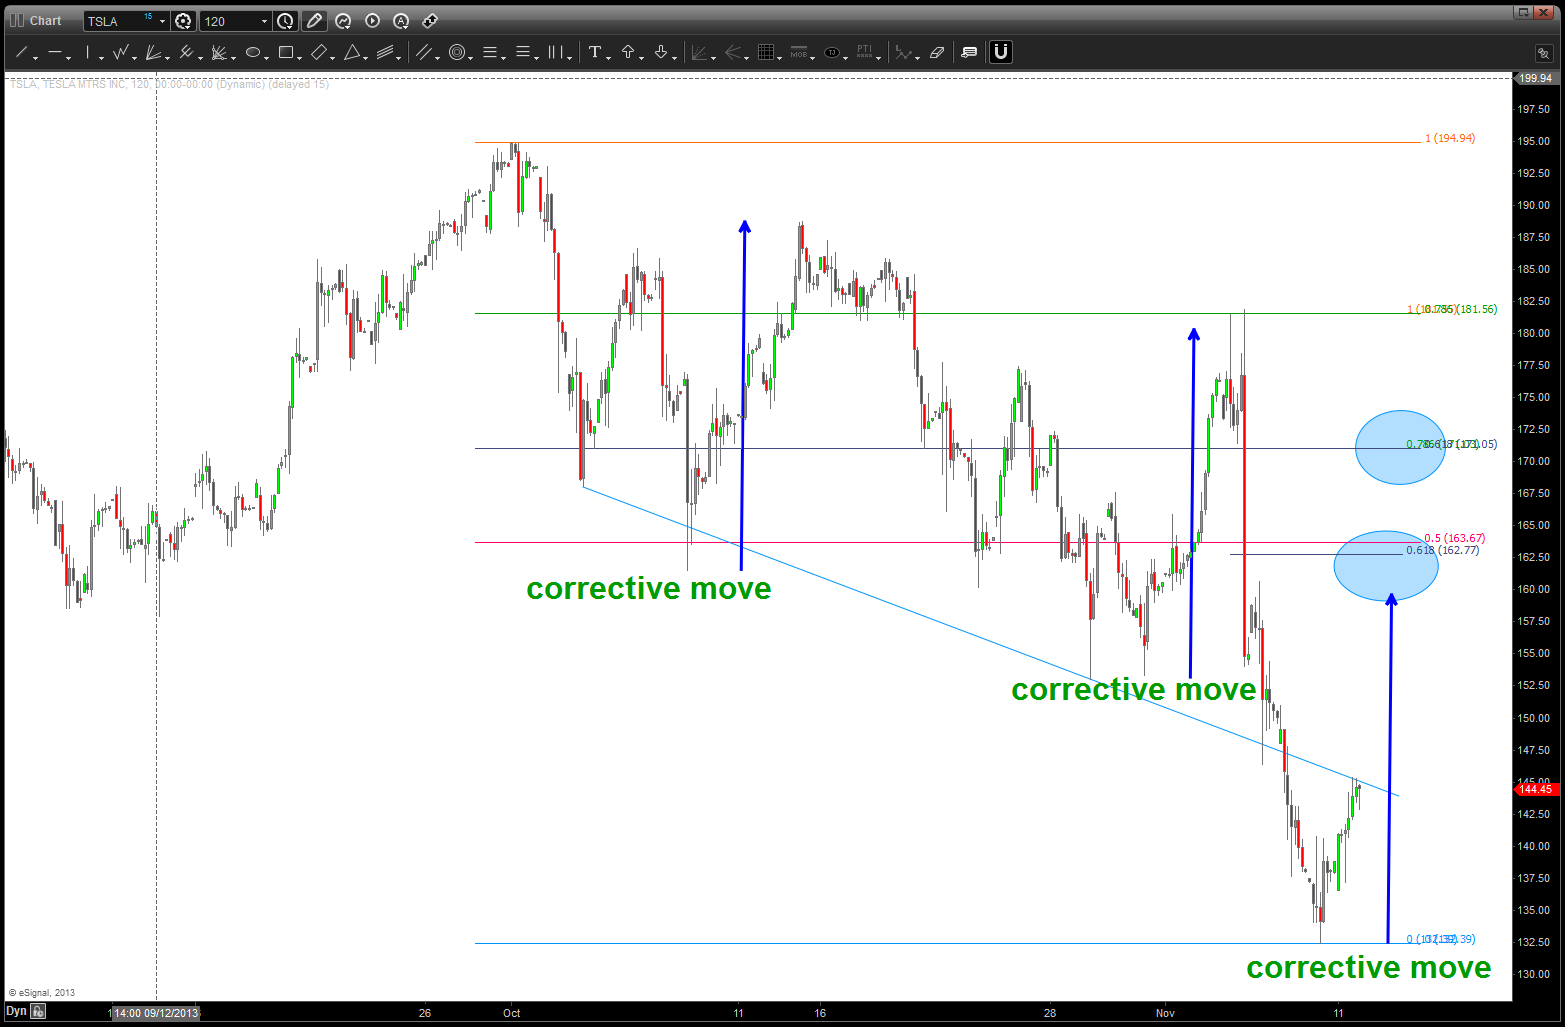
TSLA bounce
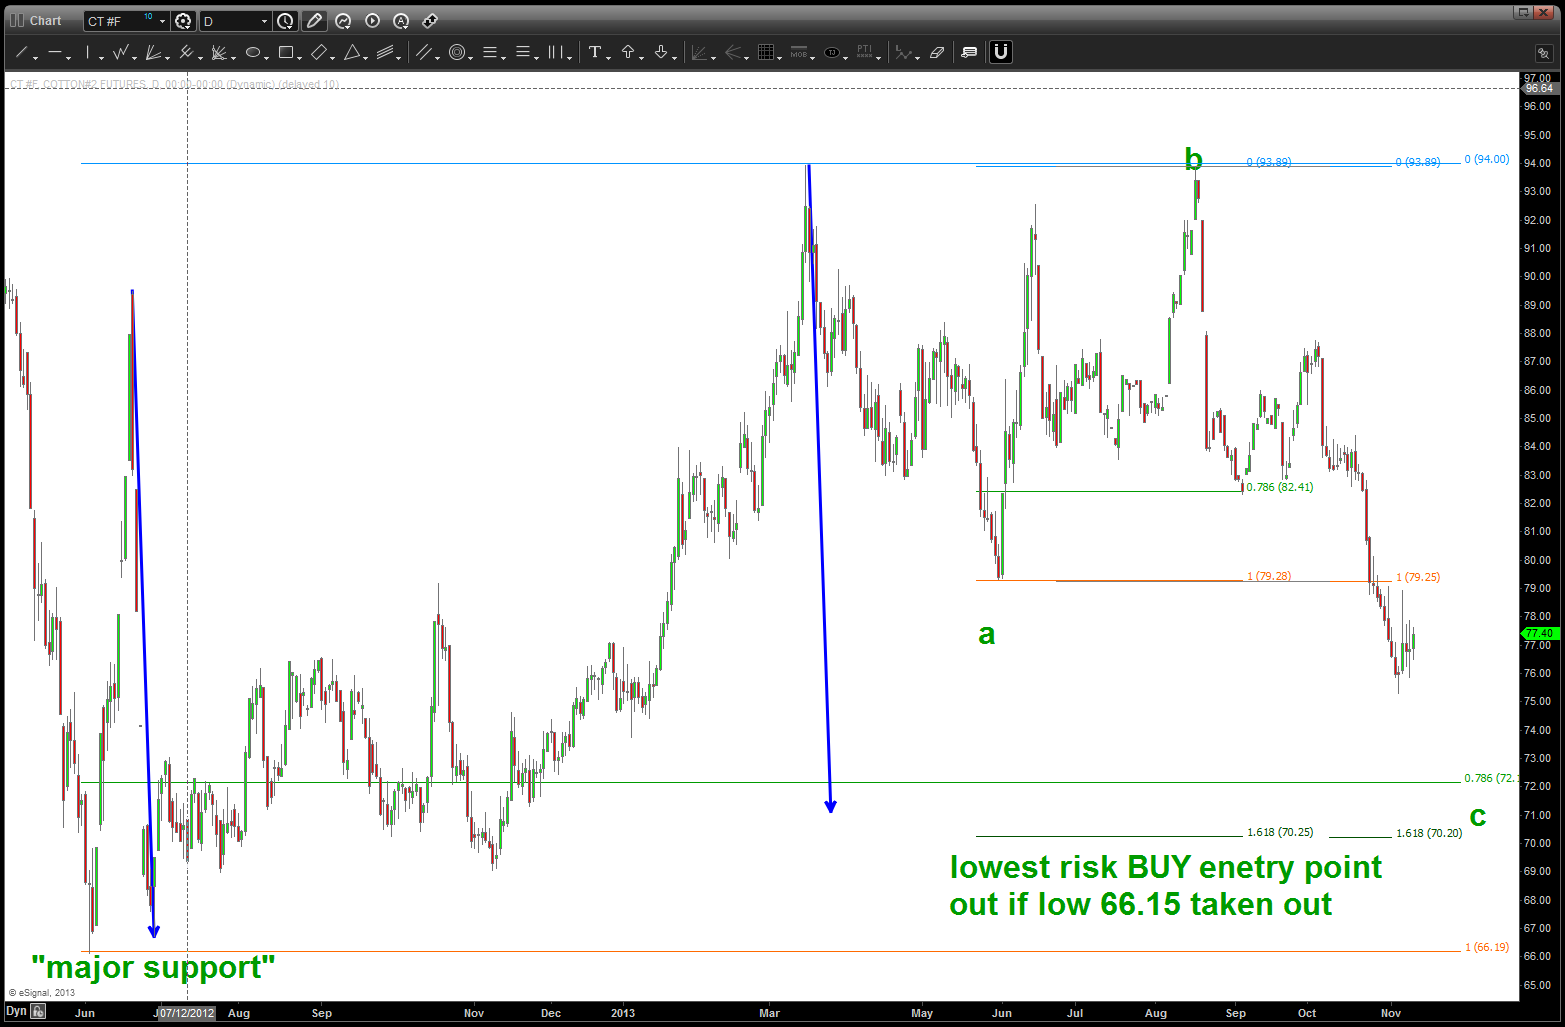
can’t beat a good cotton shirt …they might be getting more expensive, soon
Posted on November 11, 2013 Leave a Comment
Cotton came down and bounced off a major level (.786 retrace) that had it’s “node” from 1971. it’s been correcting since March in a very nice 3 wave down (a), 3 wave up (b) and now finishing, what I believe to be a C wave. Can make the case for 76 being the low but would wait to in/around 70-72 as many more confirmations are present (blue arrow measured move correction, 1.618a = c, .786, 1.618 extension and, it just looks like there is one more wave down)
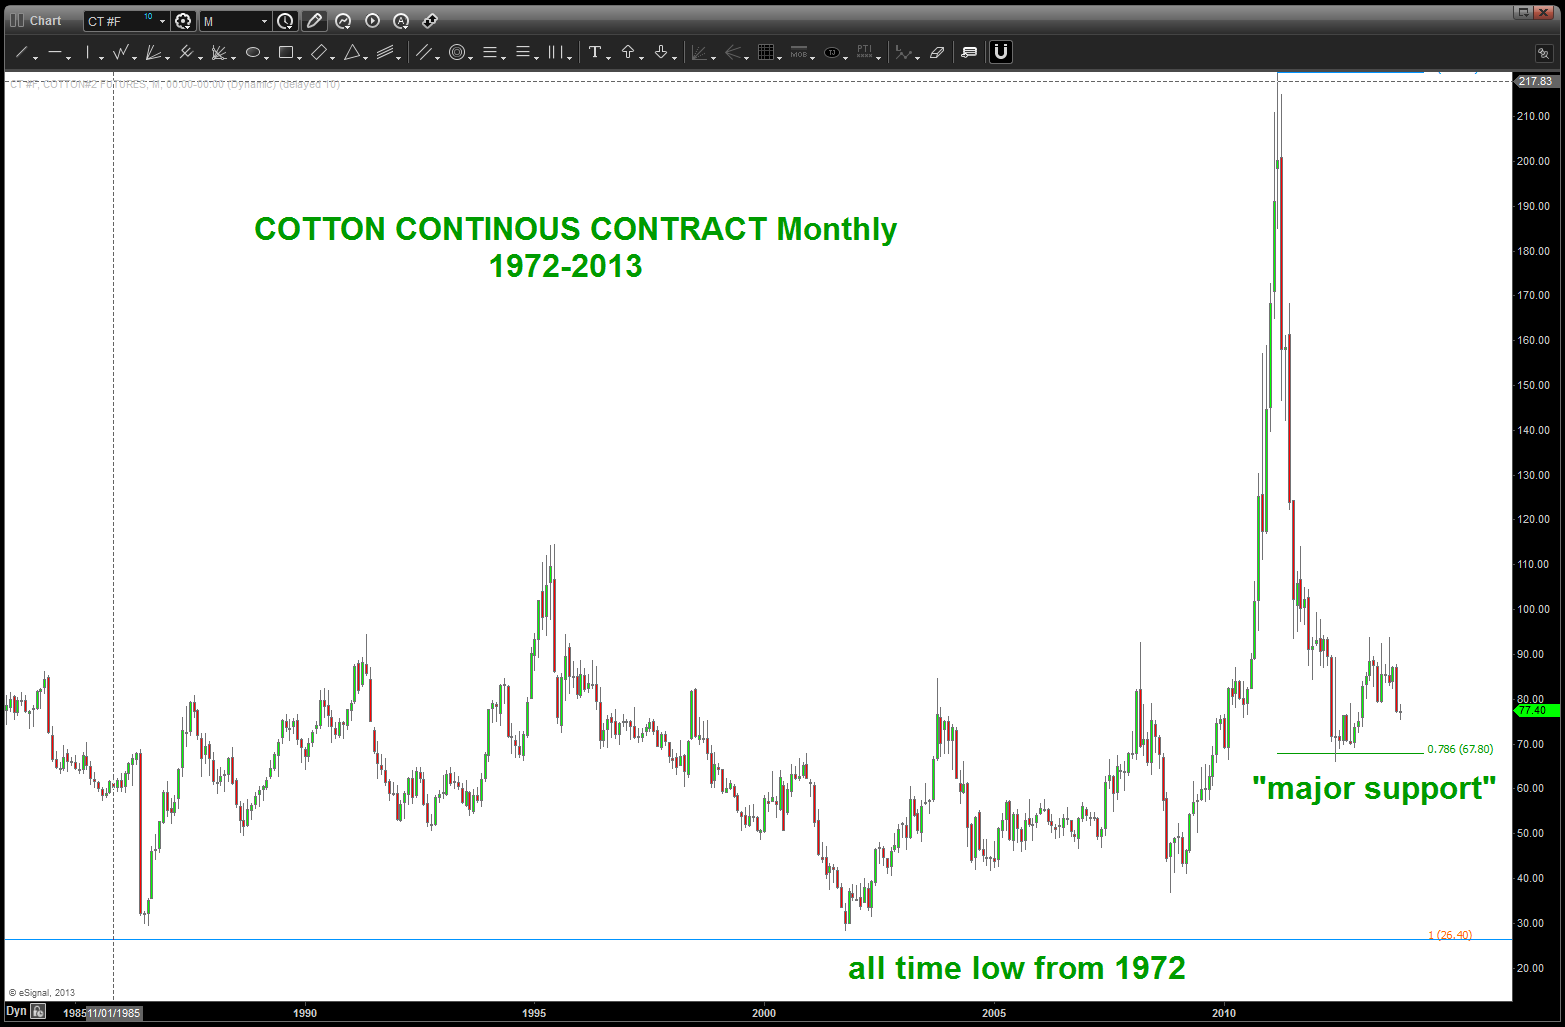
cotton support from 1972 node