Fixed Income – TIME is right but what about the price and the underlying trend?
to catch up on prior fixed income posts:
https://bartscharts.com/2013/10/21/plotting-the-next-move-in-fixed-income/
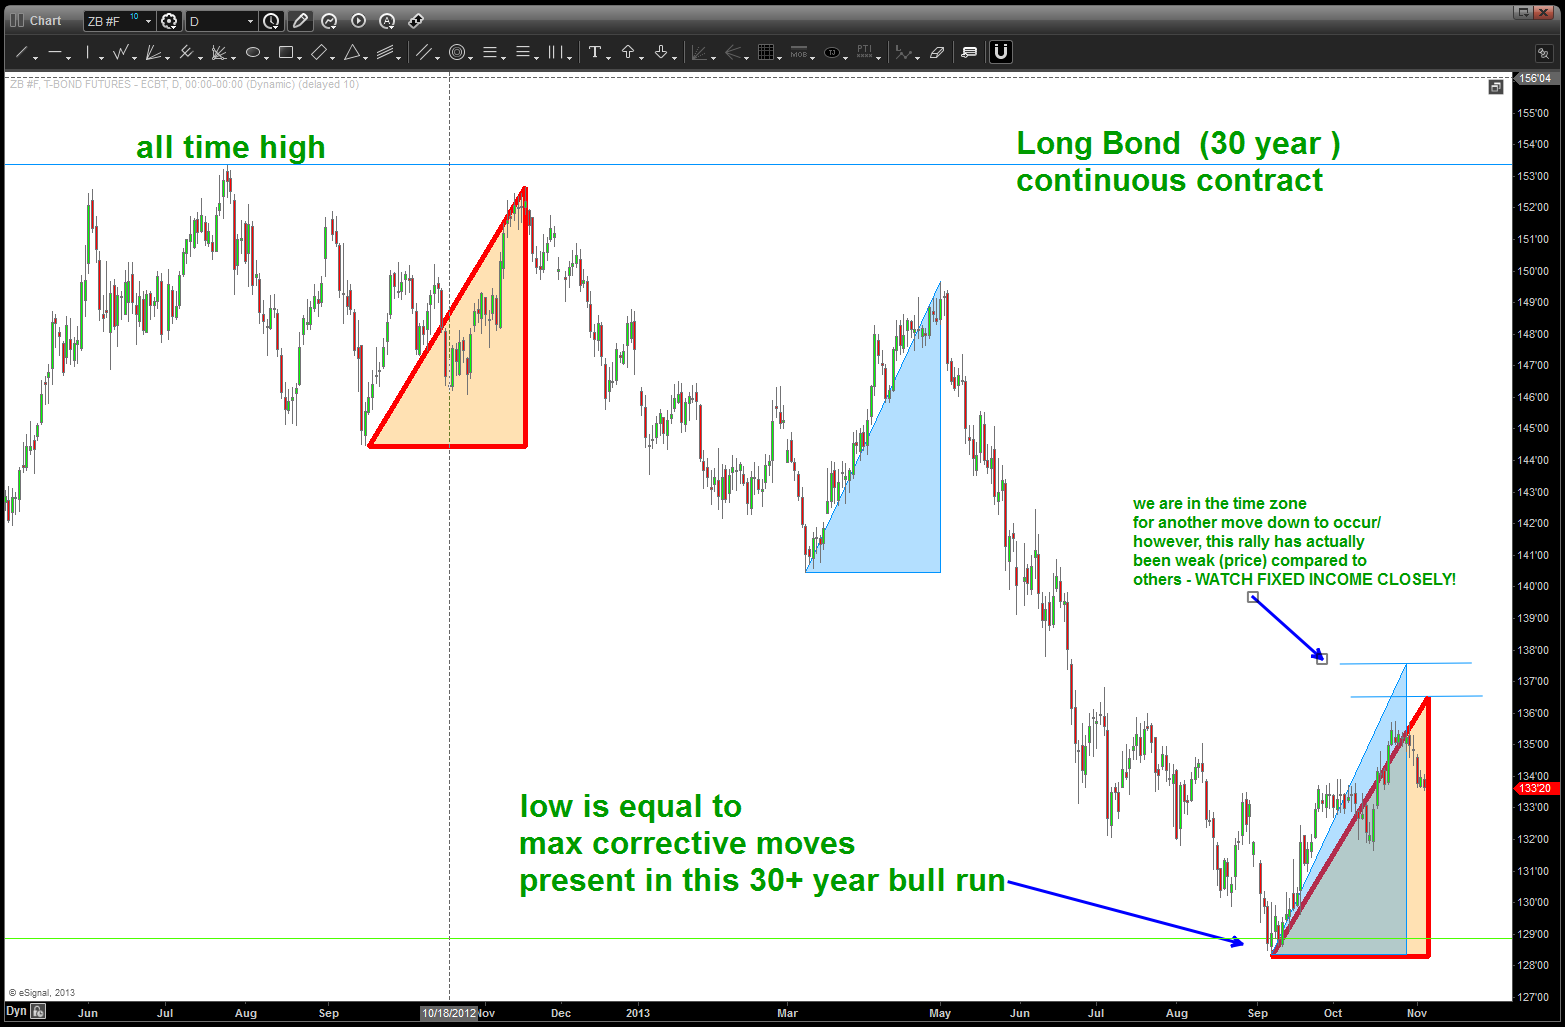
keep an eye on fixed income. the two triangles shown at the bottom of the chart represent the PRICE and TIME extremes that have occurred w/in the context of the top in Bonds last year. Note, the current rally has not exceeded either one in PRICE but we are definitely in the time window of a move down to start. IMHO it’s too soon to call a BEAR market in fixed income as we have just completed a “normal” measured move correction w/ in the context of a 30 year bull run. HOWEVER, we will see early signs appear to give a heads up …right now, w/ this time component being present it will be very informative to watch price action as continued strength above the blue horizontal lines during this TIME frame will cause prices to surge UP thereby suppressing YIELD once again.
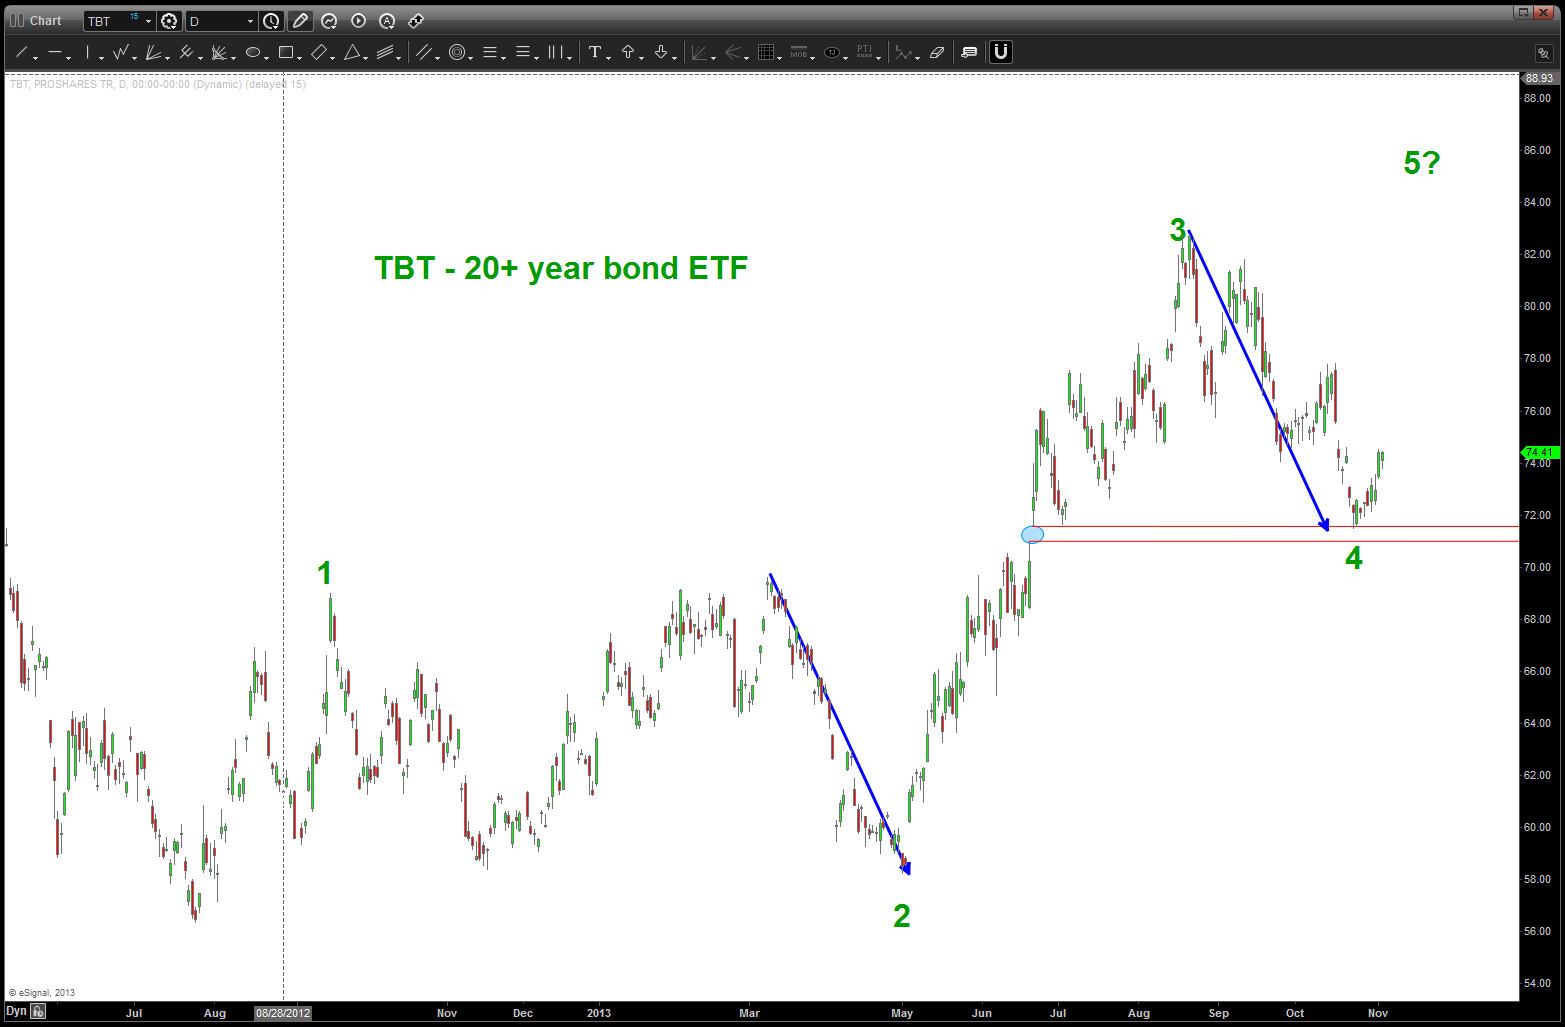
TBT another move higher?

Pingback: fixed income … the one more high or final high in place quick looks | Bart's Charts