JEC, SILVER past fractals and the Pound
Foldbacks are amazingly accurate patterns … they occur on anytime frame and basically give us the “mirror image” of a move … the theory is as they come into an inflection point they will go out of the inflection point the same way. for those still versed in geometry, it’s basically the angle of incidence equals the angle of reflection.
here’s one of many pictures that I have of long term foldbacks in process … it’s a long term chart of JEC (Jacobs Engineering). The first chart shows the geometry of the parabolic move up, the second chart shows price action around the foldback and the third chart shows the result. 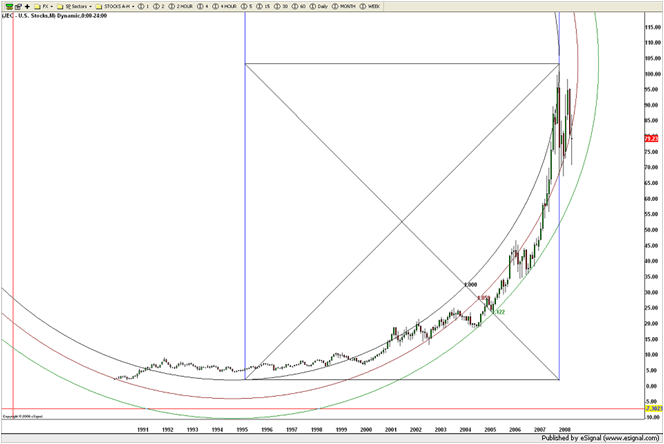
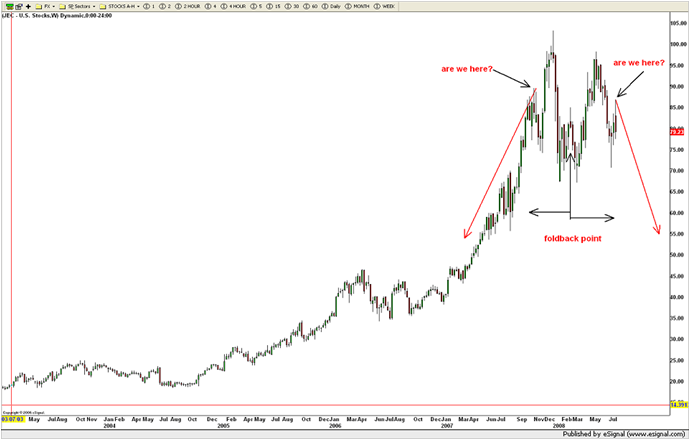
JEC REAL TIME foldback pattern developing
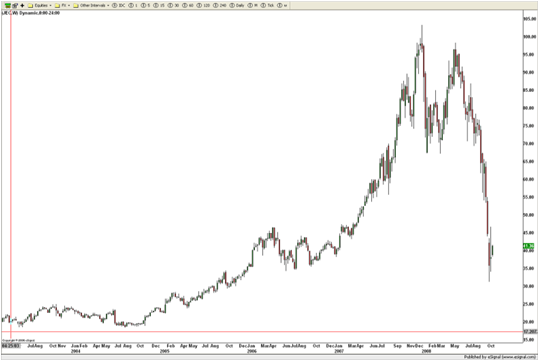
JEC foldback result …
if you go back and study the Silver posts you’ll see that the most recent all time high on silver was just like the above … a mirror image foldback. IF (the big IF) you find the correct balance point then you can watch movement w/ a leading understanding of what to EXPECT (again, only PROBABILITY) Here’s a quick review of the Silver Chart … everything based on the FOLD BACK.
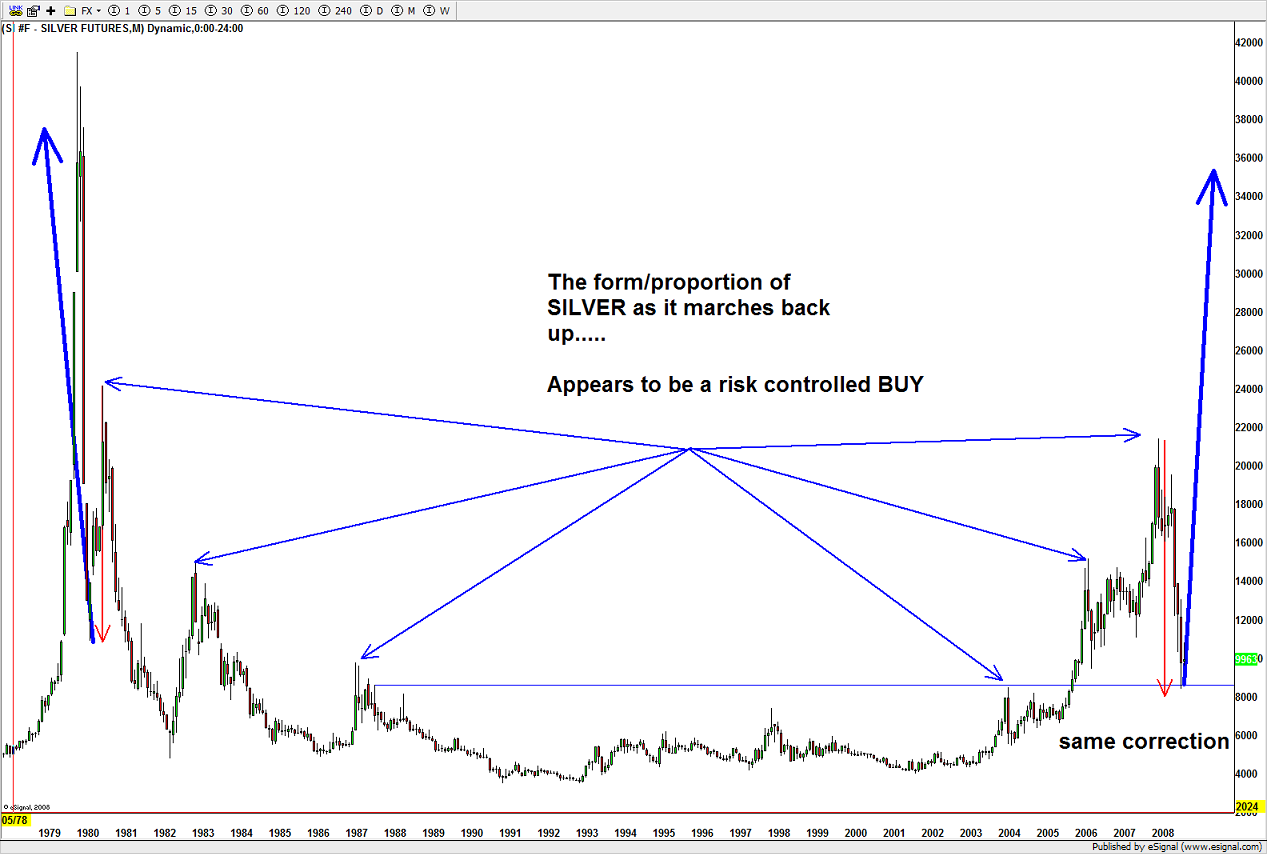
SILVER long term FOLDBACK
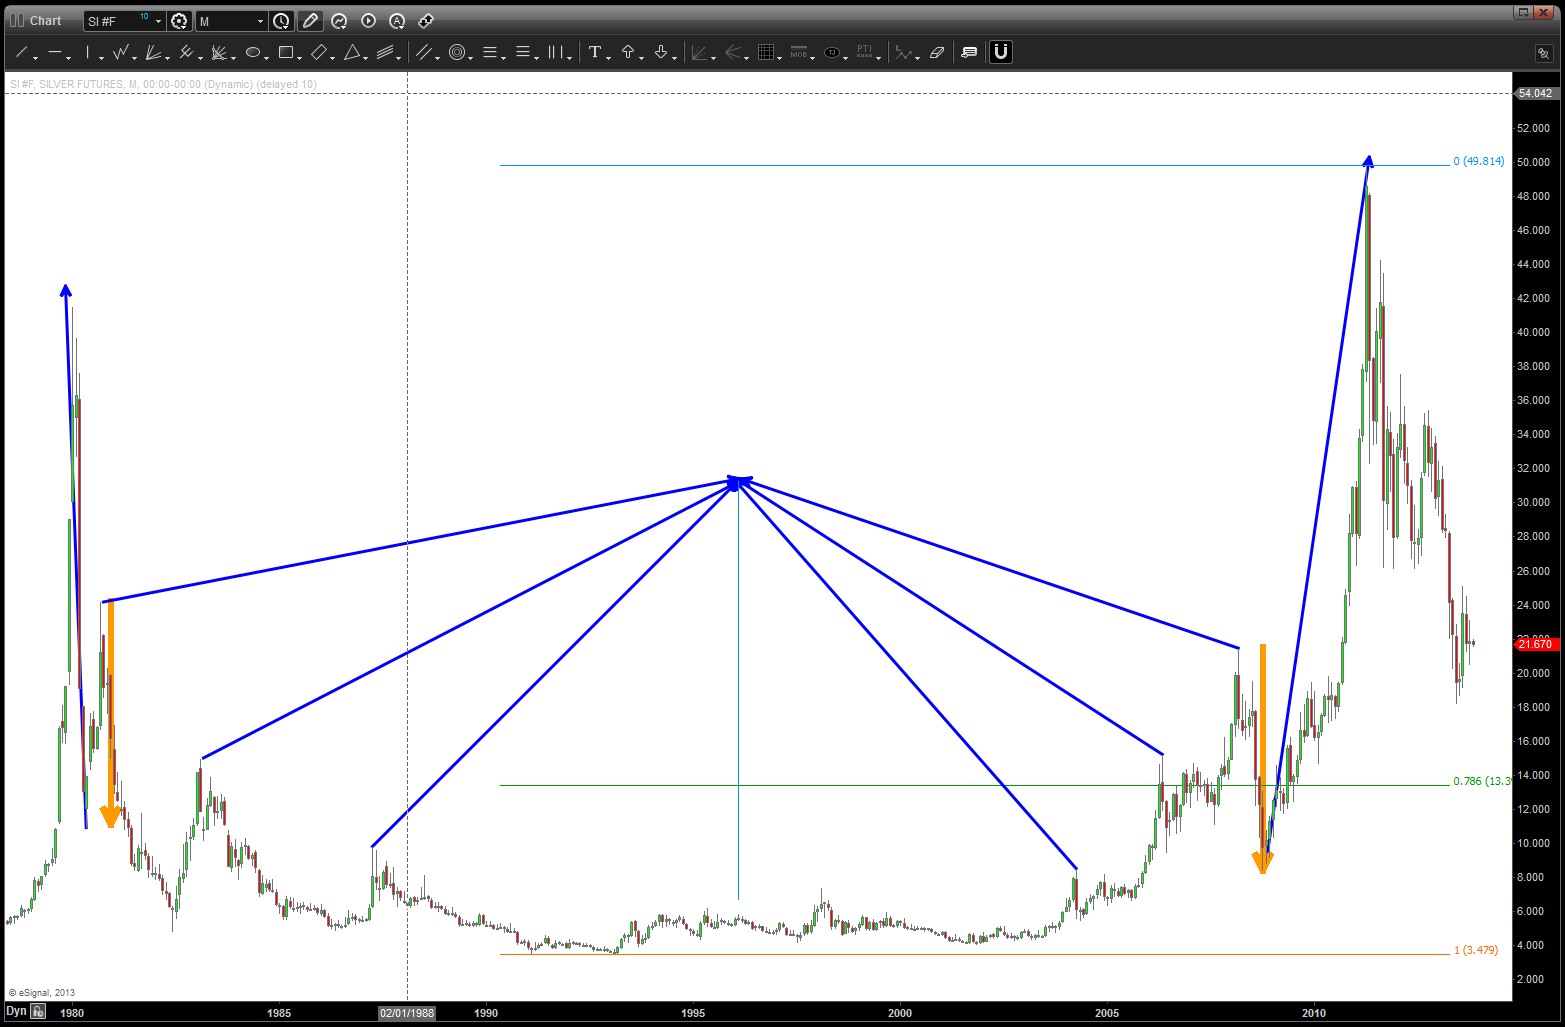
price action according to the foldback
so, much like JEC and SILVER we find a nice POTENTIAL FOLD BACK occurring w/in the Great British Pound Chart ….
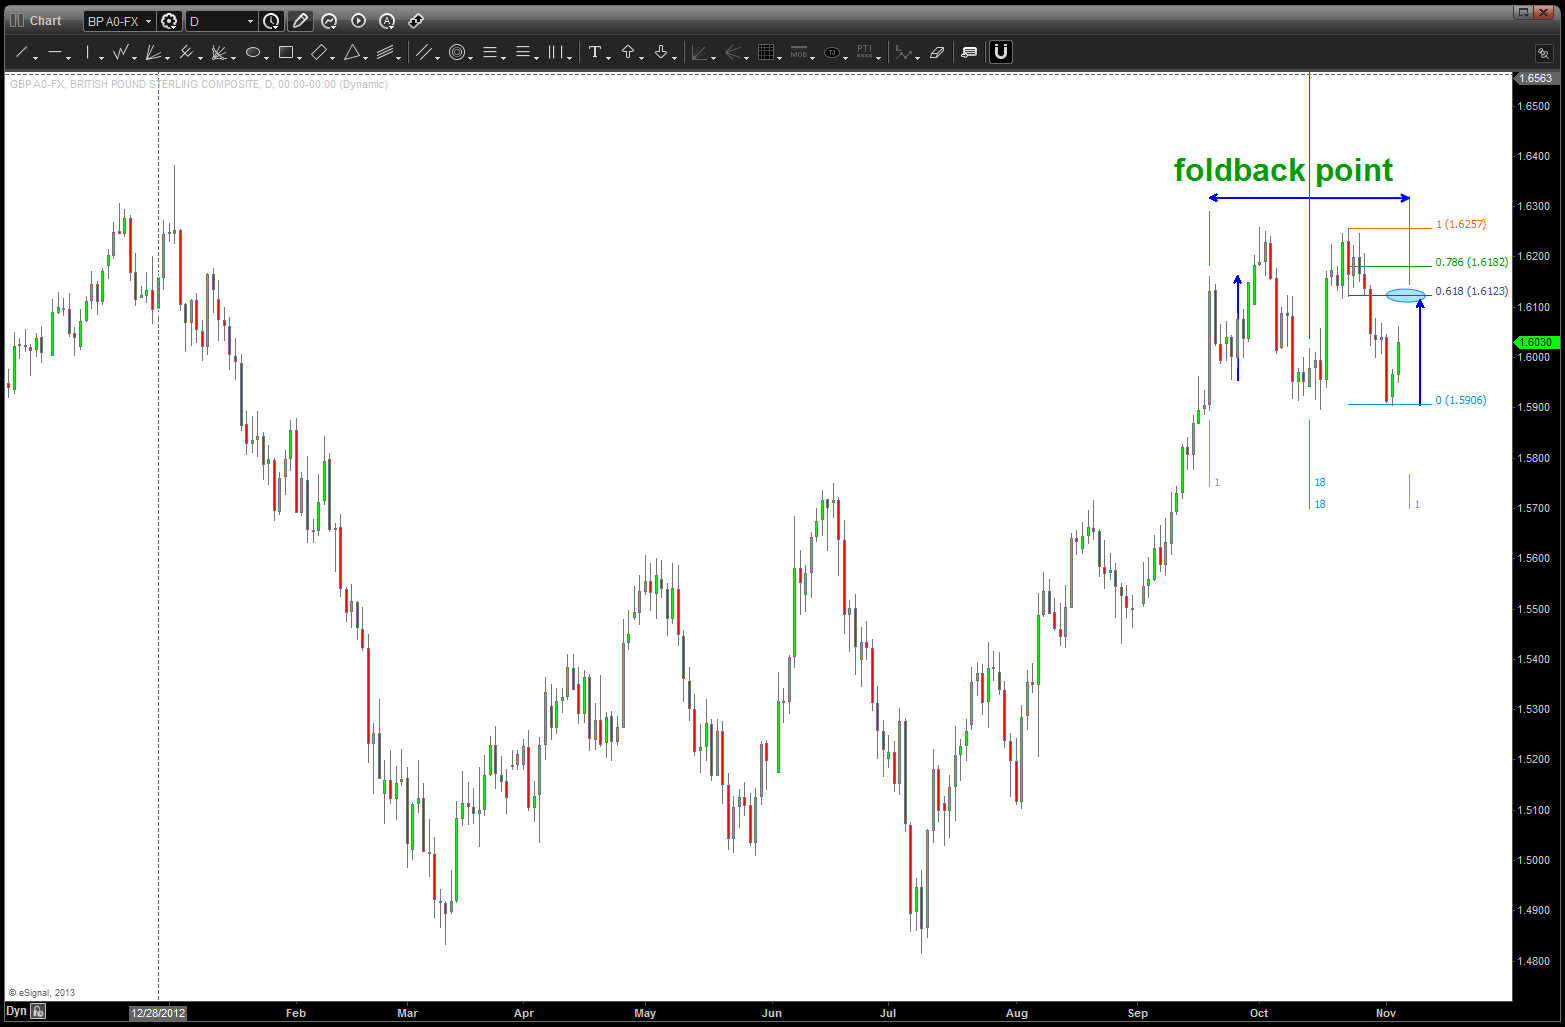
POUND foldback POTENTIAL
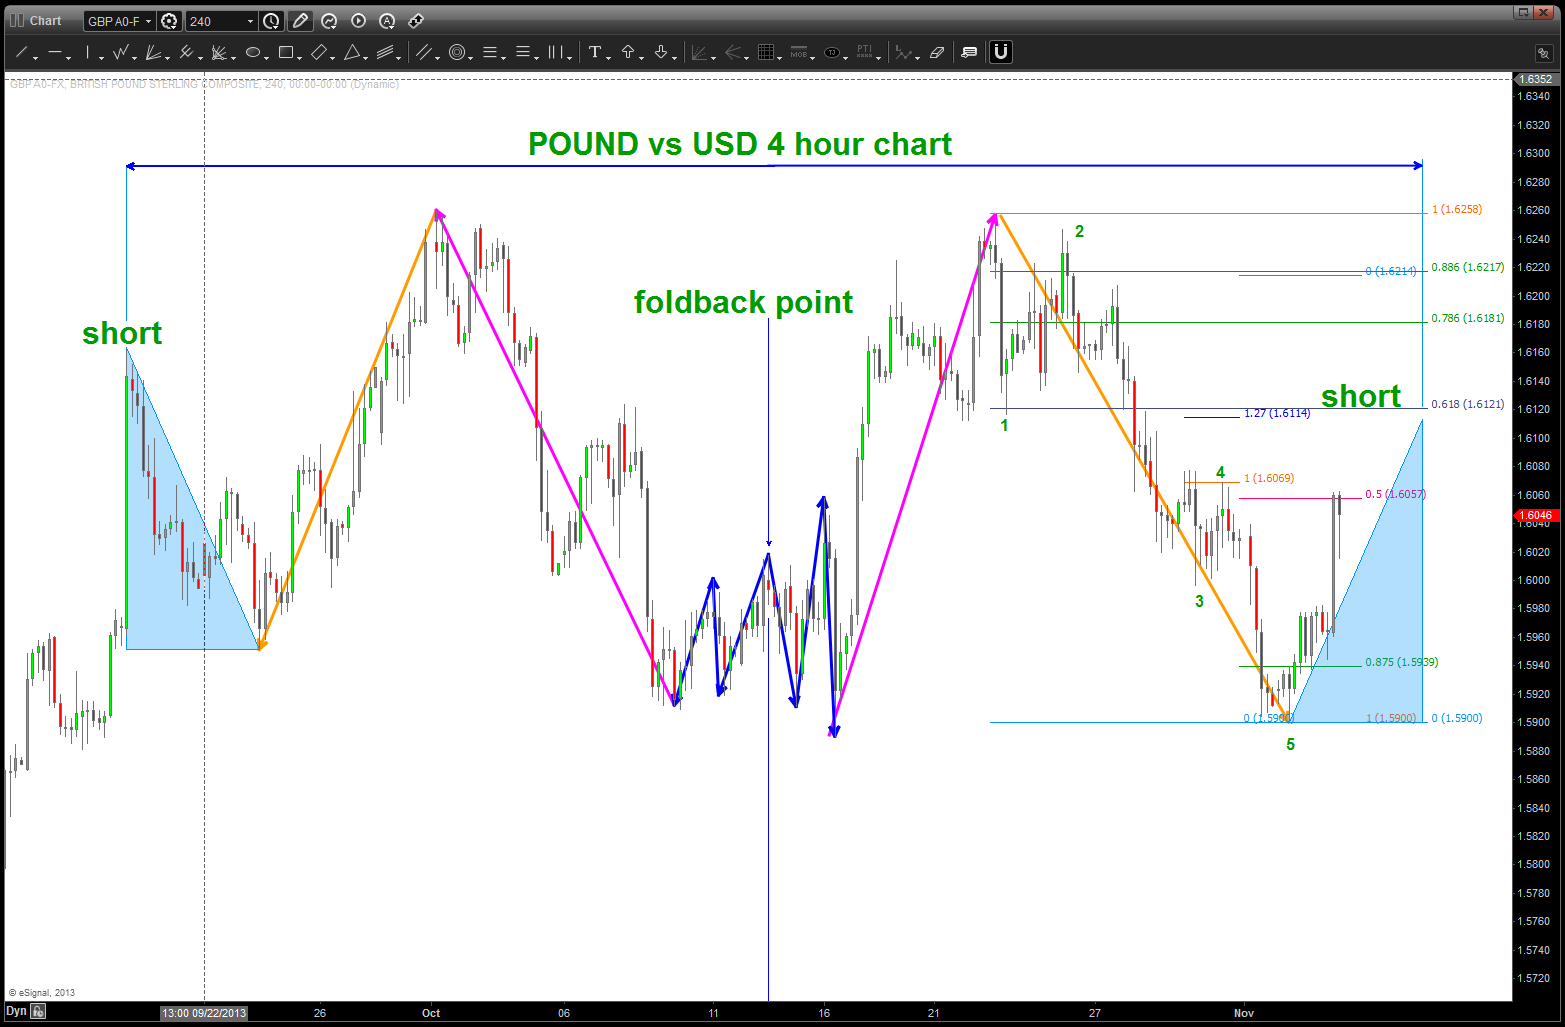
4 hour intra-day look at the pound POTENTIAL fold back setting up
only time will tell if have the fold back working … the great thing from a risk management perspective is they USUALLY only FAIL at the inflection points so a little bit higher on the Pound will tell us a lot.
Here’s past POUND analysis as I continue to try and get short: https://bartscharts.com/2013/10/22/the-pound-gorillas-and-juggling-dynamite/ OBTW ‘best and final’ is still a target so we’ll just have to manage some risk and “scale up” short. Stay tuned …

Pingback: Pound Foldback Updated | Bart's Charts
Pingback: Great British Pound – again | Bart's Charts