fixed income … the one more high or final high in place quick looks
take the time to catch up on by reading/viewing charts from the below links…
last post:
post that warned of a very important top – before I was blogging:
http://allstarcharts.com/are-interest-rates-at-a-key-inflection-point/
bonds sold off hard on Friday and what could be the start of another leg down.
let me digress for a bit .. I LOVE Elliot Wave – when it’s easy to count. LOL – no kidding if you can pay attention to corrections and their form (flats, zig zags, triangles, expanded flats, double threes, etc) and live by the rules (3 can’t be shortest, 2 can’t go above/below the beginning of 1, 4 can’t go past the end of 1) you can get kind of dangerous at it. when I try to force a count it’s probably correcting or “the grid is shifting” and the count will, ultimately come to me. so, am I on a 5 minute chart counting every squiggle? nope … however, I do look for counts on monthly and weekly charts.
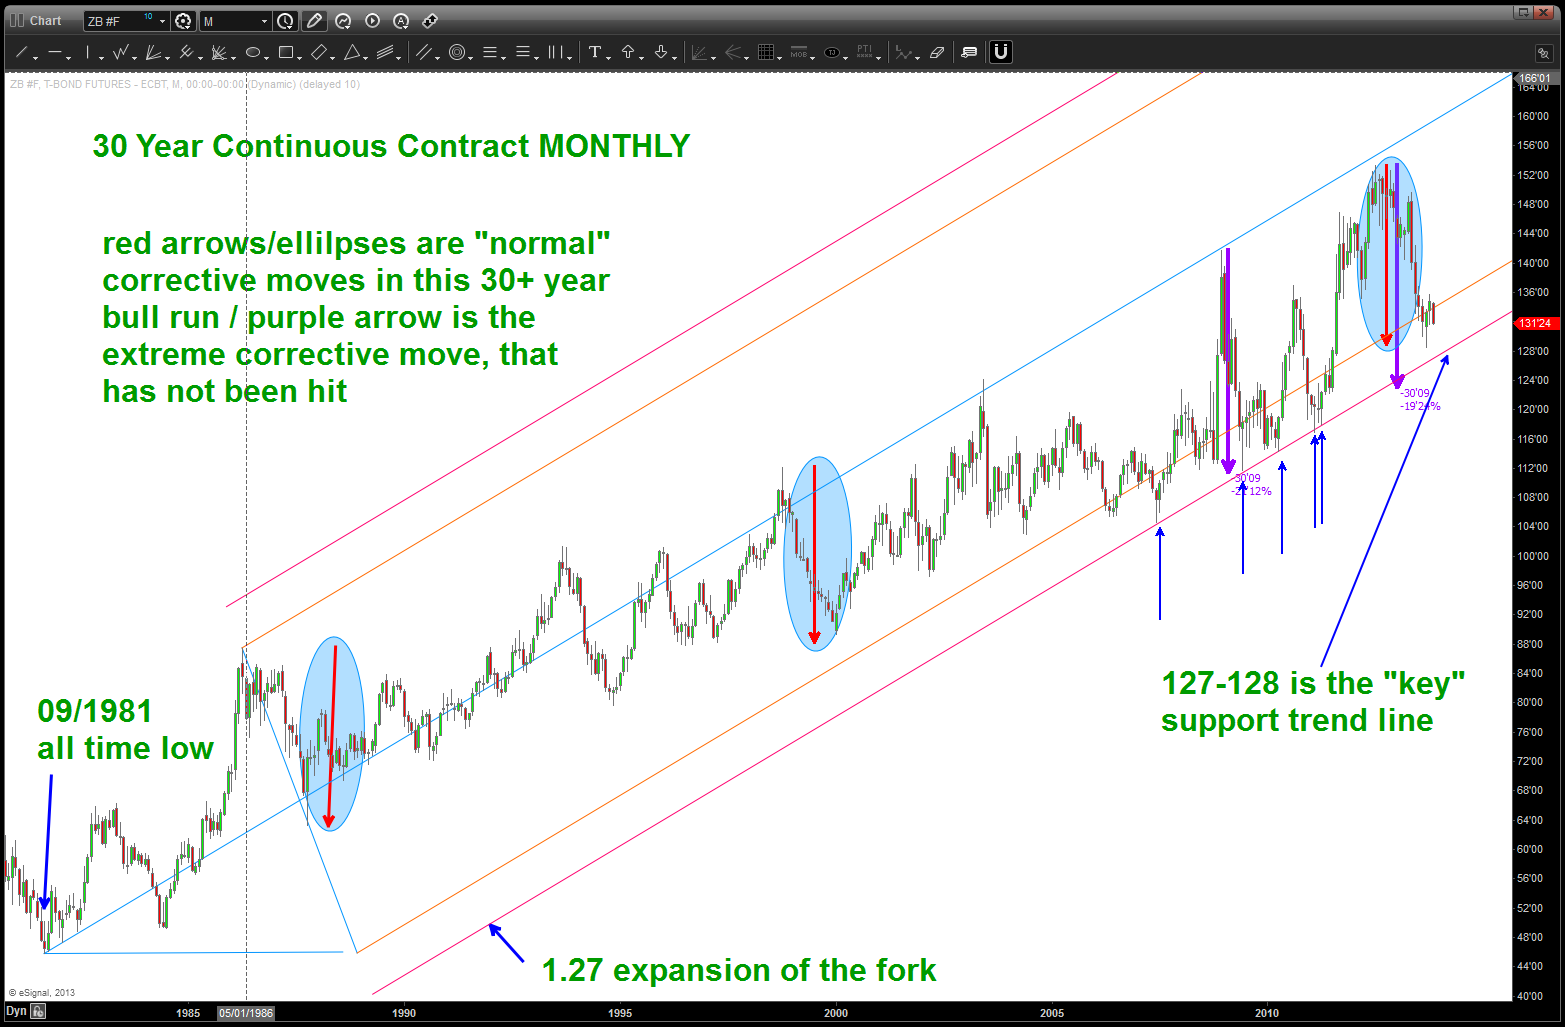
back to fixed income … if we look at the low in the summer of 2009 we’ll see the next leg up on bonds (the last?) start in earnest. Wave 1 peaks out and, as you can see, I have labeled to areas where 1 might have finished. then we go down into 2 and then this is where it gets interesting … if we make (1) = 3 then the correction BLOWS THRU 1 and we have broke our rule so we have to sub-divide and then NICELY count (1), (2), (3), (4),(5) into the all time high and that high becomes 3. for me, it’s the only way that I can count it and NOT break rules.
w/ that in mind, we see a 3 wave move down (a) and then a 3 wave movement up (b) and now we are rolling in a pretty devastating C wave…the “internals” of this C wave are very nice in that 3 was exactly 1.618 of 1 and IF 5=1 we land right on the top of the wave 1 that began the move in 2009 and it also equals the MAX/EXTREME corrective move that has ever occurred in this 30+ year move…IF that level holds and we start going up then, we might be up to another high. Sounds crazy but that is what the chart is telling us w/ regard to “one more high”
the chart:
 here is the bearish count – note the entire 2 was a flat type of correction and therefore, you “could” fit this one into the picture….either way, we are on the right side of the market and I feel pretty certain that we’ll target that long standing trend line at 127-128 (red line) and/or the 124 level. I expect rates to rise accordingly as this target area is attacked. Stay tuned …
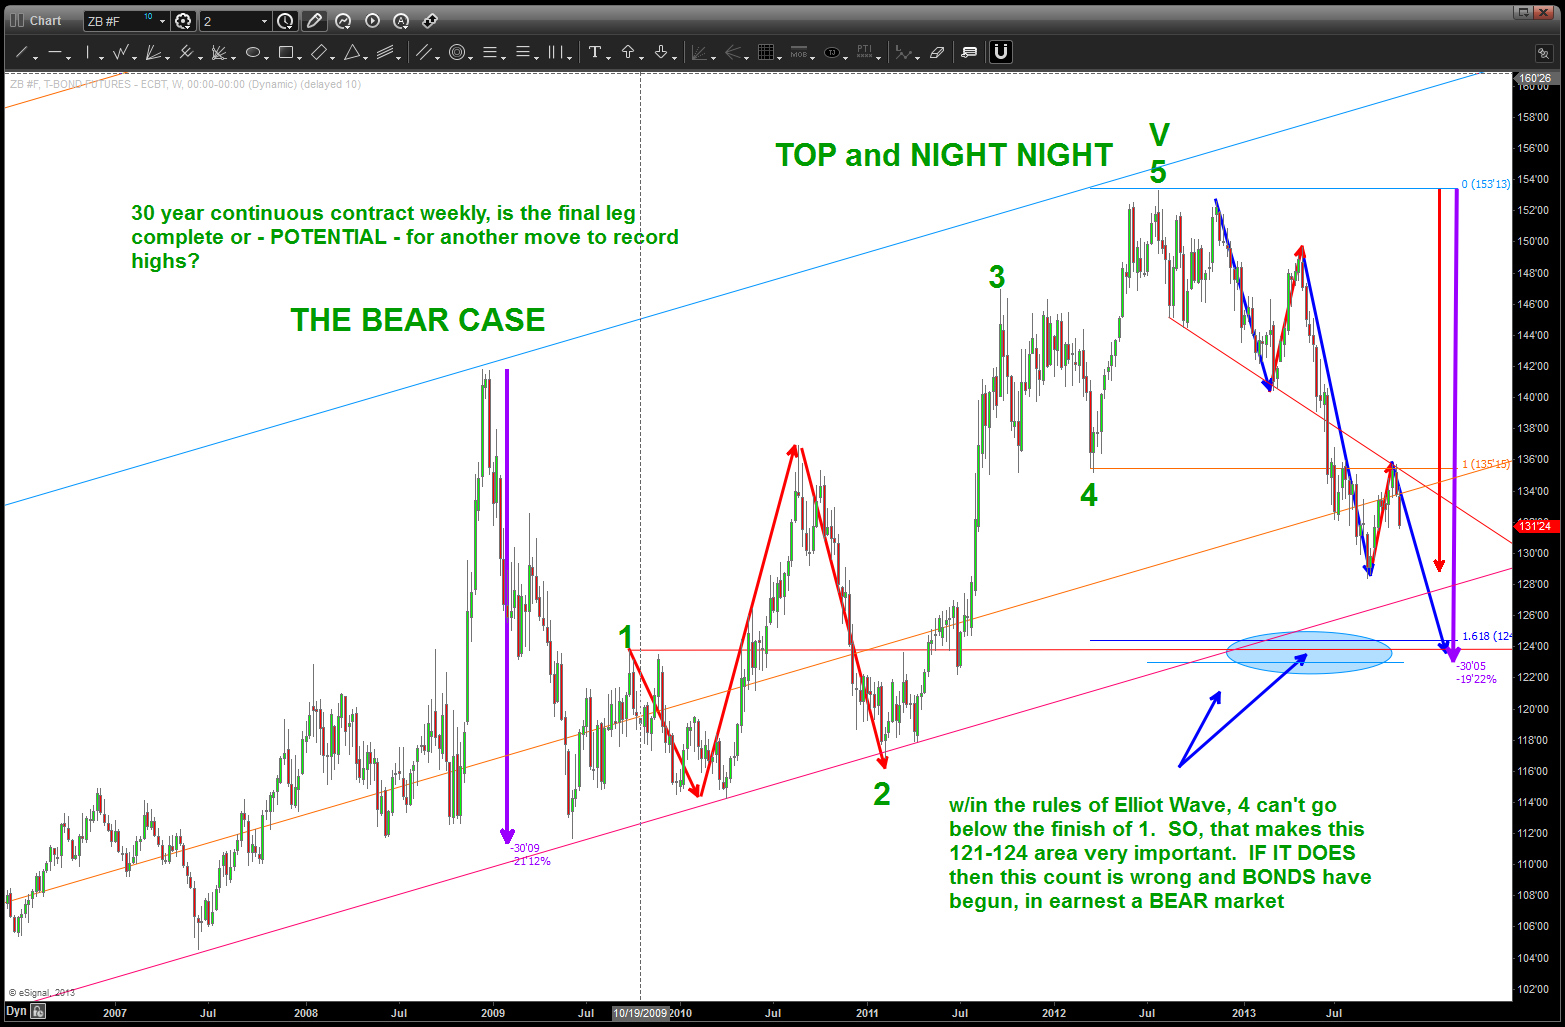
Long Bond w/ a modified count to show the all time high

Pingback: Thelma and Louis and Fixed Income | Bart's Charts