the “new normal” in Fixed Income …? Ugh …
Posted on June 18, 2016 Leave a Comment
the balance, form and proportion of the TLT, Long Bond 3 drives to a to “was” as good as it gets … but, patterns work and patterns fail, right?
I’m not sure what the “new normal” touted by Fed Chairman Yellen means .. just yet. But, PATTERNS and basic technical are showing an increasing rate environment.
so, if at first you don’t succeed try try again? ugh ….
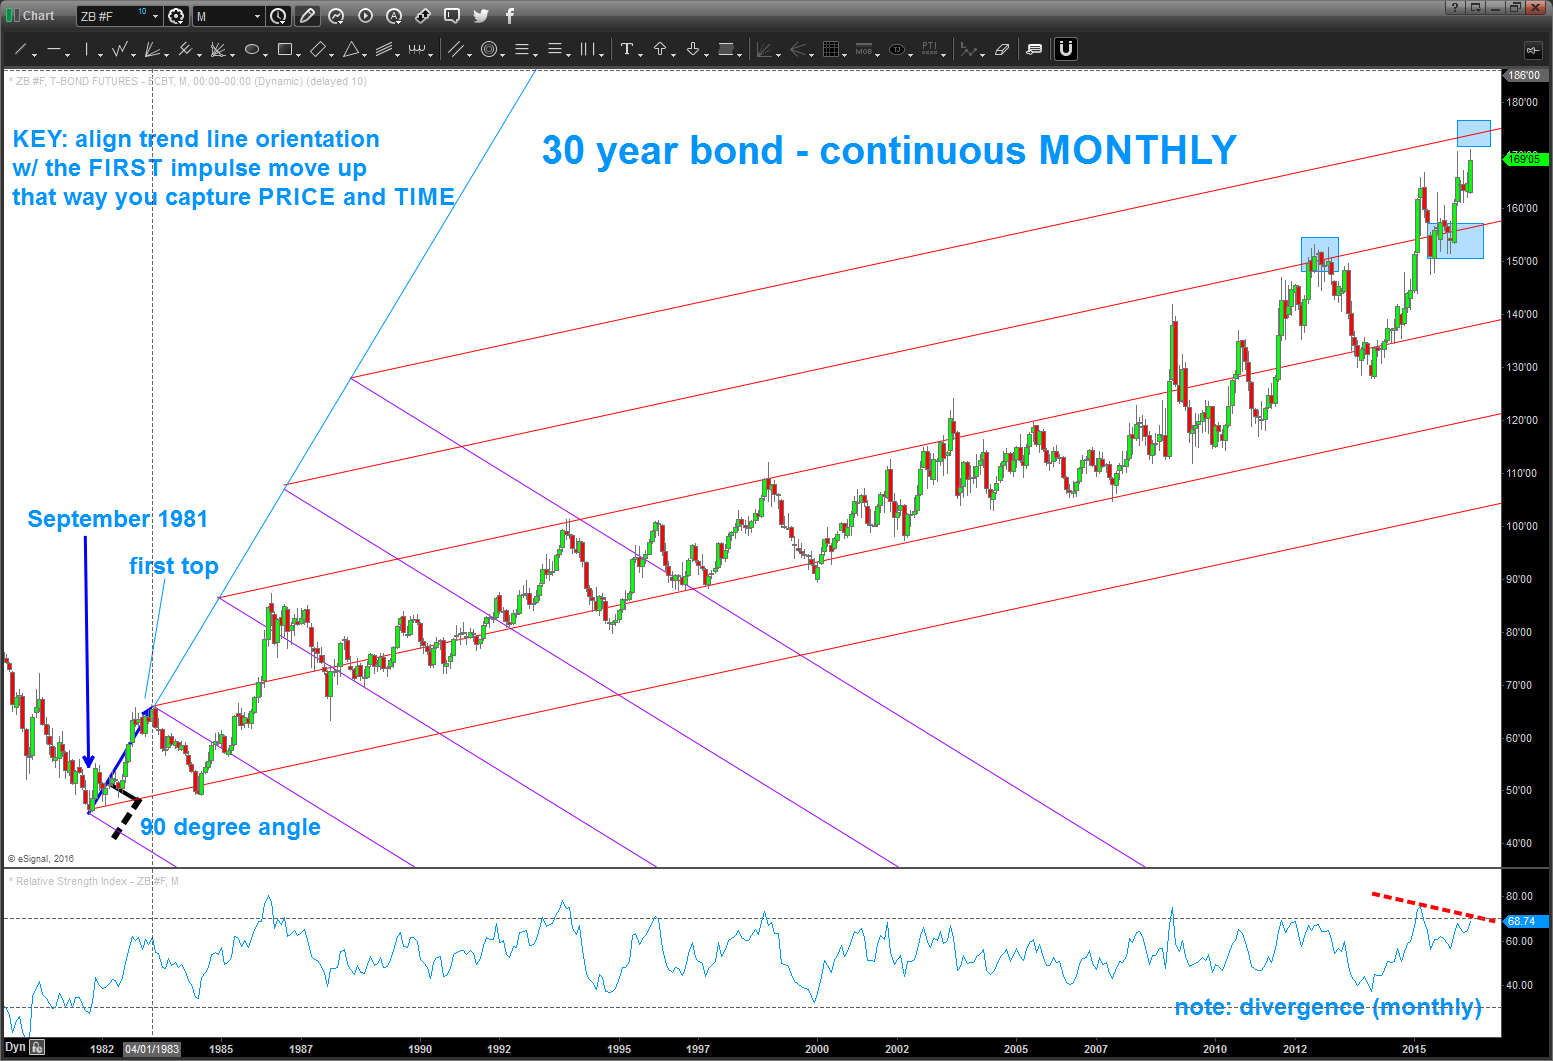
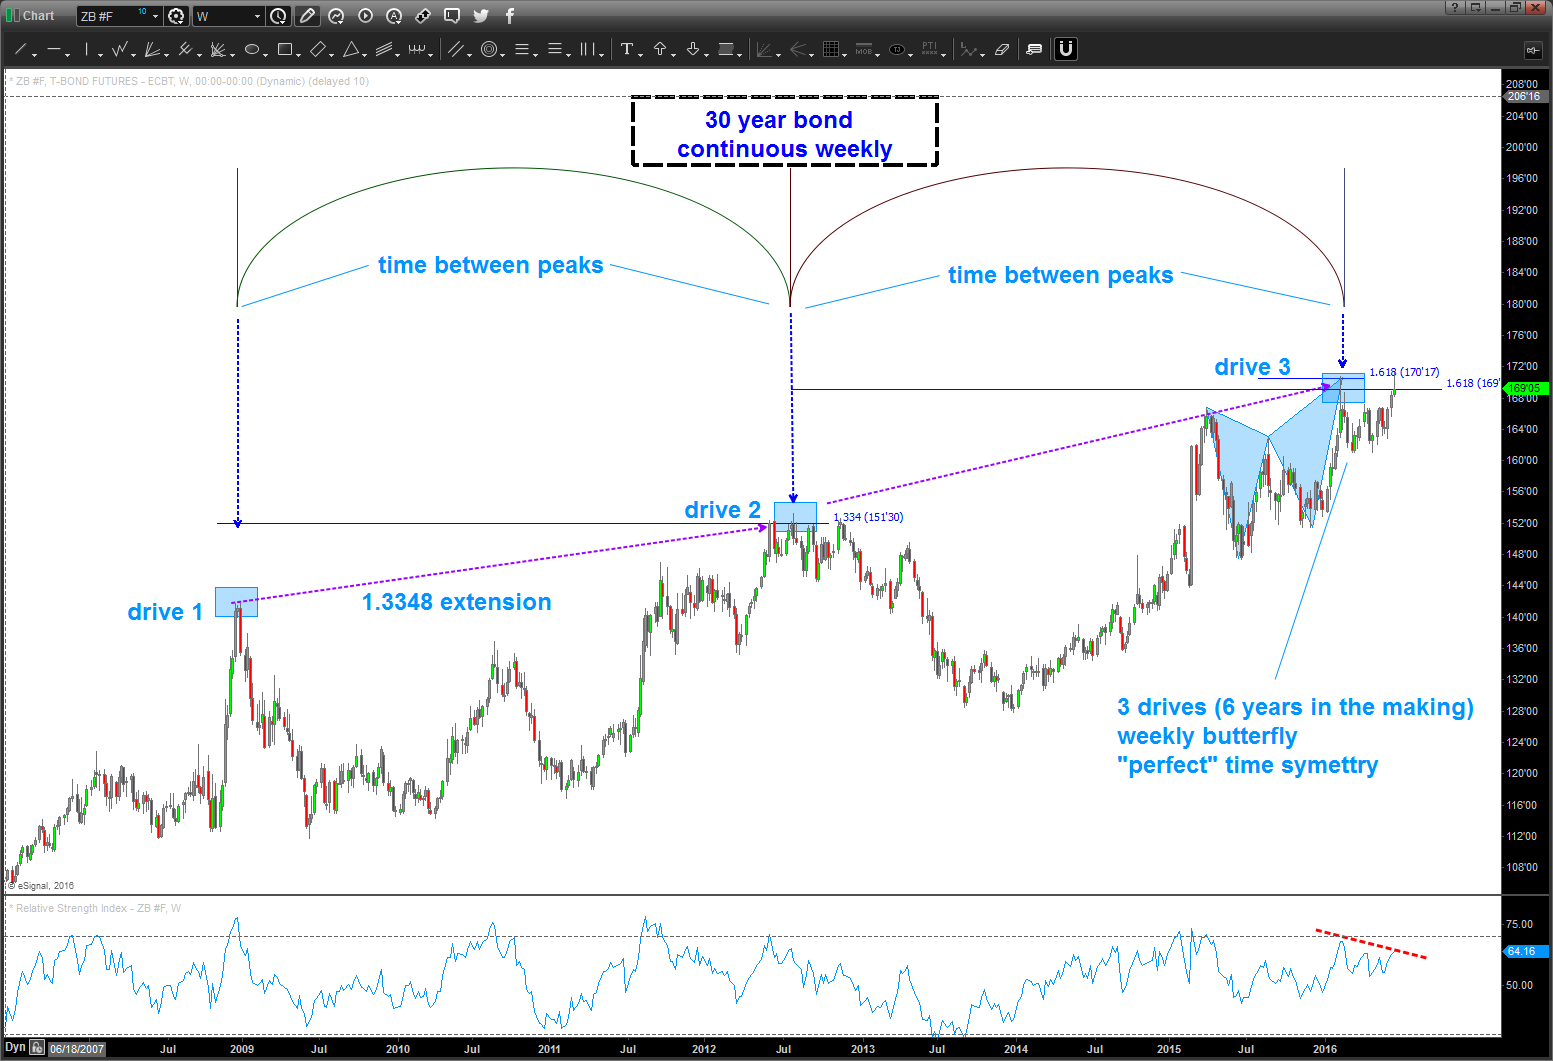
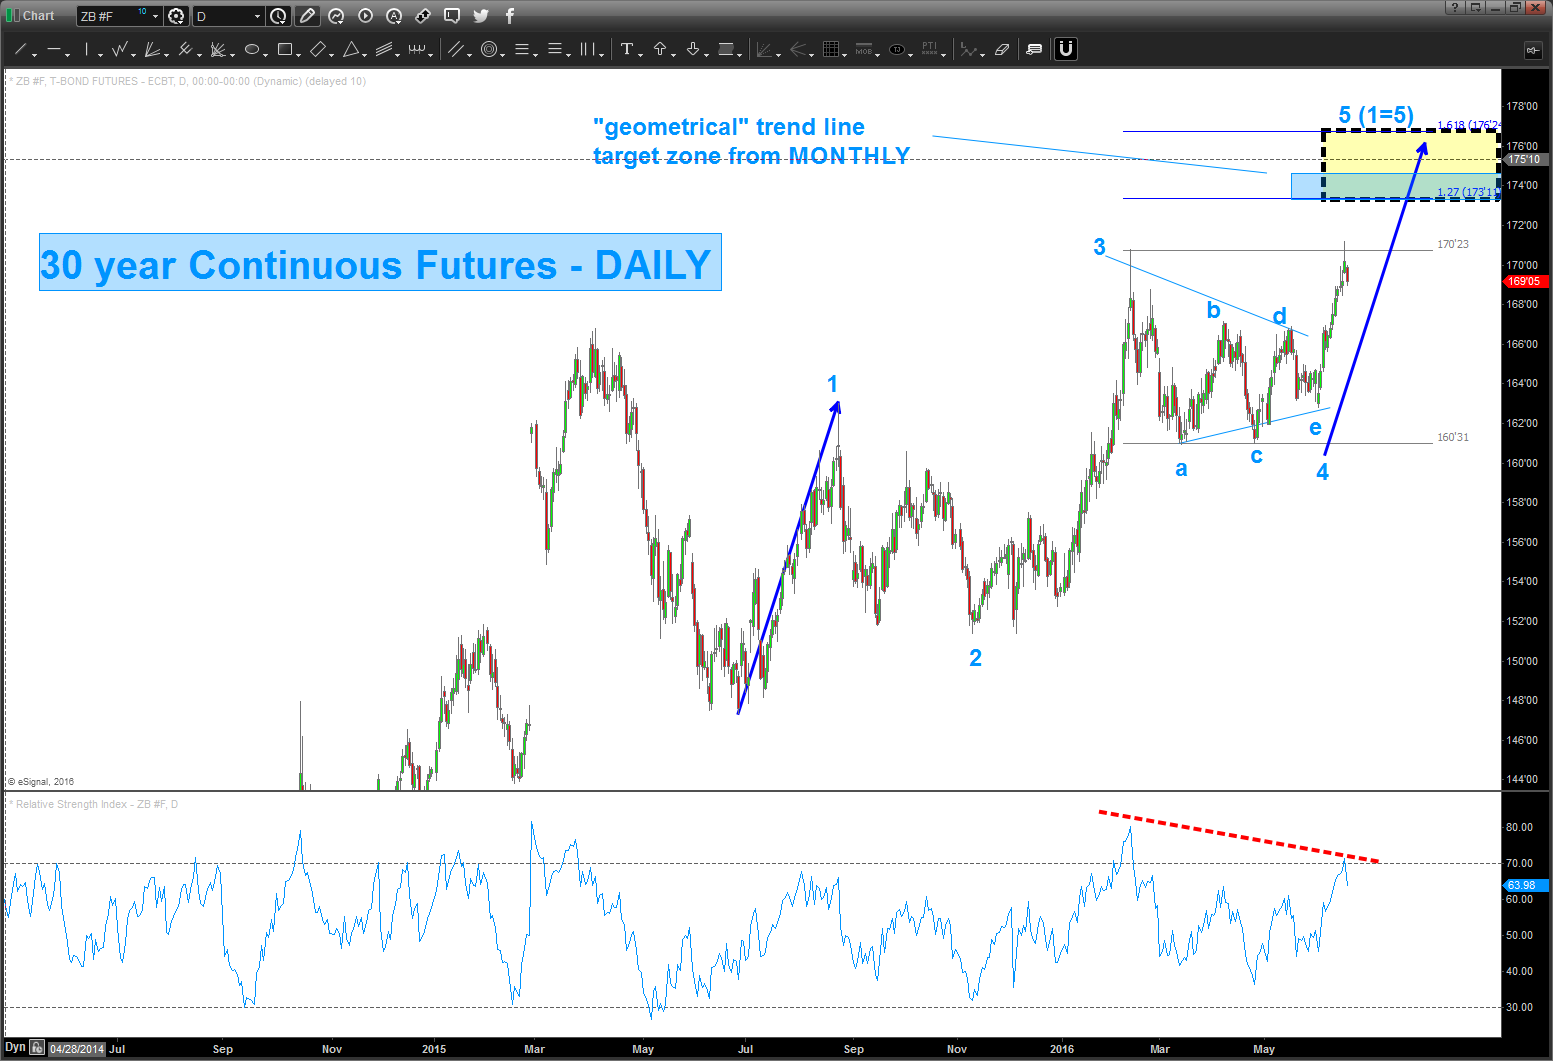
here’s a monthly, weekly. daily snapshot of the long bond this weekend:
- bullish sentiment is off the charts
- divergences on all three time frames
- Monthly – when drawing trendlines try to shift the orientation to the first move up .. that way you will incorporate PRICE and TIME. From there just simply draw a 90 degree angle. once done, as you can see, you have all of the major trend lines FOR THE LIFE OF THE SECURITY done. we have another key trend line coming in/around 174.
- Weekly – note the PERFECT time and the butterfly and the divergence what was present back a couple months ago. it hit, worked and then got smoked. PATTERNS LIKE THIS DON’T FAIL OFTEN and when they do it’s usually a STRONG MOVE that continues. Hence, higher targets possible…
- Daily – nice little pullback on Friday, but I am going to watch 166 as support. this last move out of triangle is “usually” terminal (a 5th wave) but in the new normal, who the hell knows, right? Also, note the daily divergence present ….
So, here are the charts – sure looks like the next opportunity to get short bonds is in/around 173-176 on long bond continuous. watch corresponding levels for TLT as posted earlier.
have a GREAT weekend.
Bart
TLT update …
Posted on June 16, 2016 Leave a Comment
folks, sometimes the pattern works and sometimes they don’t … the PATTERN failed today as shown.
sure looks like 145-146 isn’t out of the question.
ugh …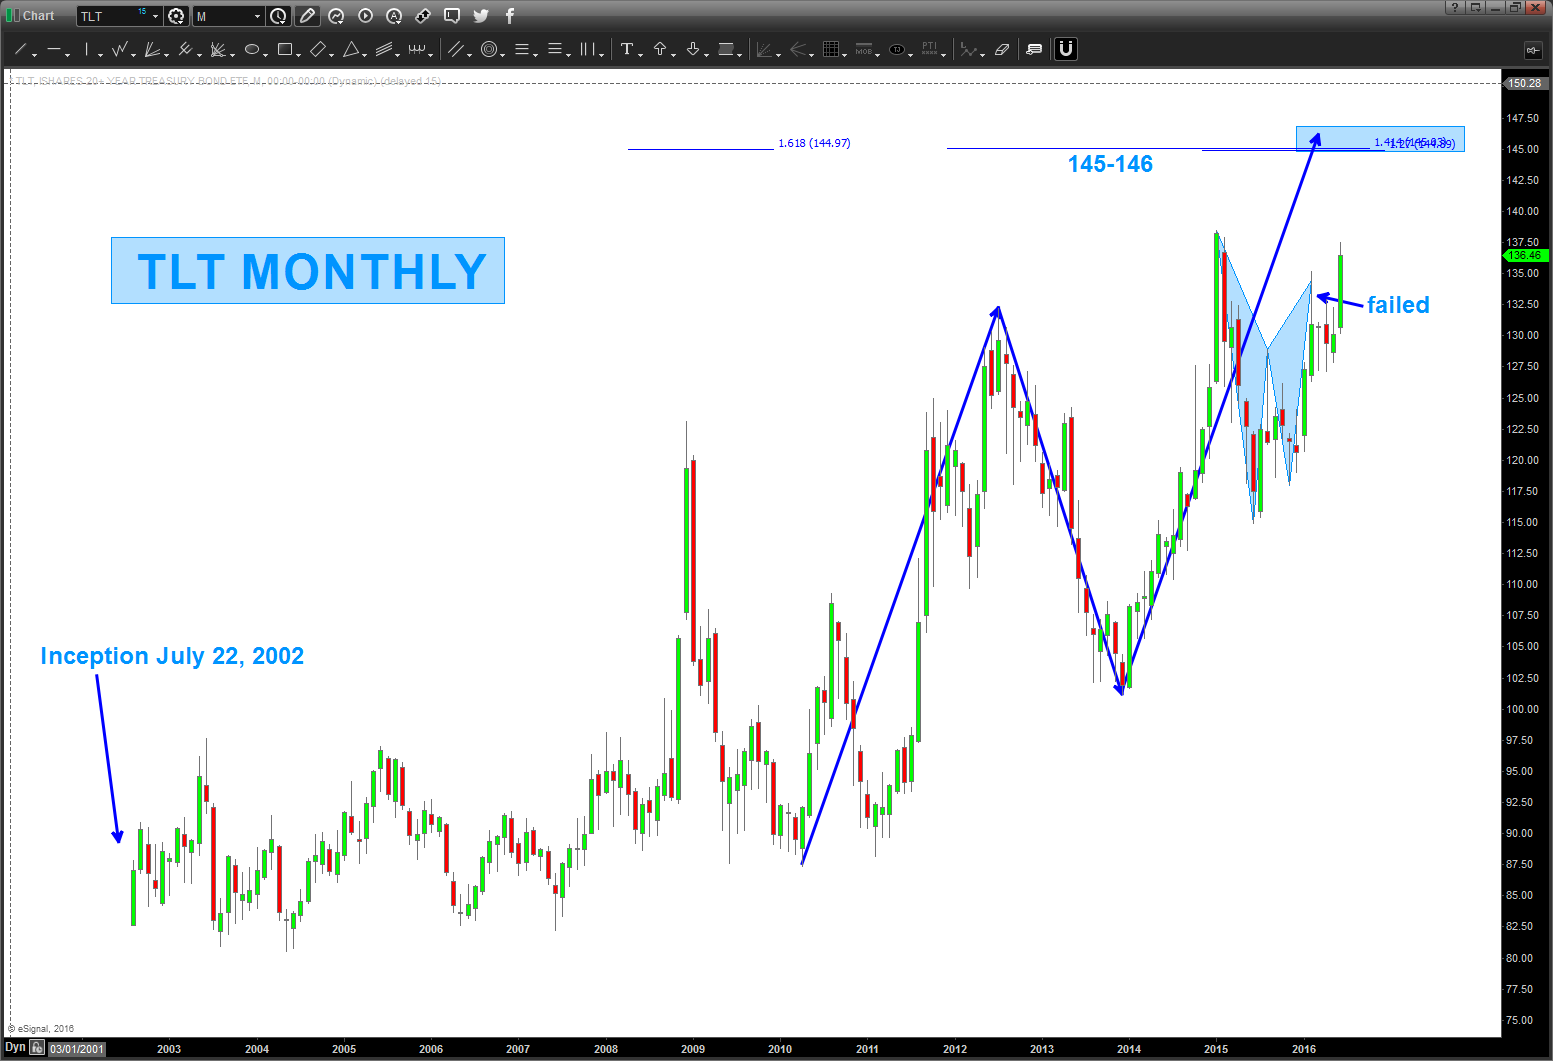
Linked-In and Math …
Posted on June 14, 2016 Leave a Comment
Folks, couple disclaimers before I start this blog:
- if you’ve been following me OR your new, you’ll know that I don’t make it a habit of doing the “could have would have should have.” Most of my posts (a majority) are real time – long before price ever gets to the targeted area or pattern
- I did a posts on $LNKD almost two years ago. Here’s the posts:
- https://bartscharts.com/2013/09/07/missing-a-lnkd-in-the-chain/
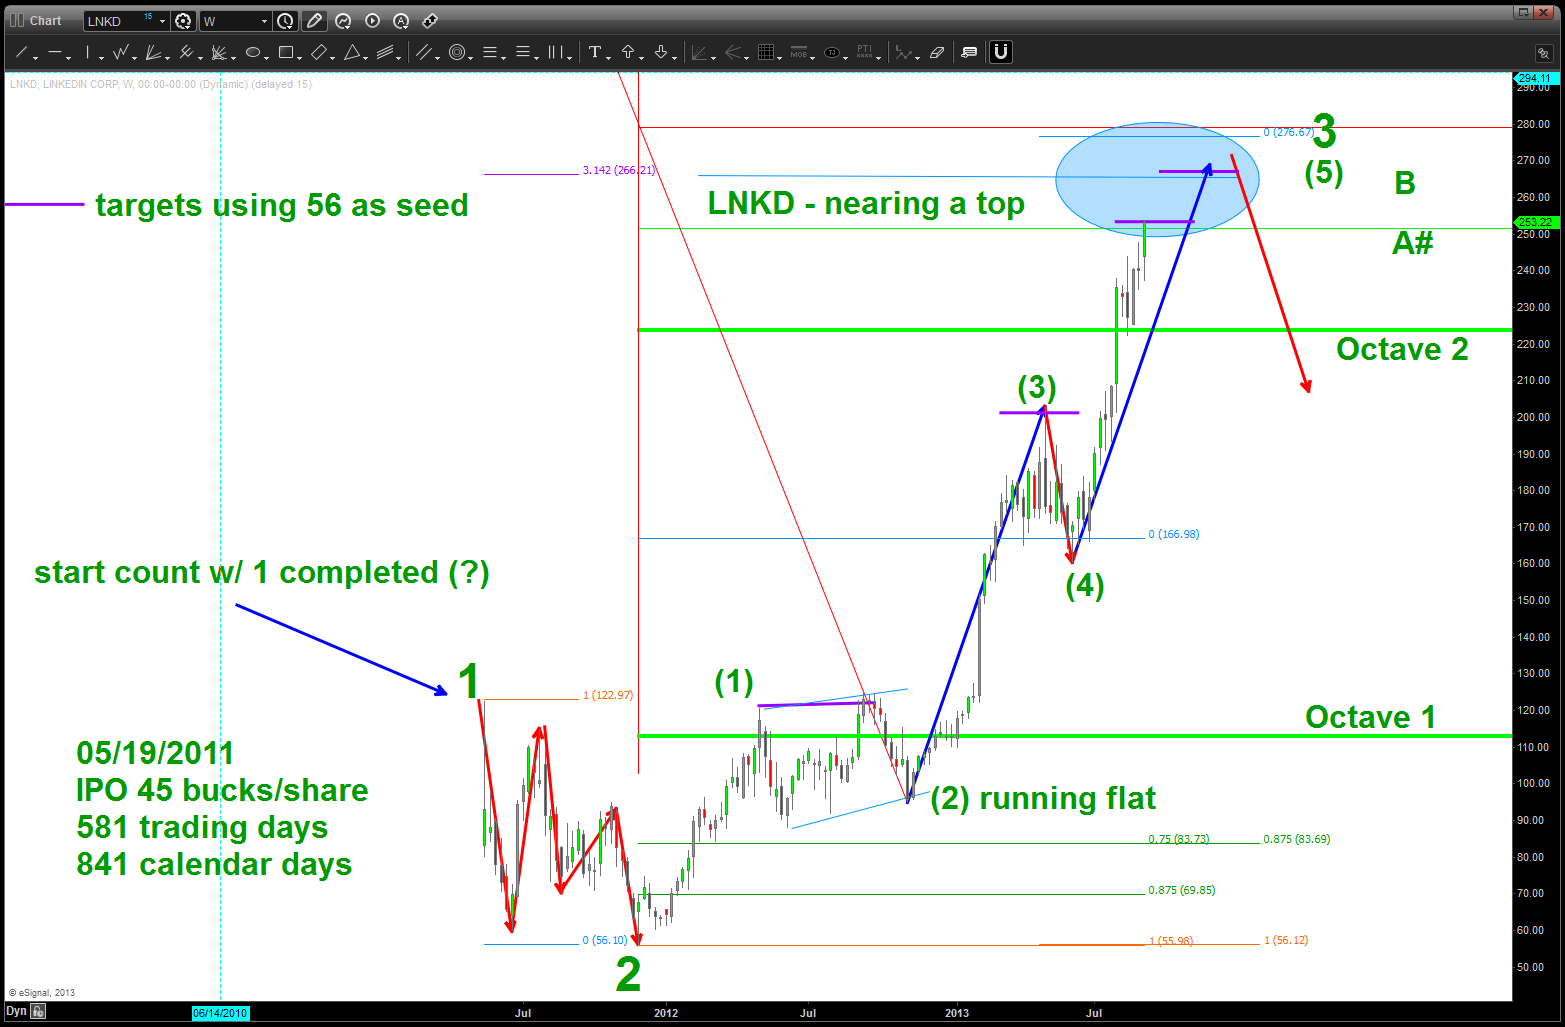
- this was as we approached the 250 area and notice I was seeing this as a 3 topping – which meant another high. I’ll post the chart below in a bit but pay attention the NUMBERS.
- https://bartscharts.com/2013/09/07/missing-a-lnkd-in-the-chain/
- https://bartscharts.com/2014/02/01/missing-lnkd-in-the-chain-updated-from-september-2013/
- hit the target area (but not all of the numbers) and started to correct
- https://bartscharts.com/2014/04/28/about-that-lnkd-chart-from-sept-2013/
- a “wave 4 correction” was in process and using geometry alone recommended a BUY at the.618. Here’s the chart:
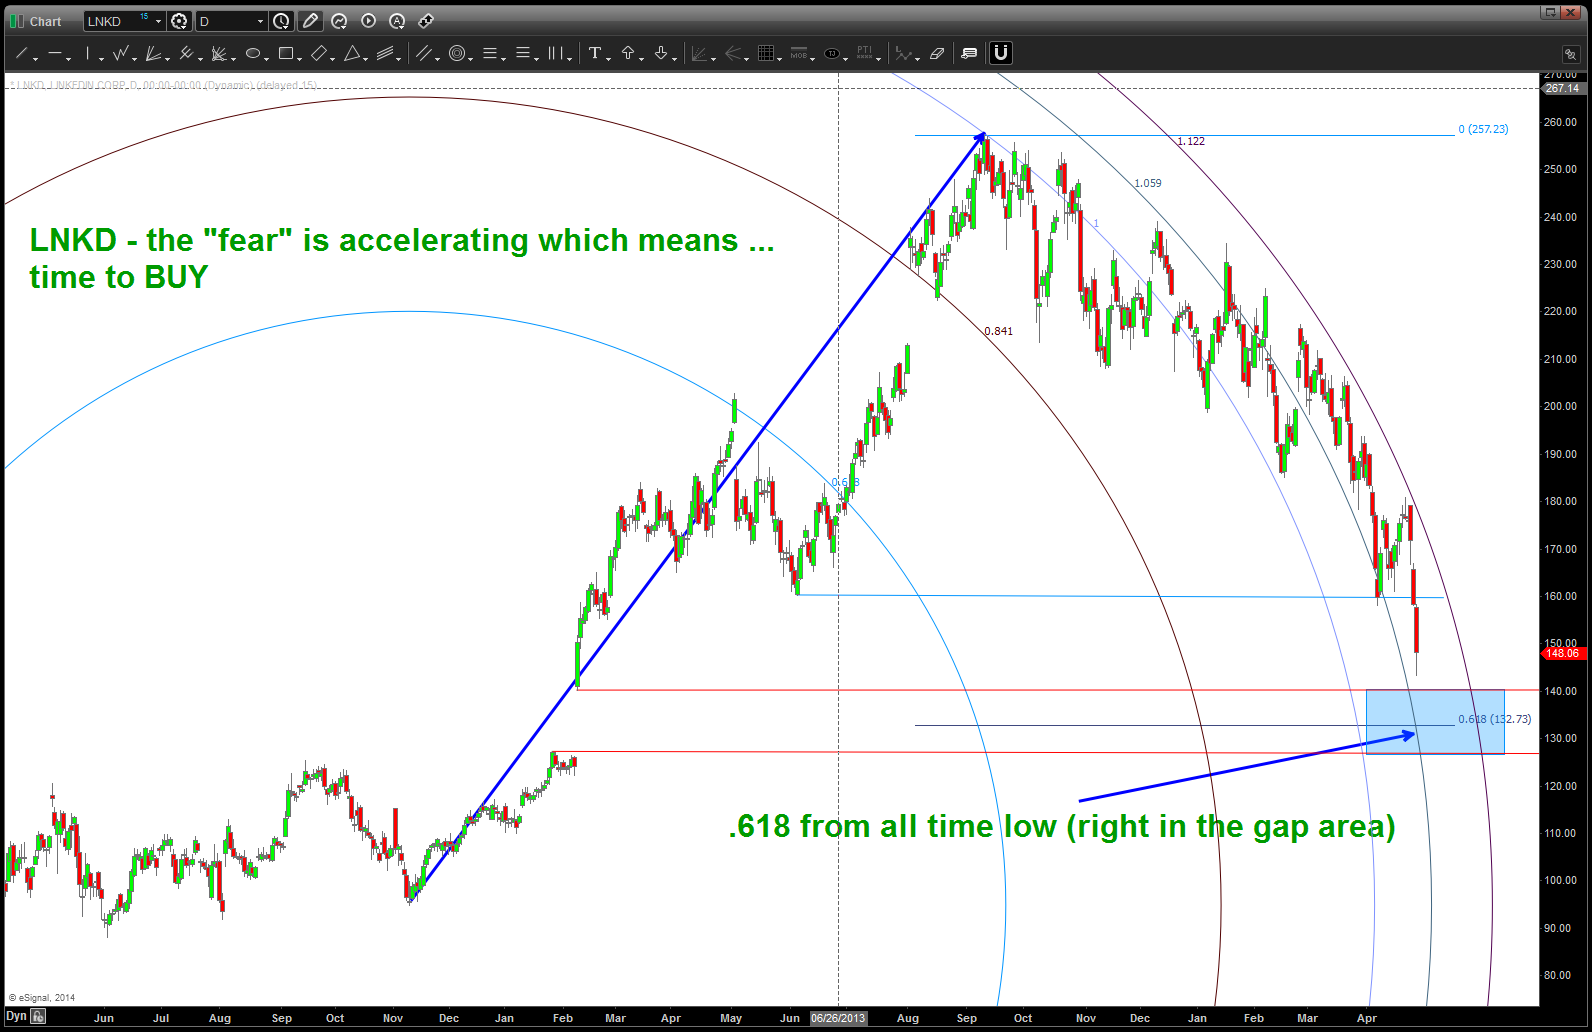
So, until the acquisition by MSFT was announced yesterday, I had forgotten about it. (I trade/focus on spot FX and like to look at stocks for friends and when asked).
Looks like the BUY worked great and we went up to a new high and hit exactly at the target using the signal reversal candle from the all time low. Michael Jenkins (a mentor and friend at http://www.stockcyclesforecast.com) taught me this technique. It’s pretty darn accurate and HAS NOTHING TO DO WITH THE FUNDAMENTALS. Here’s the chart:
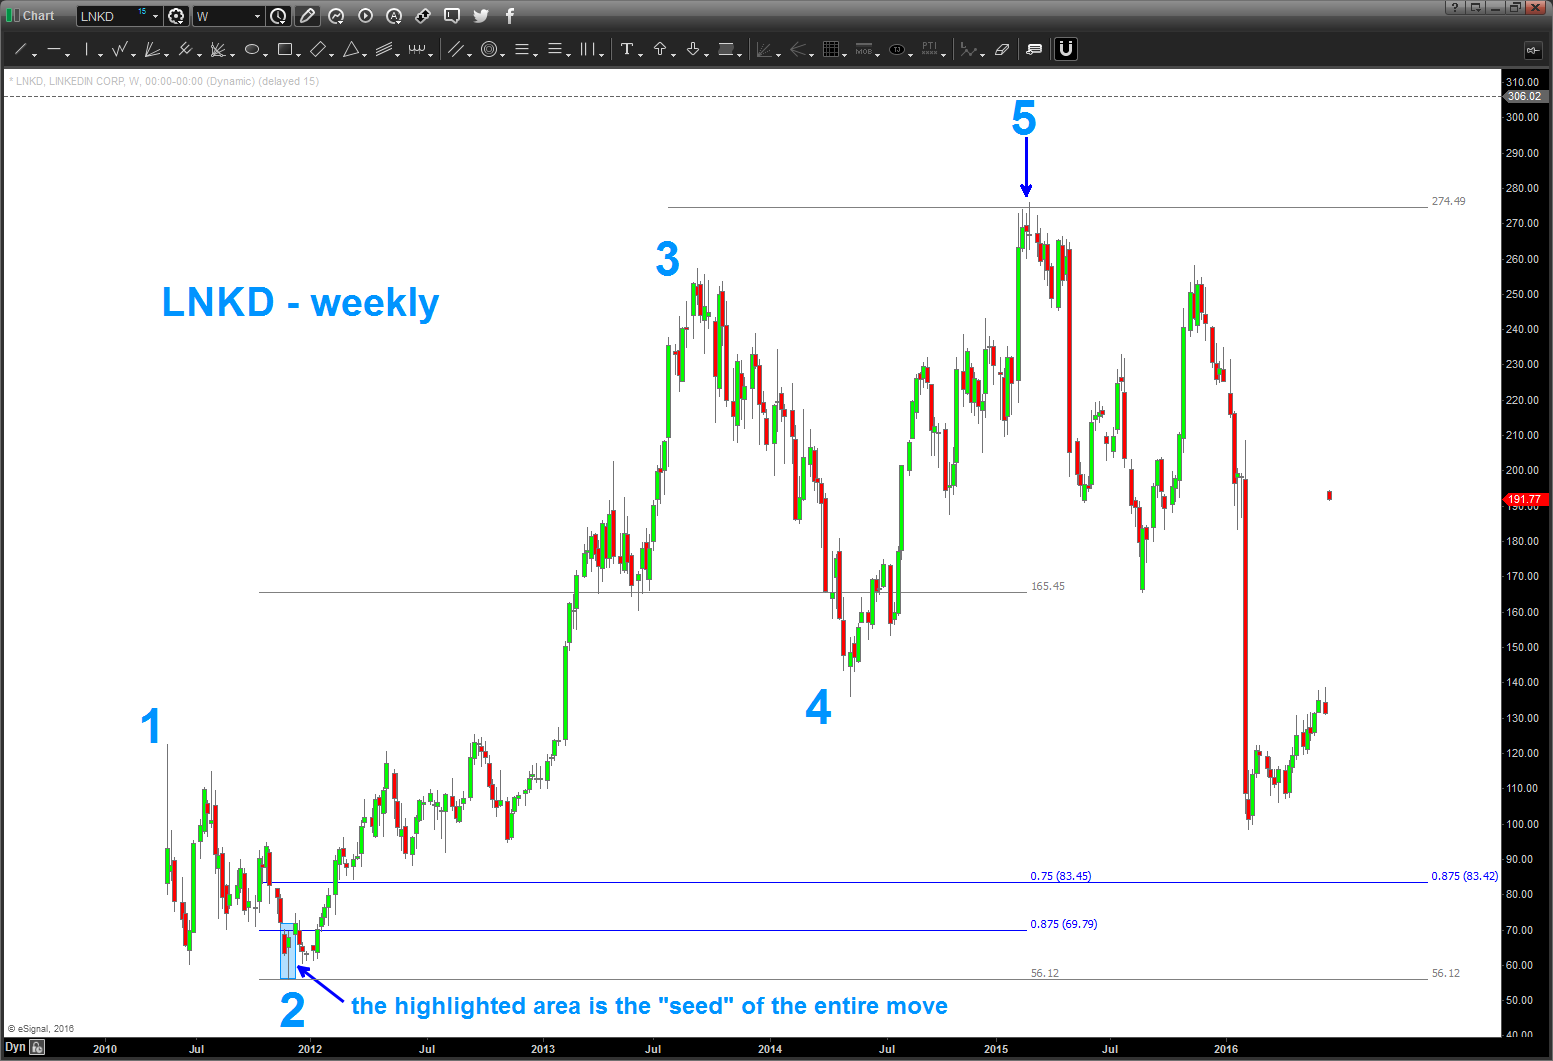
I know, you won’t believe (should you?) it’s basis is the zodiac, solstices, music, the great pyramid (which is proven to actually have 8 sides). If you’ll allow me to expand you’ll find that one single weekly candle contains the “DNA” of the upcoming move. EVERYTHING is based on that. In this case we used 1/8 increments of the LENGTH of that candle to project UP (long before price ever got there). When the “first” projection is done, then we simply double it and do another one …. note, when it went thru the first, it came back down and kissed it and took off. Key here ..the EXACT high was determined by the DNA candle highlighted in the chart above.
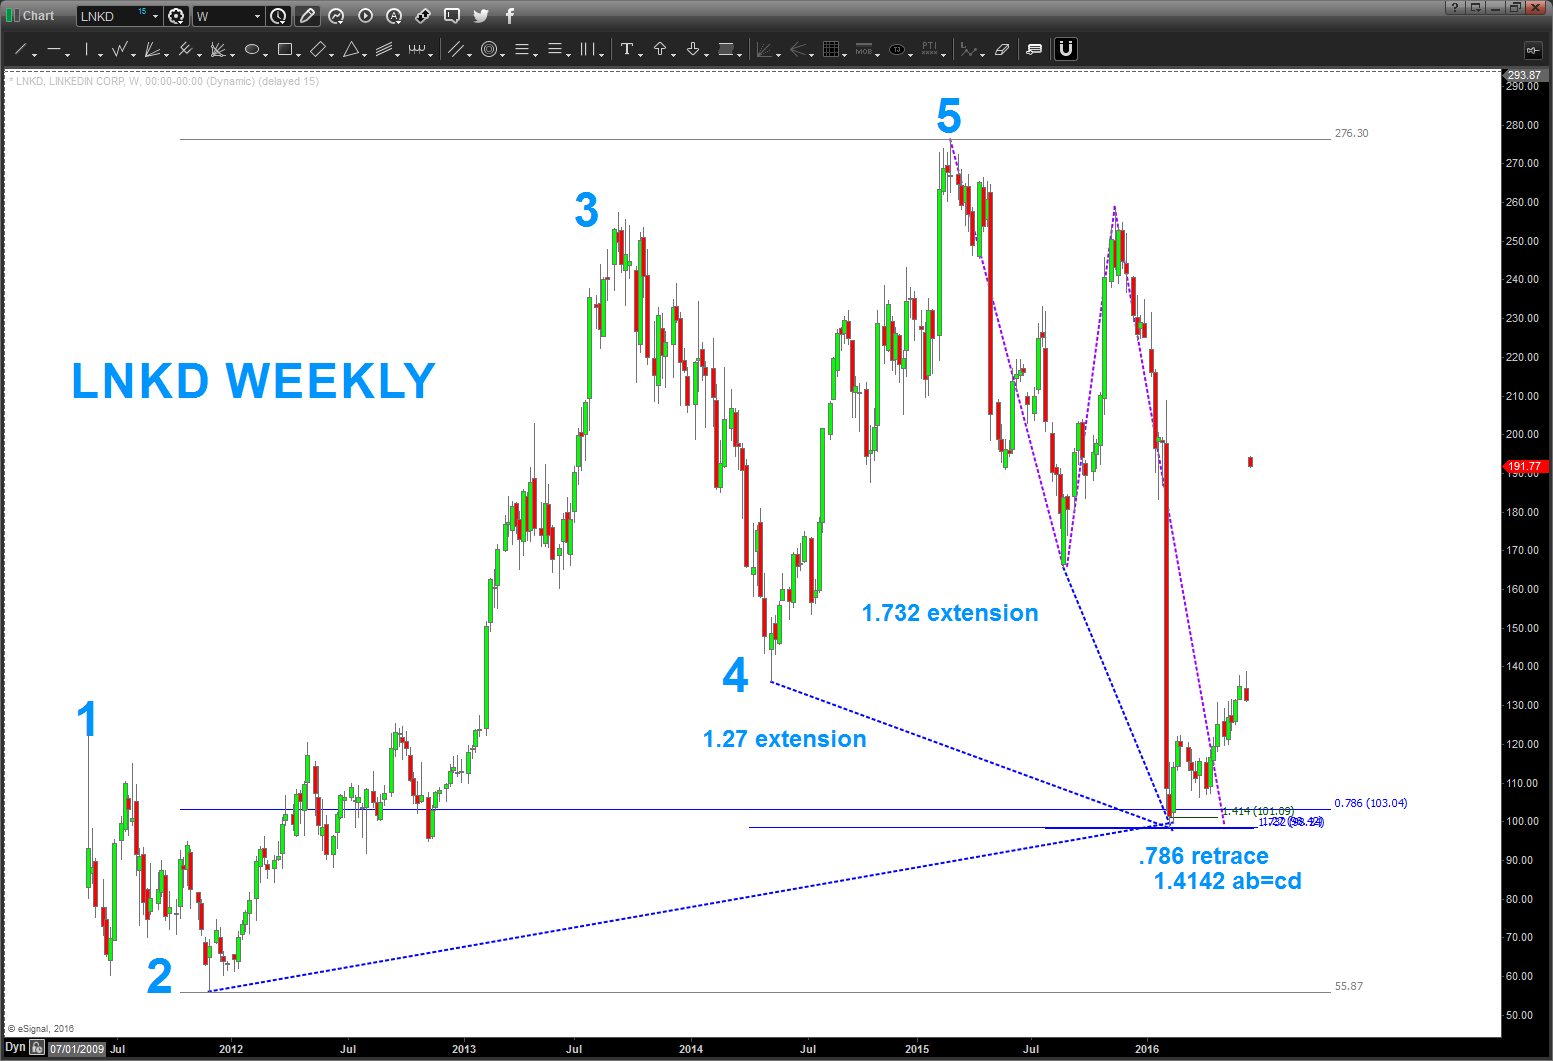
Now, I’m in the “could have would have” area but I just wanted to go over the numbers because its a good discipline and also reinforces the “pattern recognition” capability …
Here’s why the low came in where it did … all the numbers are based on sacred geometry and music:
so, at 23.6 BILLION purchase price it gapped up big (and why wouldn’t it) Well, guess what, it gapped up right in line w/ as it always had … a blue dashed measured move:
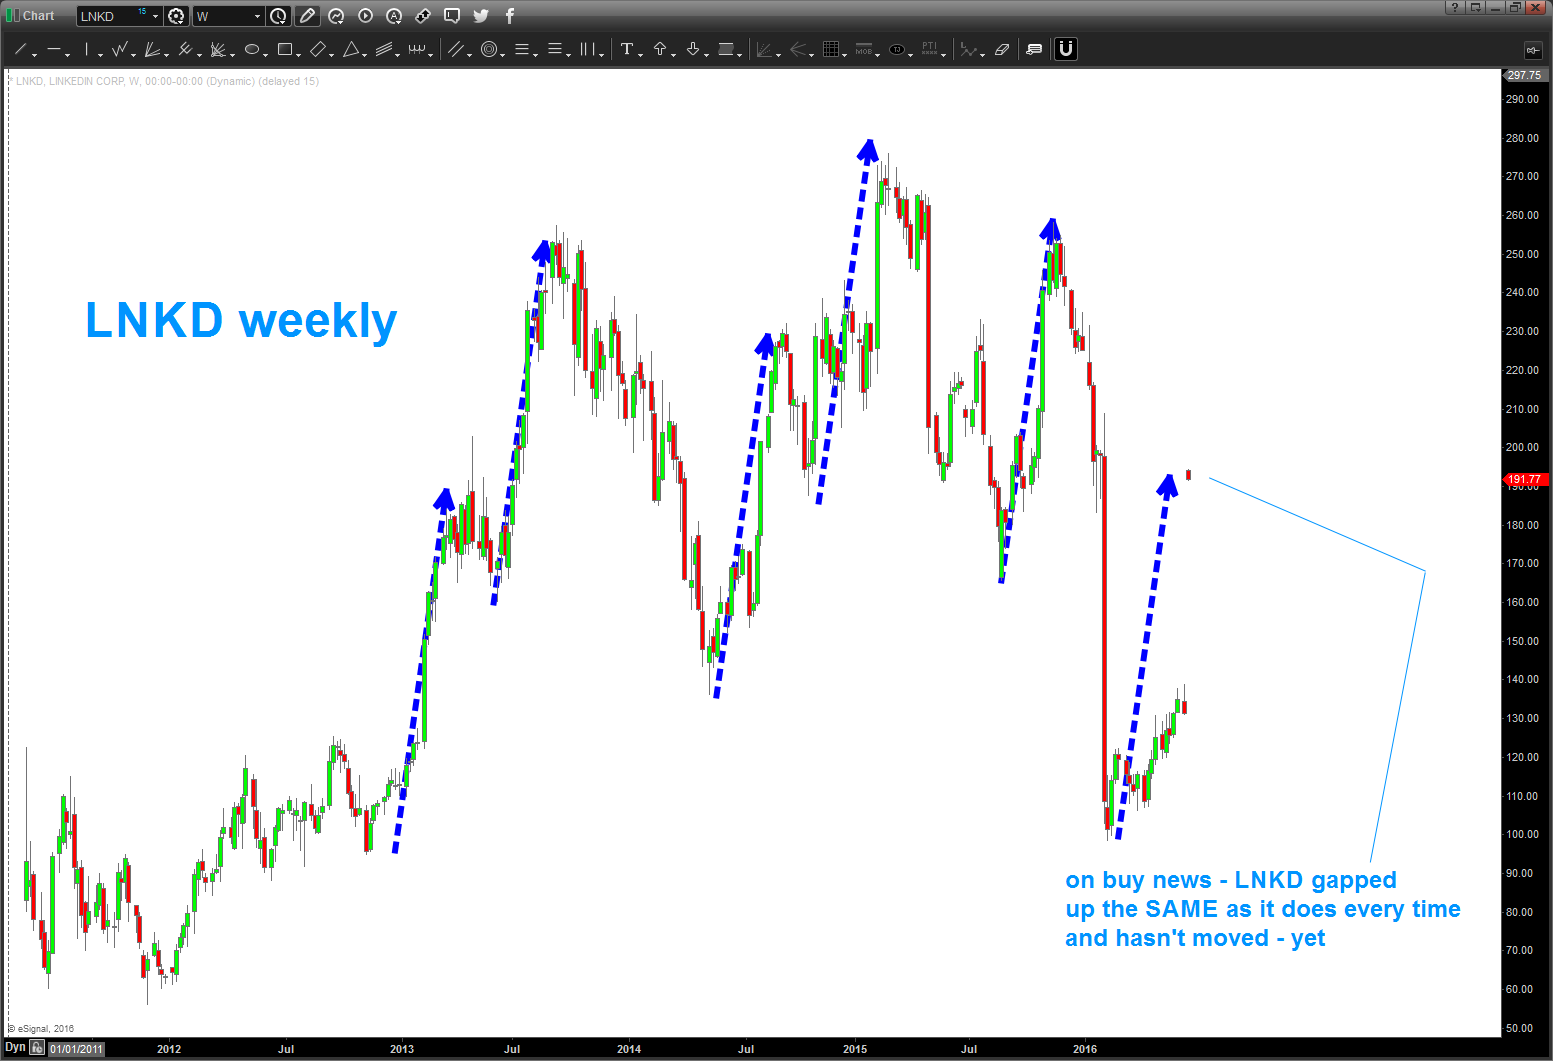
so, where are we now? Kind of in no mans land, if you ask me. EVERYTHING has been pretty spot on and the MOVE UP was amazing. I’ll simply wait for the next pattern to try a BUY or a SELL. Because, in the end, I really don’t know OR care for that matter which way it goes.
Just wanted to provide some perspective on the patterns and numbers and how I have no idea of the fundamentals of any of this …
Bart
Home Depot Rocketship …. $HD the math stopped it, for now (?)
Posted on June 9, 2016 Leave a Comment
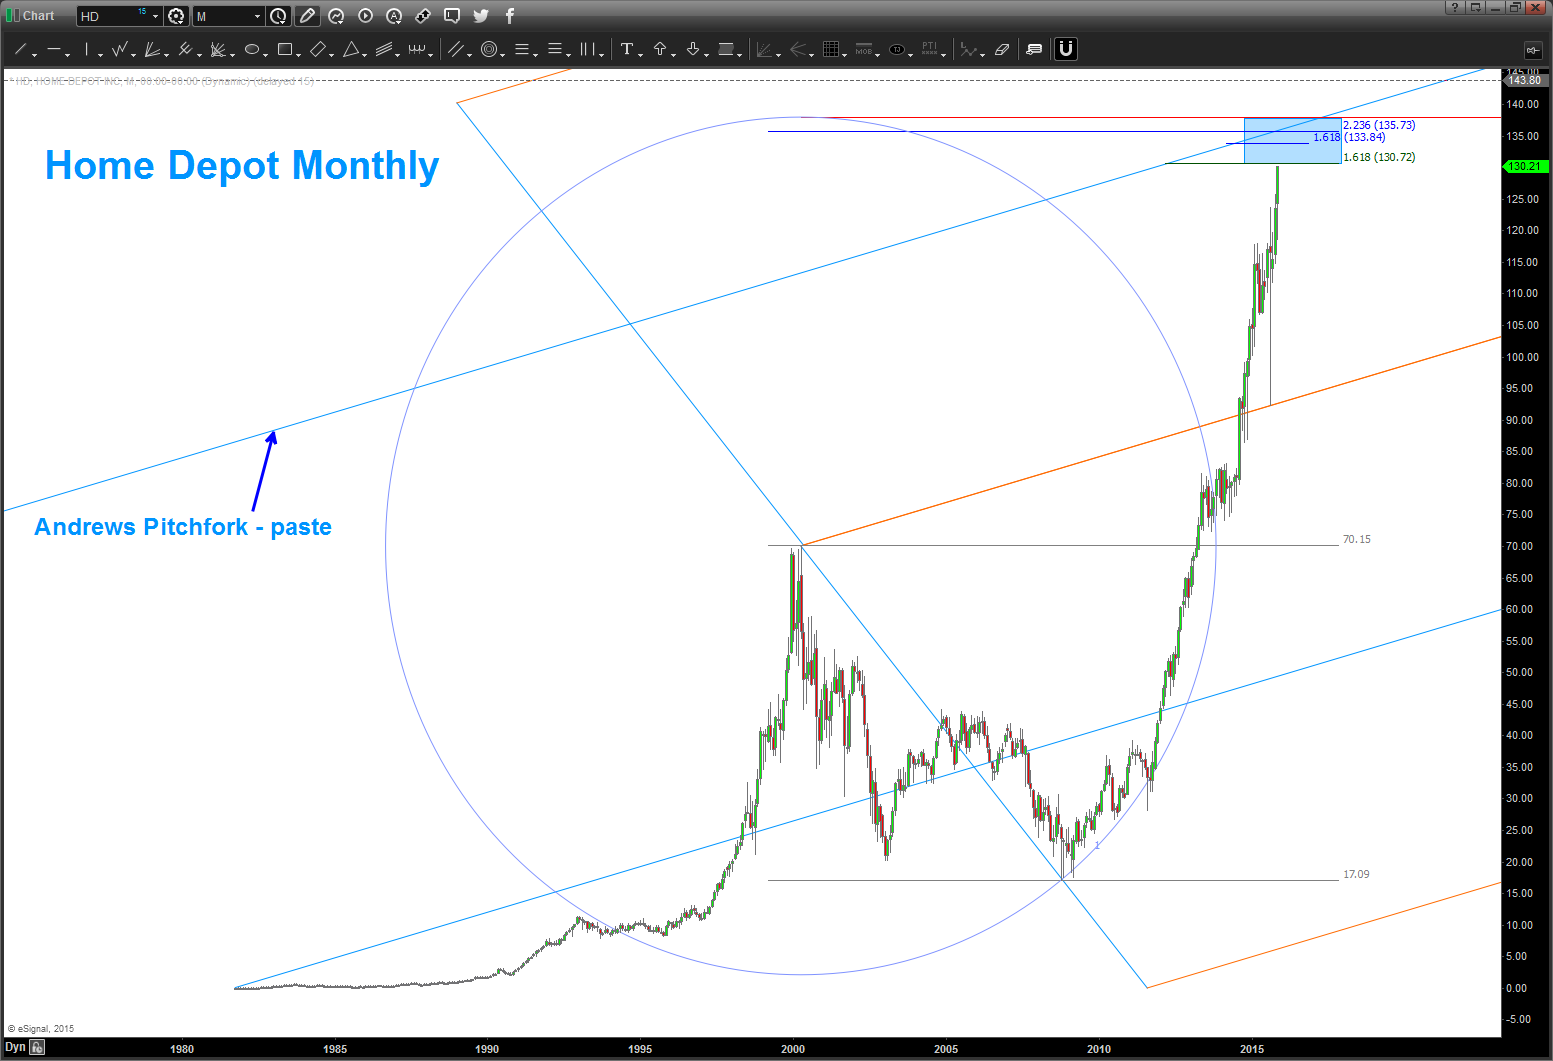
06/09/2016 – so, the top of the circle and the math appears to have worked on targets for HD.
- again, have ZERO idea about the fundamentals
- just drew a circle w/ the radius equal to the biggest corrective move in it’s history
- obtw, the bottom of the circle is support in/around zero price so the top of the circle
- the blue arrows are the “measured moves” of HD throughout it’s history
- the “geometry” of the Adams Pitchfork from the IPO and all time low was simply copy/pasted and the median line stopped the rise in it’s track
learn to use crayons, it’s much easier than reading a 100 page document on HD and it’s fundamental stuff
believe this could be a significant top for HD …
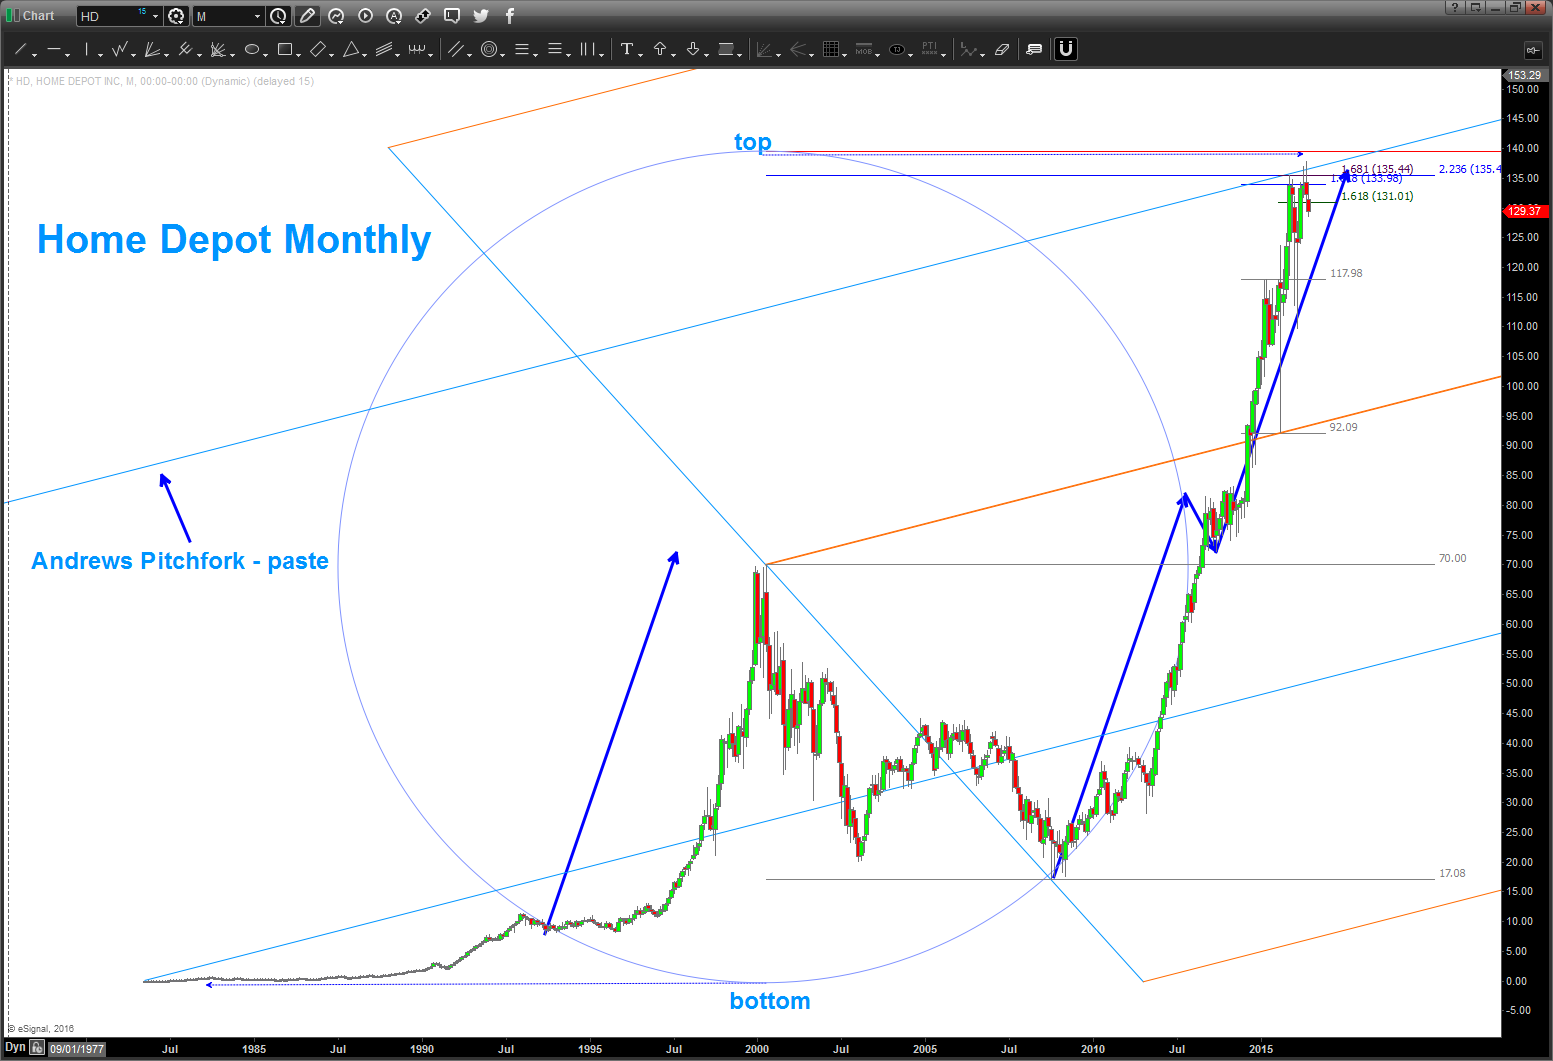
Well, every other pattern level has been defeated so why not the one’s shown below? We have a bunch of math coming in …130-135.
stay tuned.
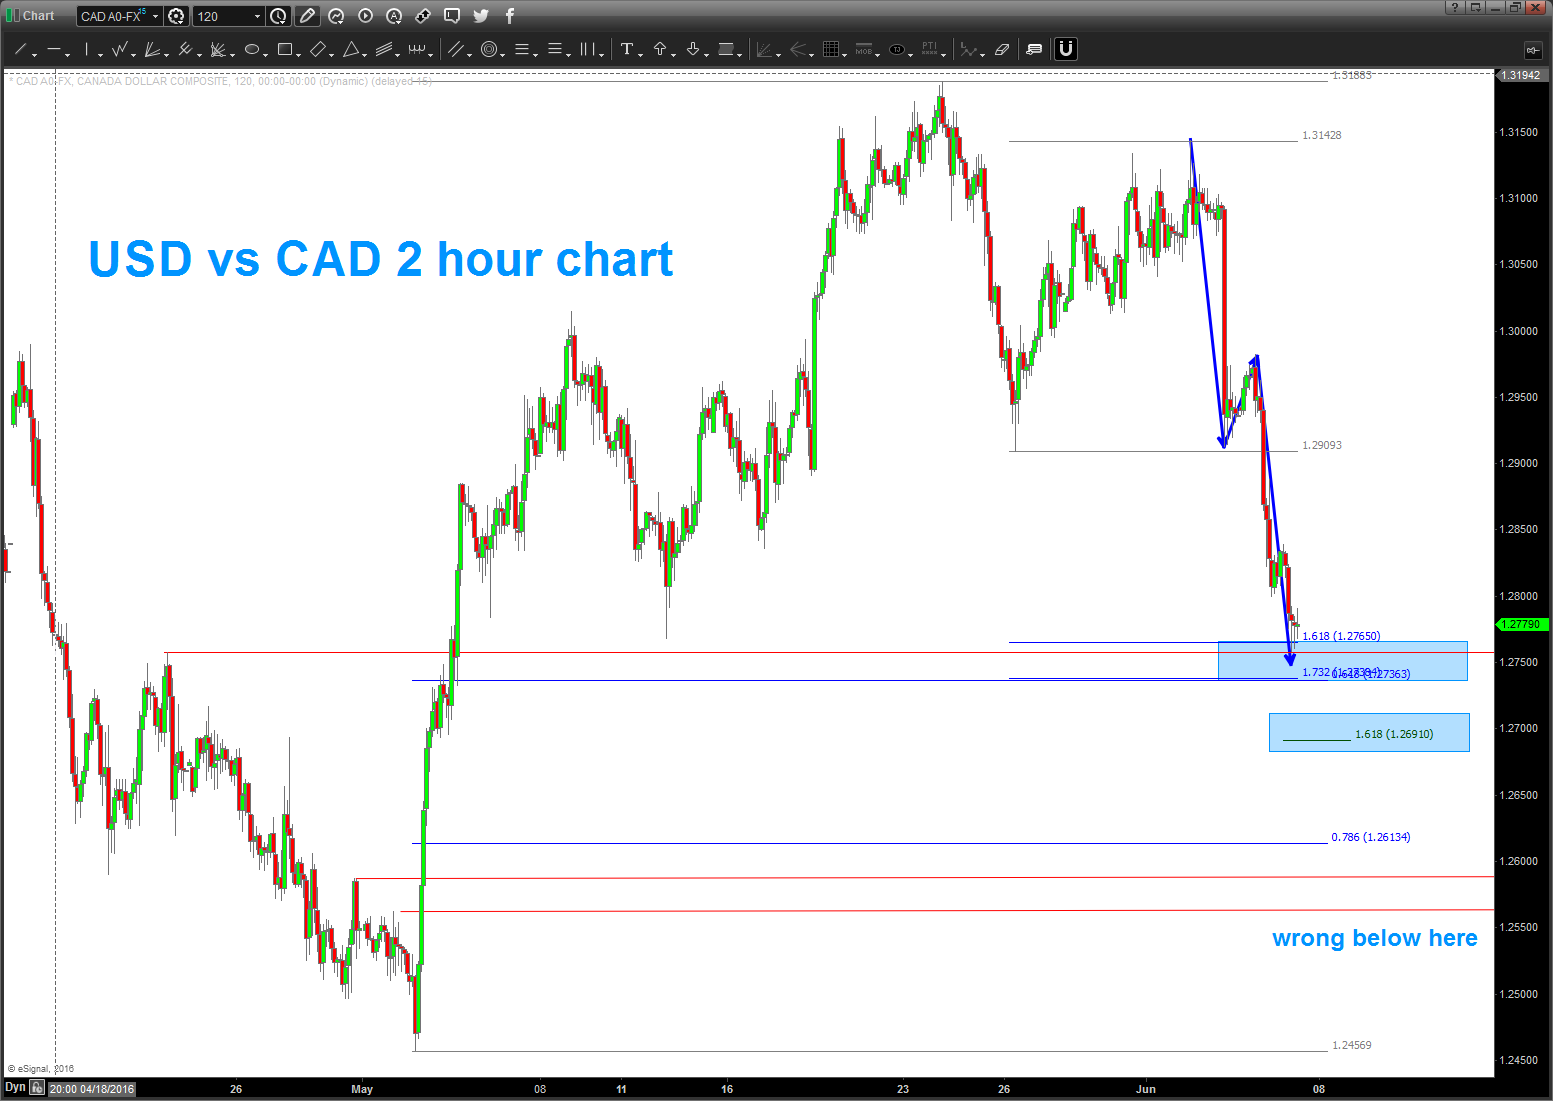
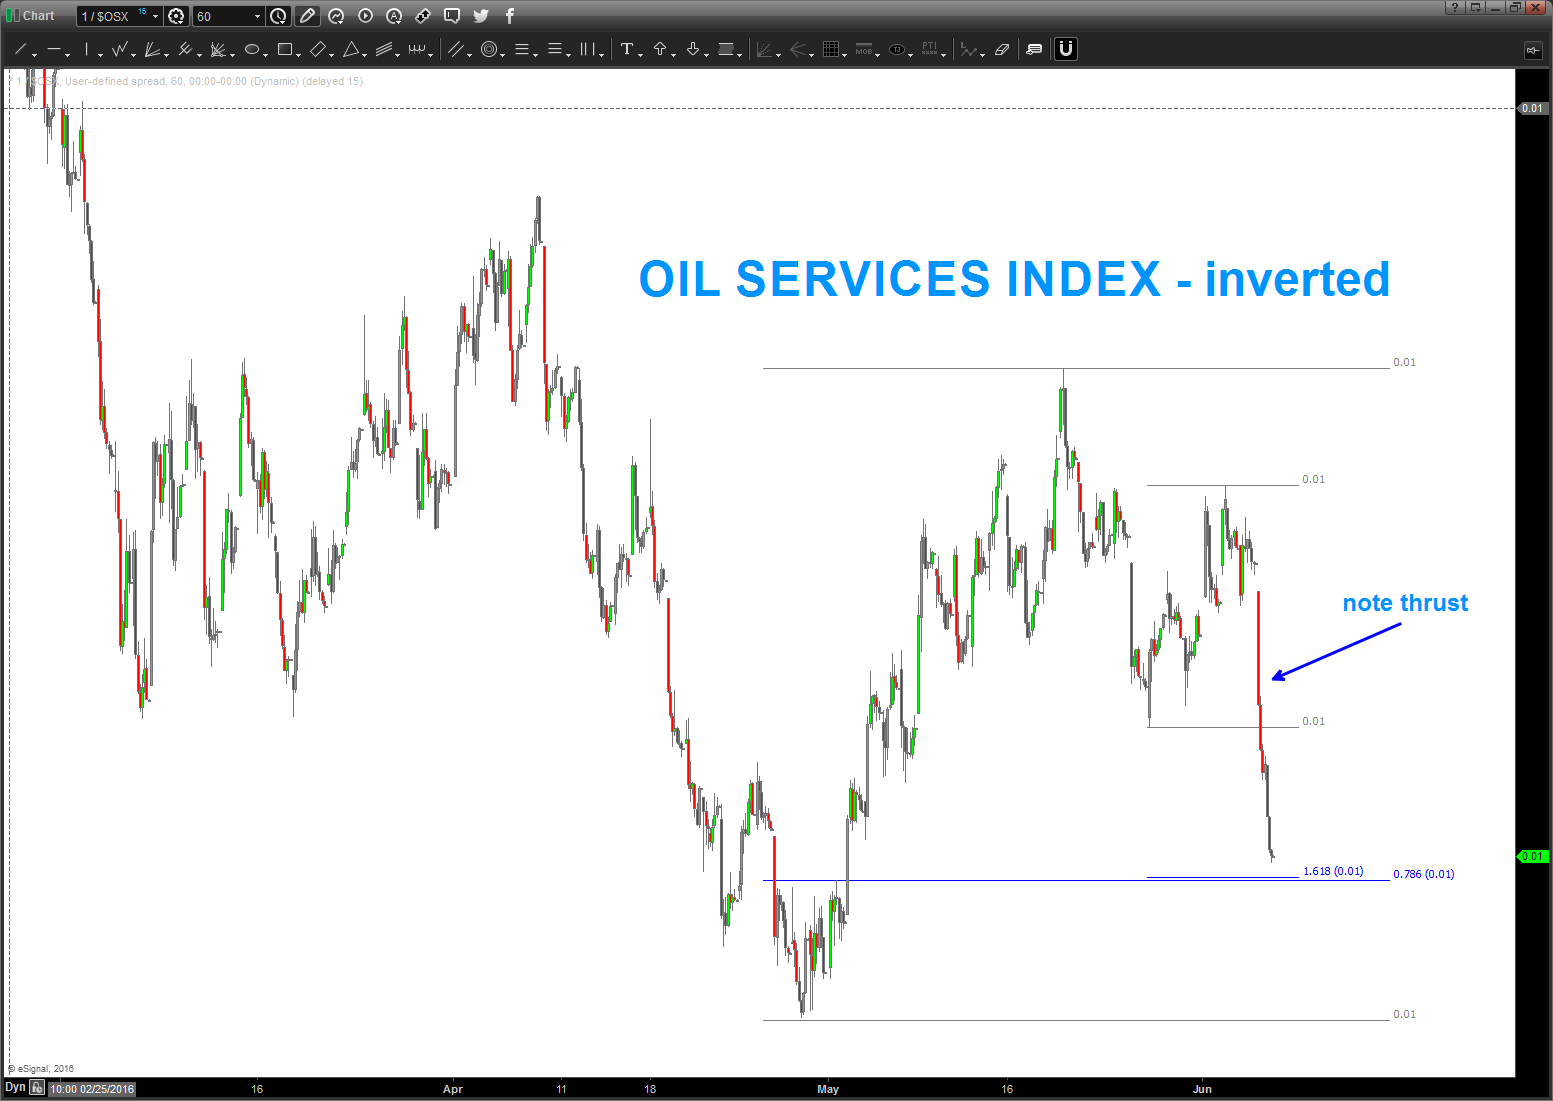
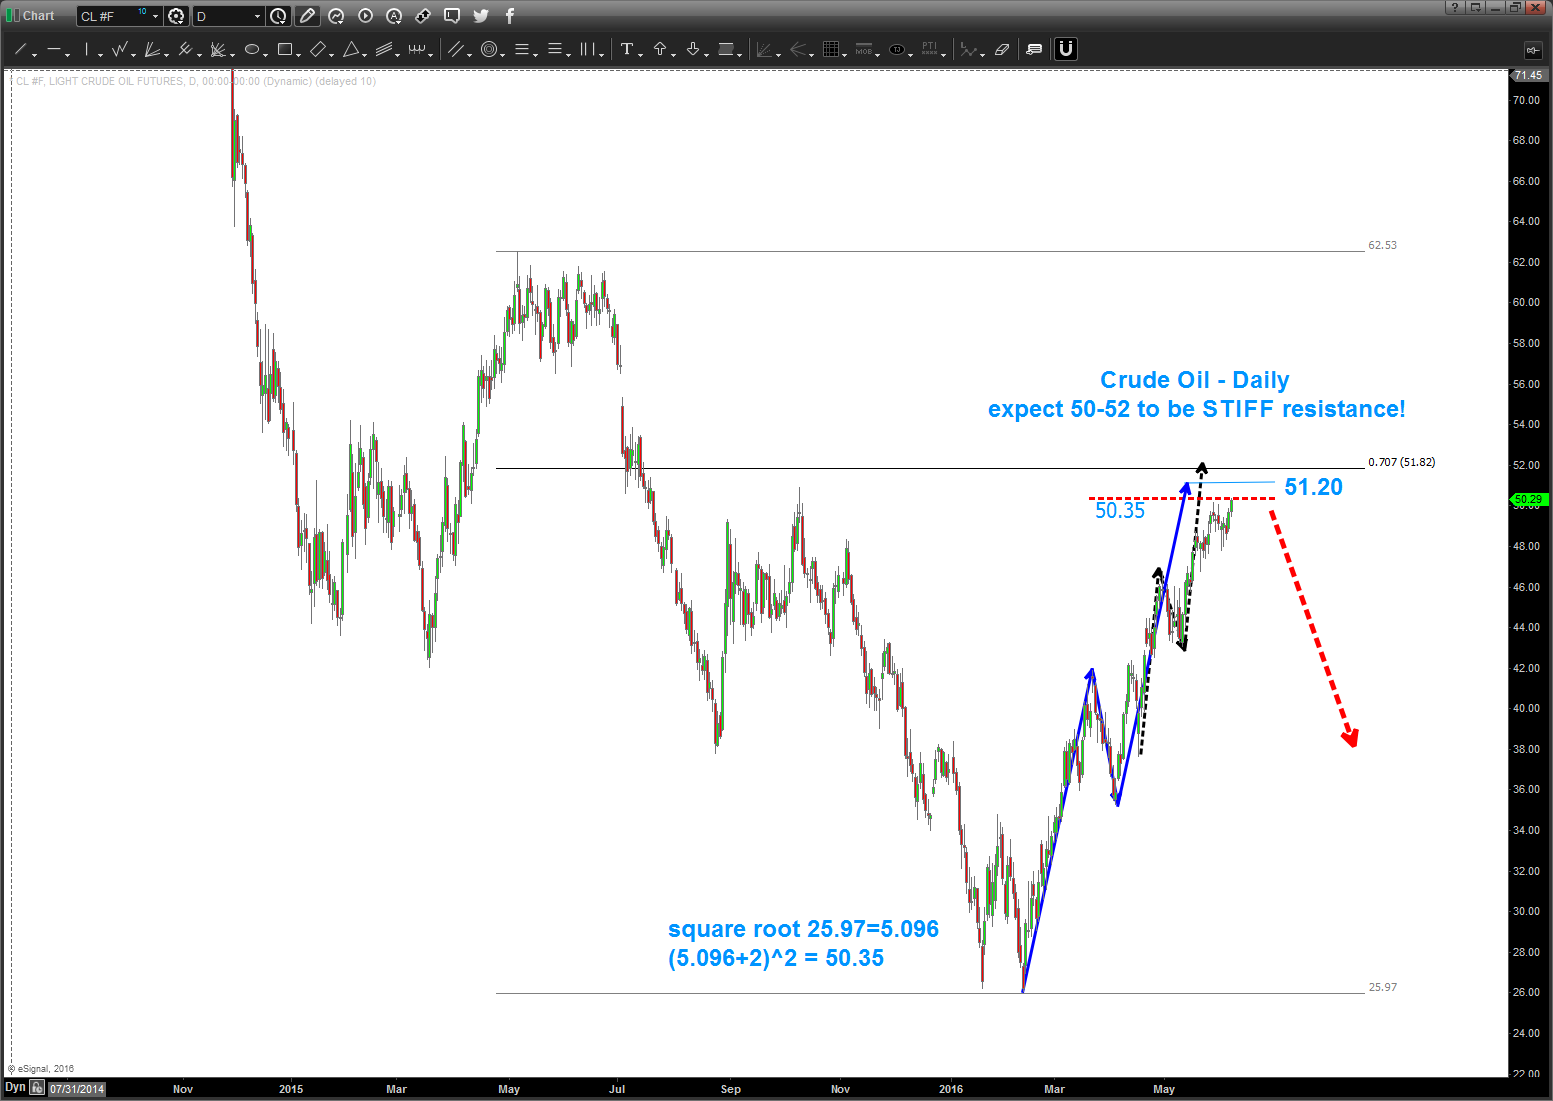
Crude, Loonie, Oil Services Index (OSX)
Posted on June 7, 2016 Leave a Comment
they move together … looking for a SHORT OIL, SHORT OSX, long USD vs LOONIE.
B
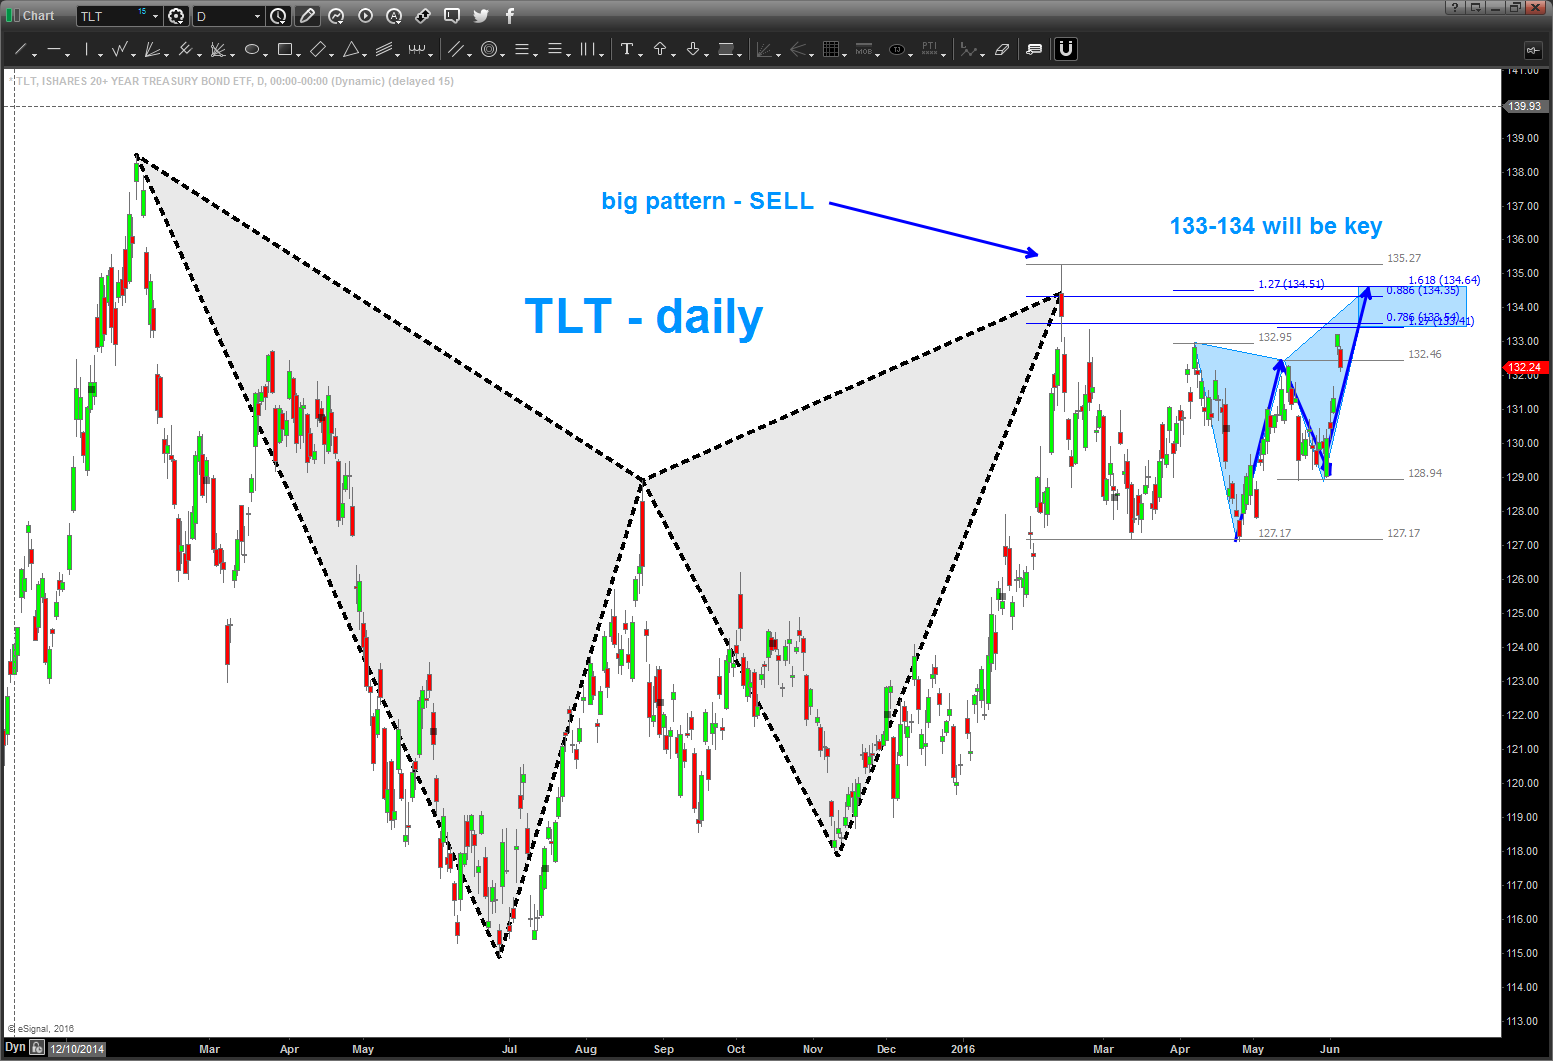
TLT update ..
Posted on June 6, 2016 Leave a Comment
TLT – the daily sell pattern, in FEB 2016, has held and the move down today was helpful. this pattern fails if we get above 133-134.
Watch, closely.
Bart
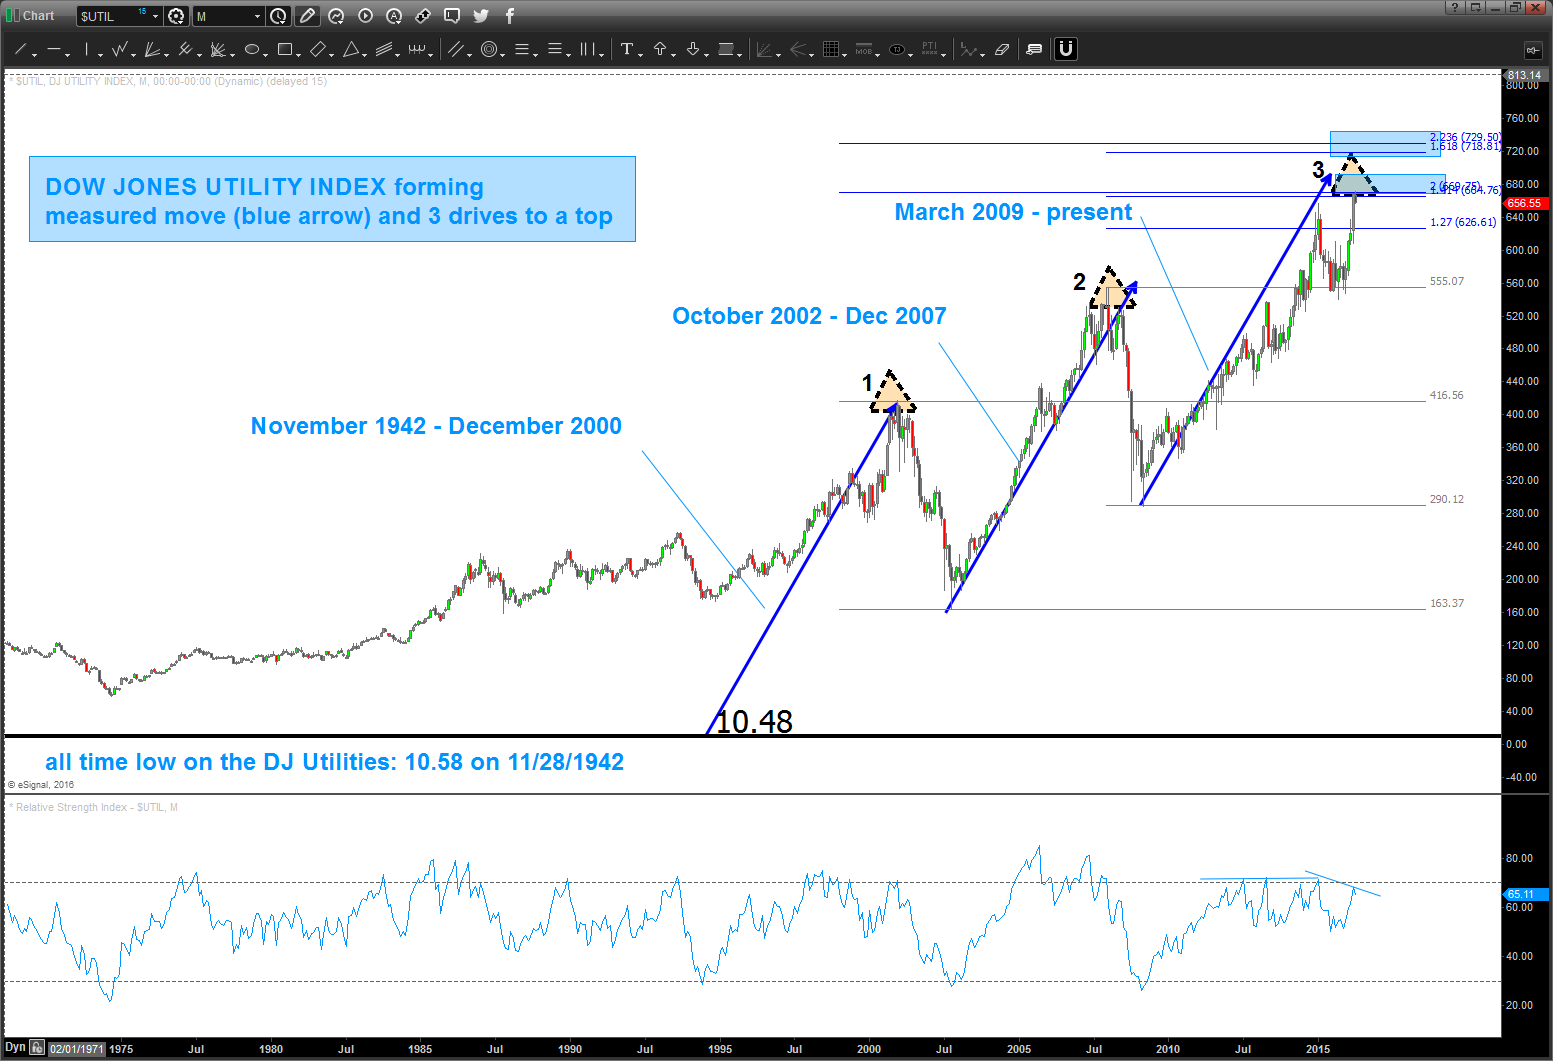
I STILL think this is a big deal … Utilities
Posted on June 6, 2016 Leave a Comment
06/06/2016 – were rolling right up into the target zone w/ monthly bearish divergence. yes, I still think this is a big deal and begs of caution … in 26,854 days Utilities have never gone farther w/out a major correction. Questions?
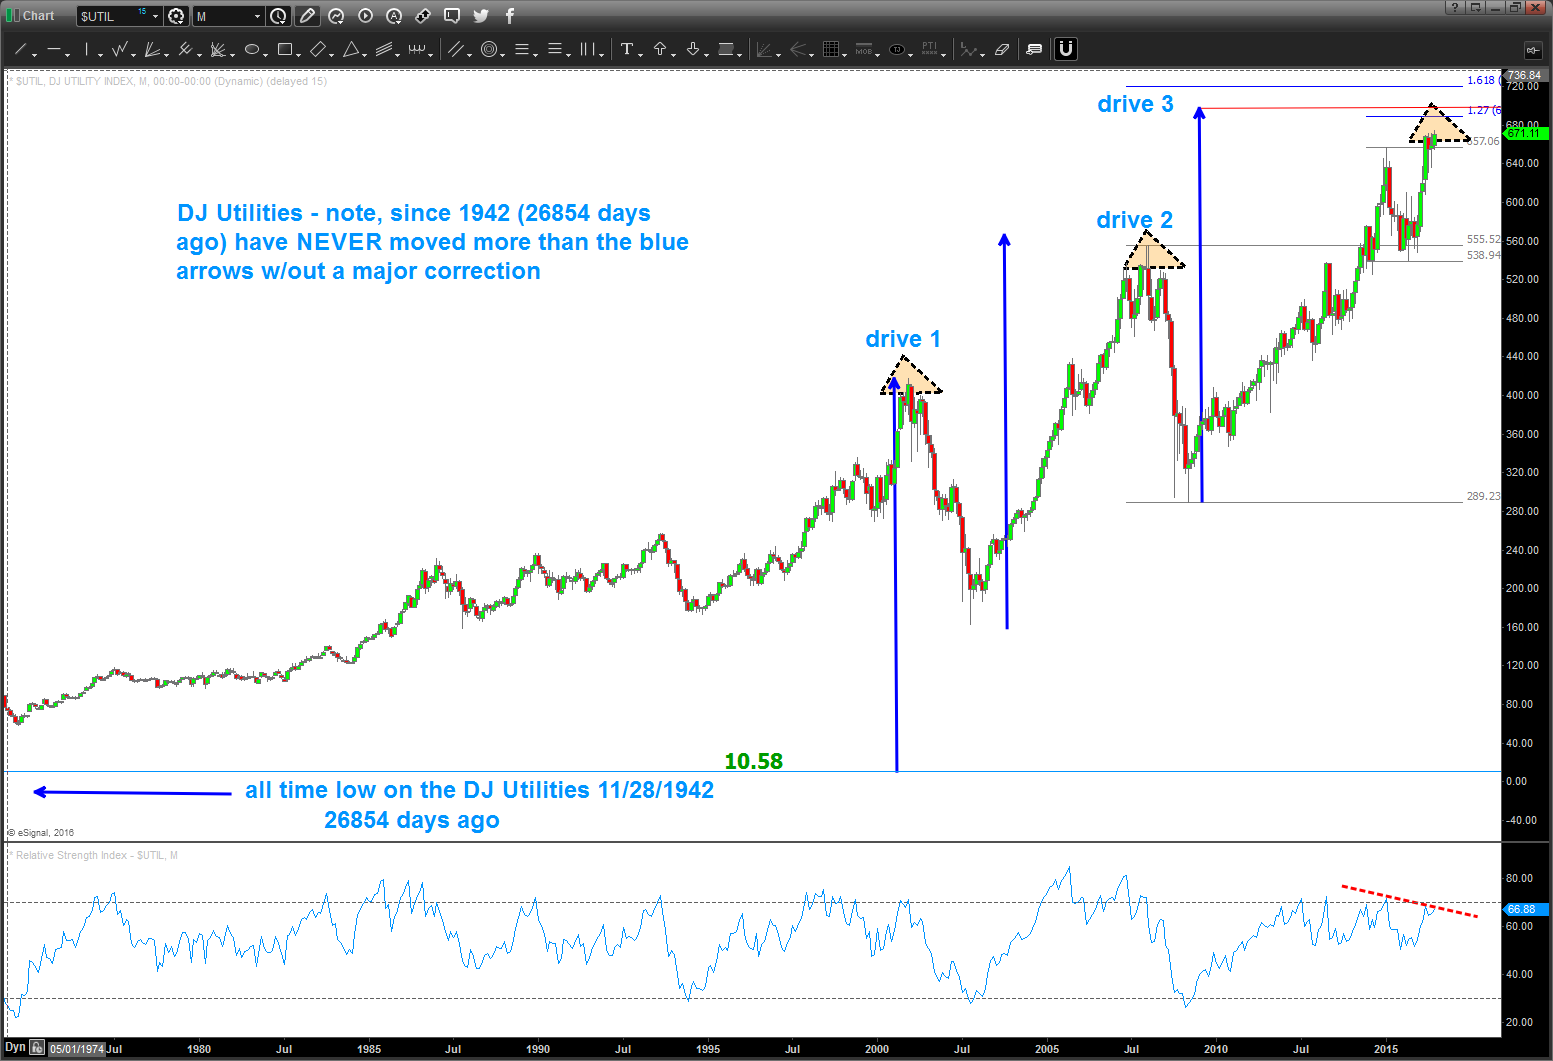
going to show this chart again of the Utilities … watch closely, the upper target is pretty darn close. Since the low in the 1940’s the Utilities have never gone farther than this (or close to this – still some upper targets) w/out a major pullback.
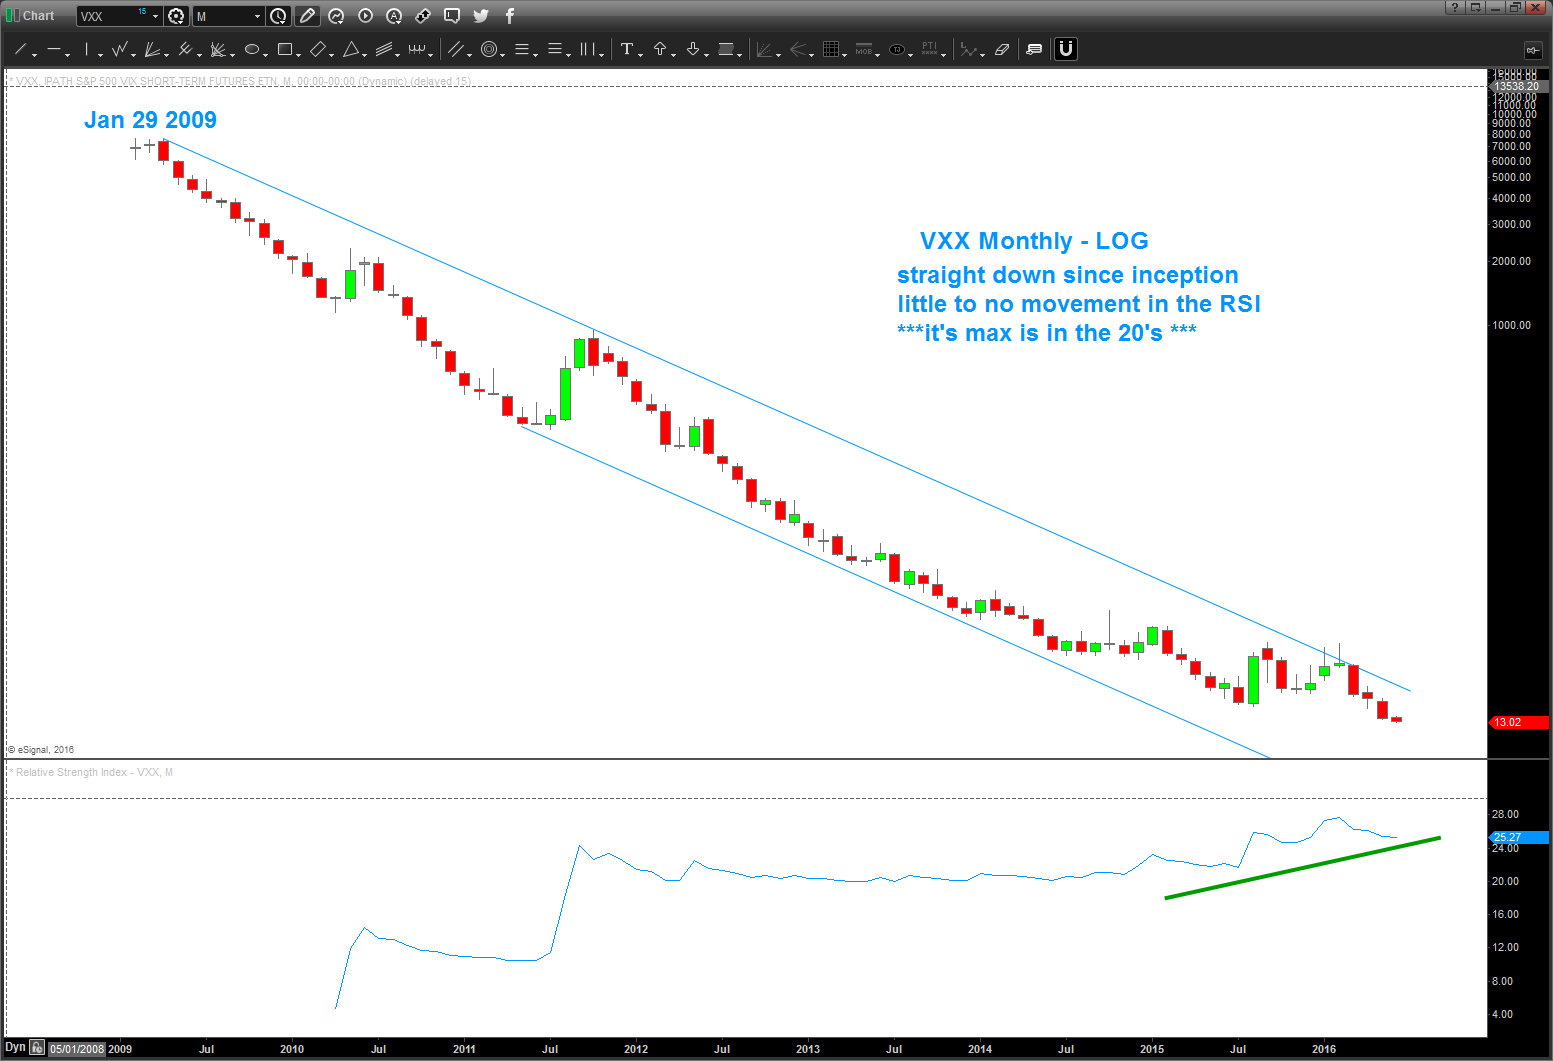
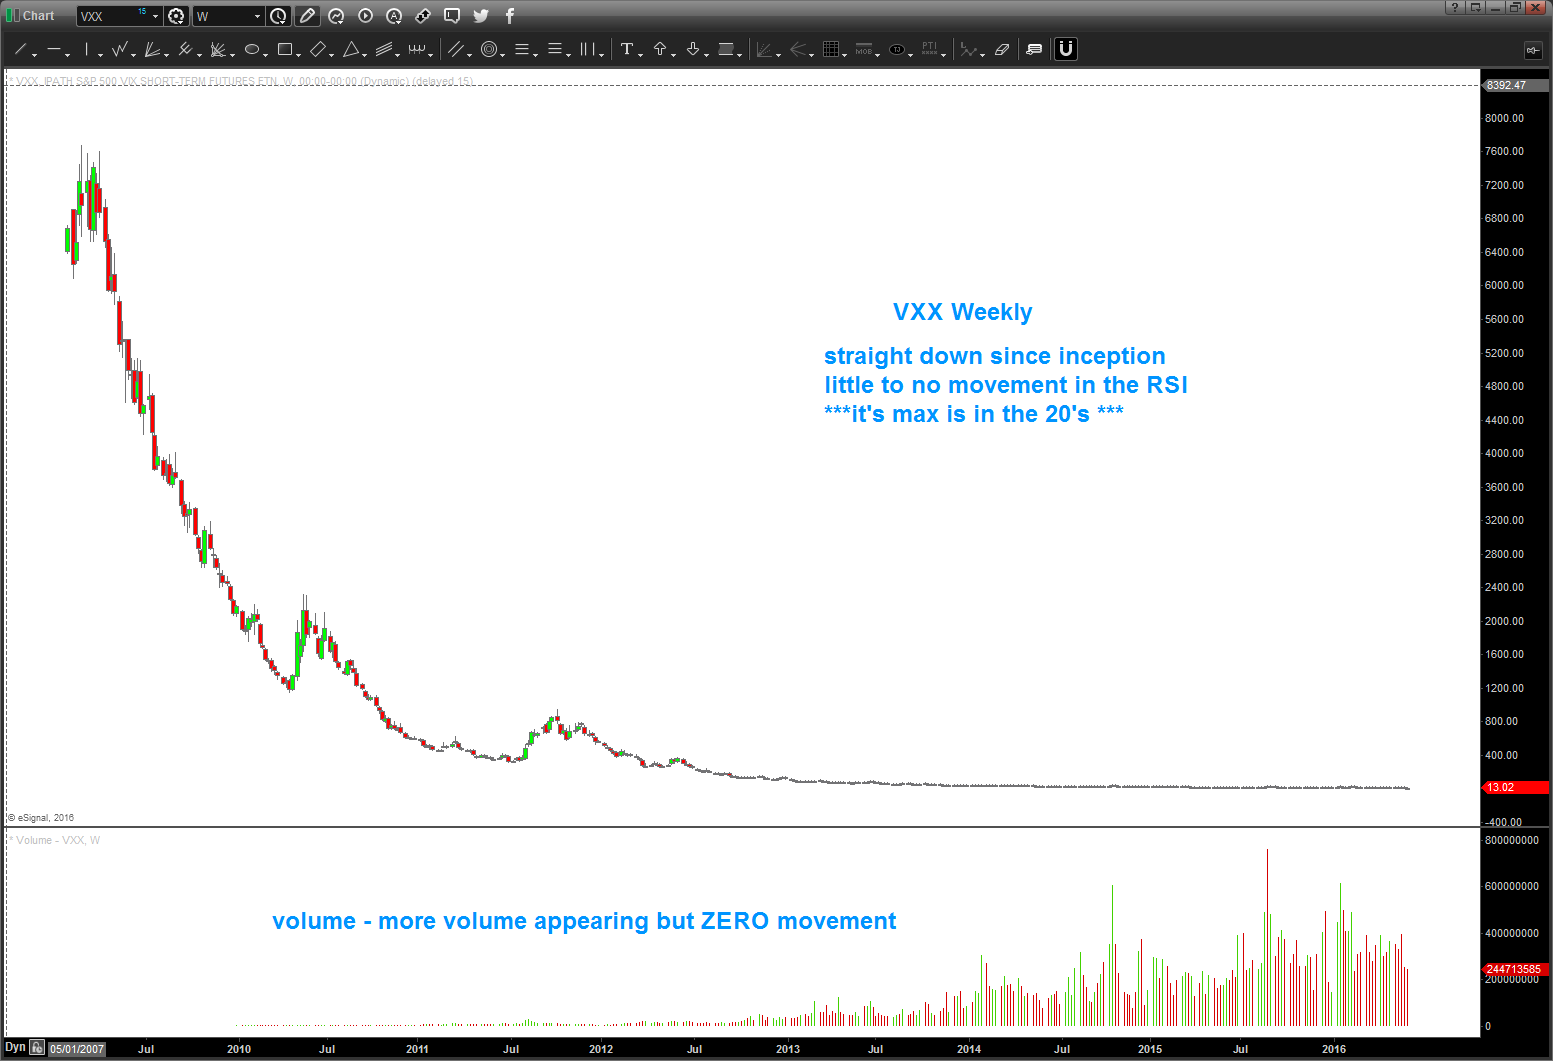
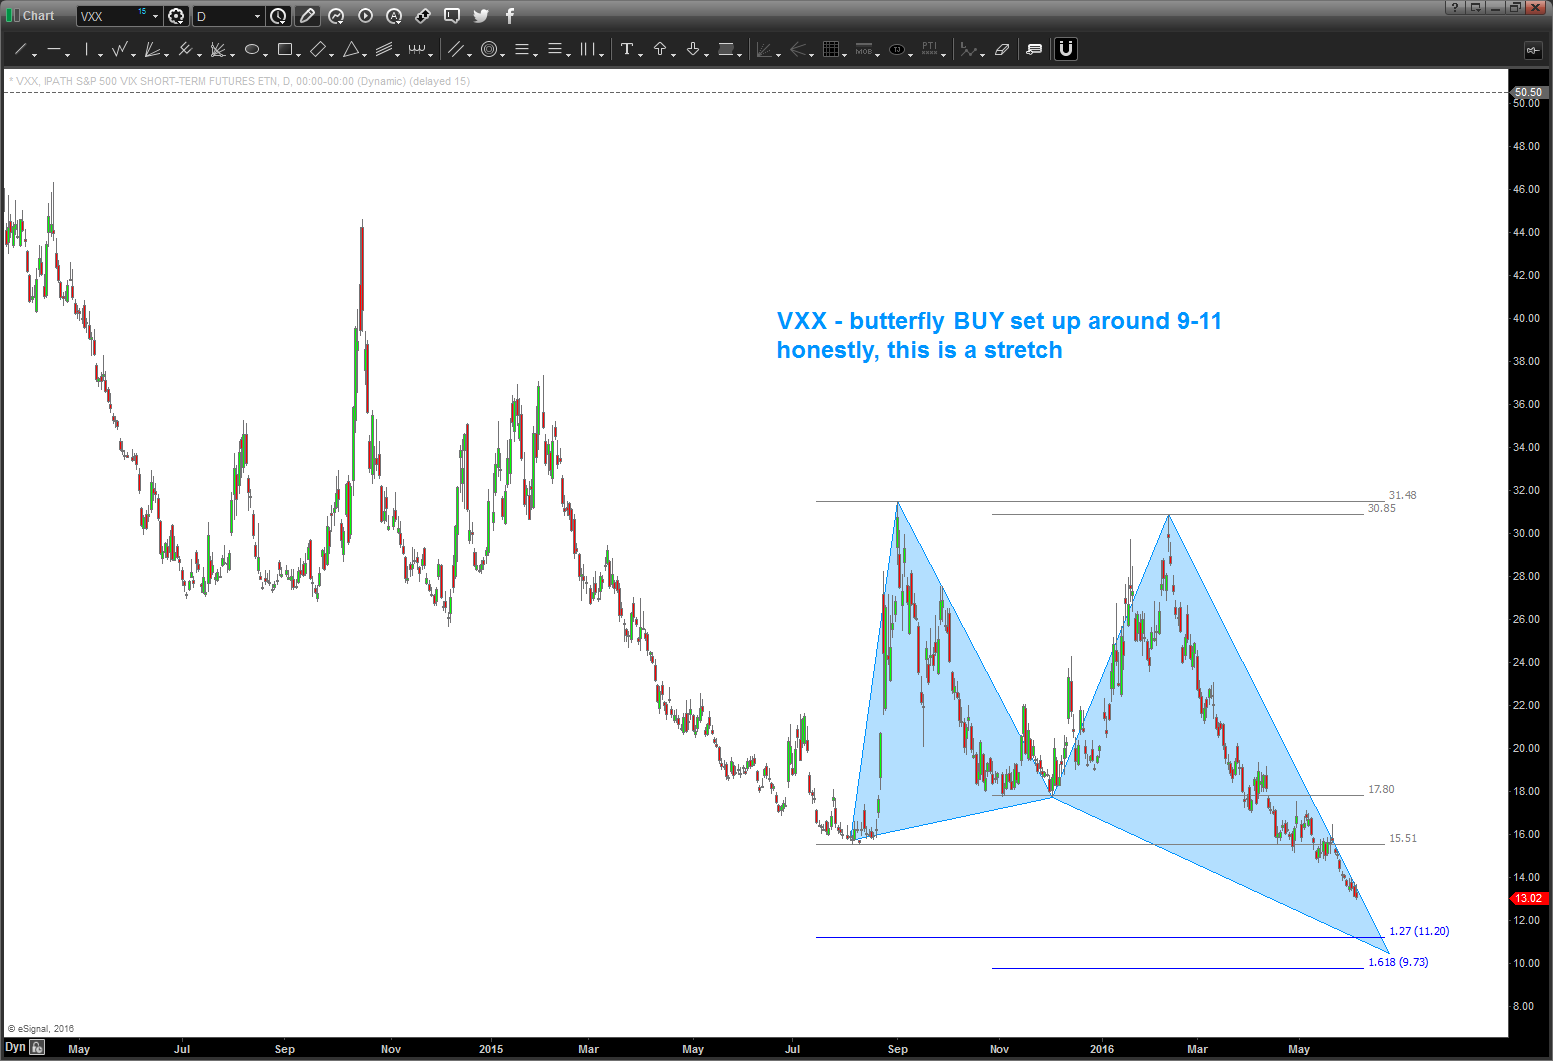
VXX …what a mess
Posted on June 5, 2016 3 Comments
06/05/2016 – taking a look at VXX for a friend. not sure what to say … I can see a “daily” BUY set up in a butterfly but this thing is simply dead.
interesting to see the increase volume even though it hasn’t budged. I bet it’s everyone betting on the crash that’s never come .. buy VXX, close VXX, buy VXX, close VXX.
So, not sure what to tell you … what I can say is that tomorrow should be a cycle turn date so it “should” turn down but who knows.
sorry, wish I could give you more information ….
B
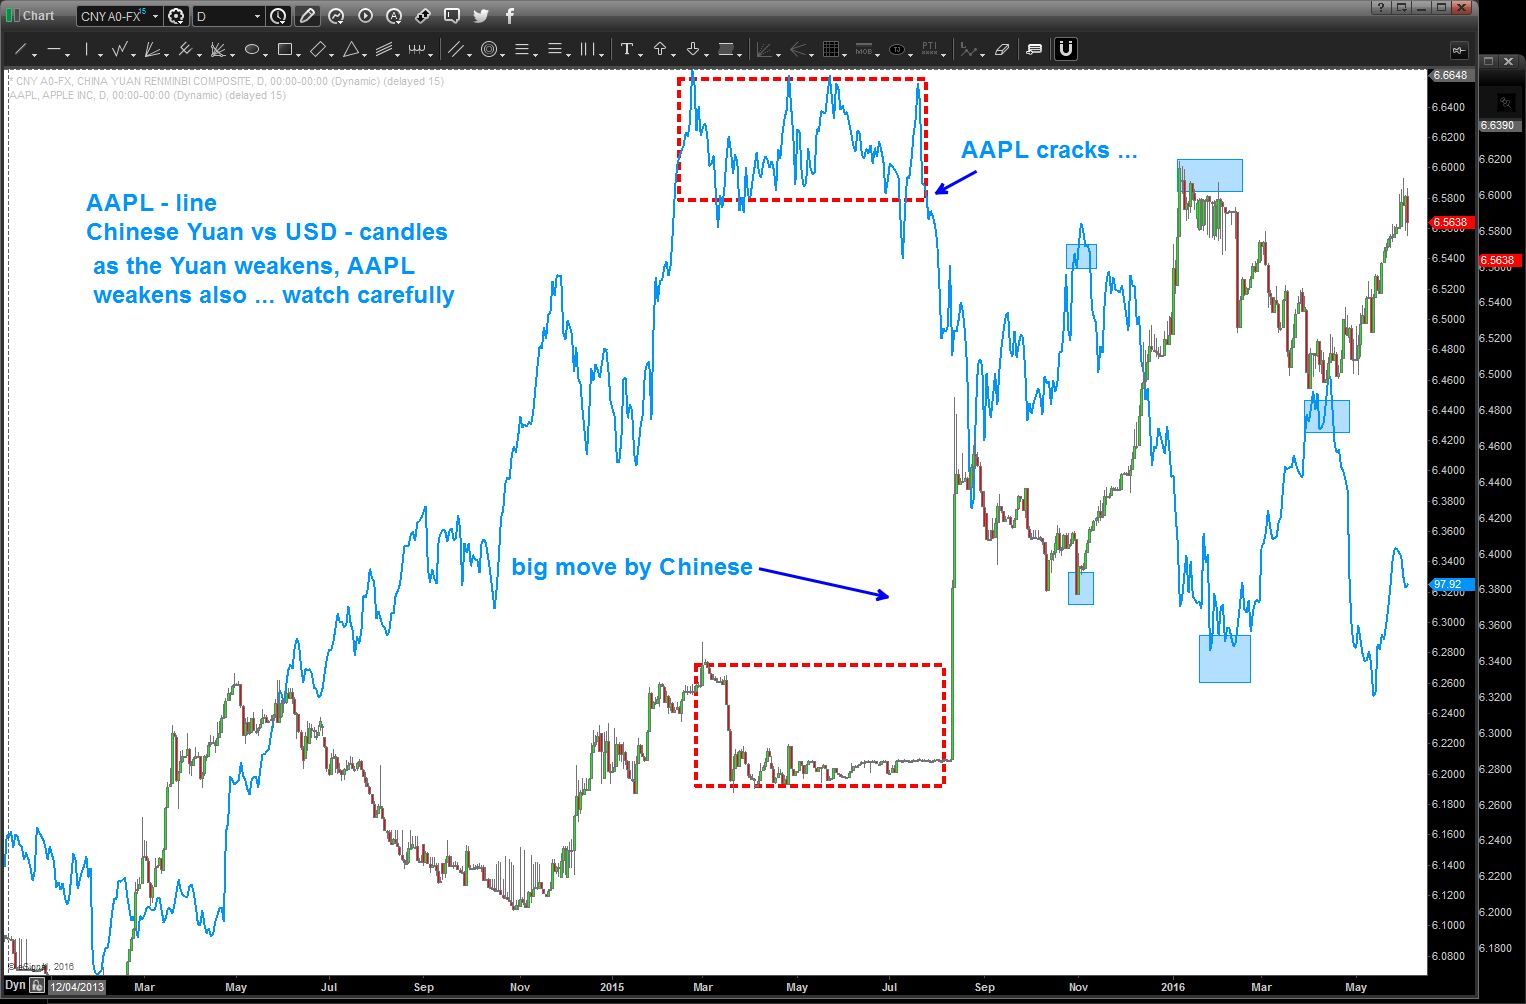
Chinese Yuan and Apple ($AAPL)
Posted on June 5, 2016 Leave a Comment
folks, knowing what’s going on in the currency market is so crucial .. not only does it completely dwarf any other market out there in volume/volatility but it also play such a crucial roll in the flow of funds, affects on commodities, etc.
back in 2015 I posted “the most important chart of 2015″ and it was the Chinese Yuan: https://bartscharts.com/2015/12/09/most-important-chart-to-end-2014-revisited-in-december-2015/
I was aware that $AAPL did a bunch of manufacturing over there and, in the past, had shown the correlation of the price of Palladium to $AAPL stock. You can check that out here – https://bartscharts.com//?s=palladium
it’s take a little bit of time – imagine that – but as the entire world was wondering ….”hmmm, I wonder if the Chinese are done letting the Yuan gain strength against the USD” $AAPL was making it’s all time high and digesting this same thought .. (see dashed red rectangle below). The Chinese answered the question w/ a BIG EXPLOSIVE CANDLE … Answer: guess this move weakening the Yuan is real.
Now $AAPL. Note, when the “big move” came by the Chinese AAPL cracked and, since then, has been correlating nicely w/ the swings in the Yuan.
So, cliff notes, pay attention the Chinese Yuan and $APPL together …will this correlation break in the future? Probably but for now as the Yuan continues to weaken against the USD, $AAPL sure seems to be having a tough time …
Let me know if you have any questions … continue to make it a great weekend wherever you are….
B
PS – here’s some work for $AAPL over @seeitmarket
- http://www.seeitmarket.com/aapl-stock-update-heres-bullish-aapl-buy-setup-15618/
- http://www.seeitmarket.com/apple-nearing-major-wave-completion-aapl-price-targets-14114/
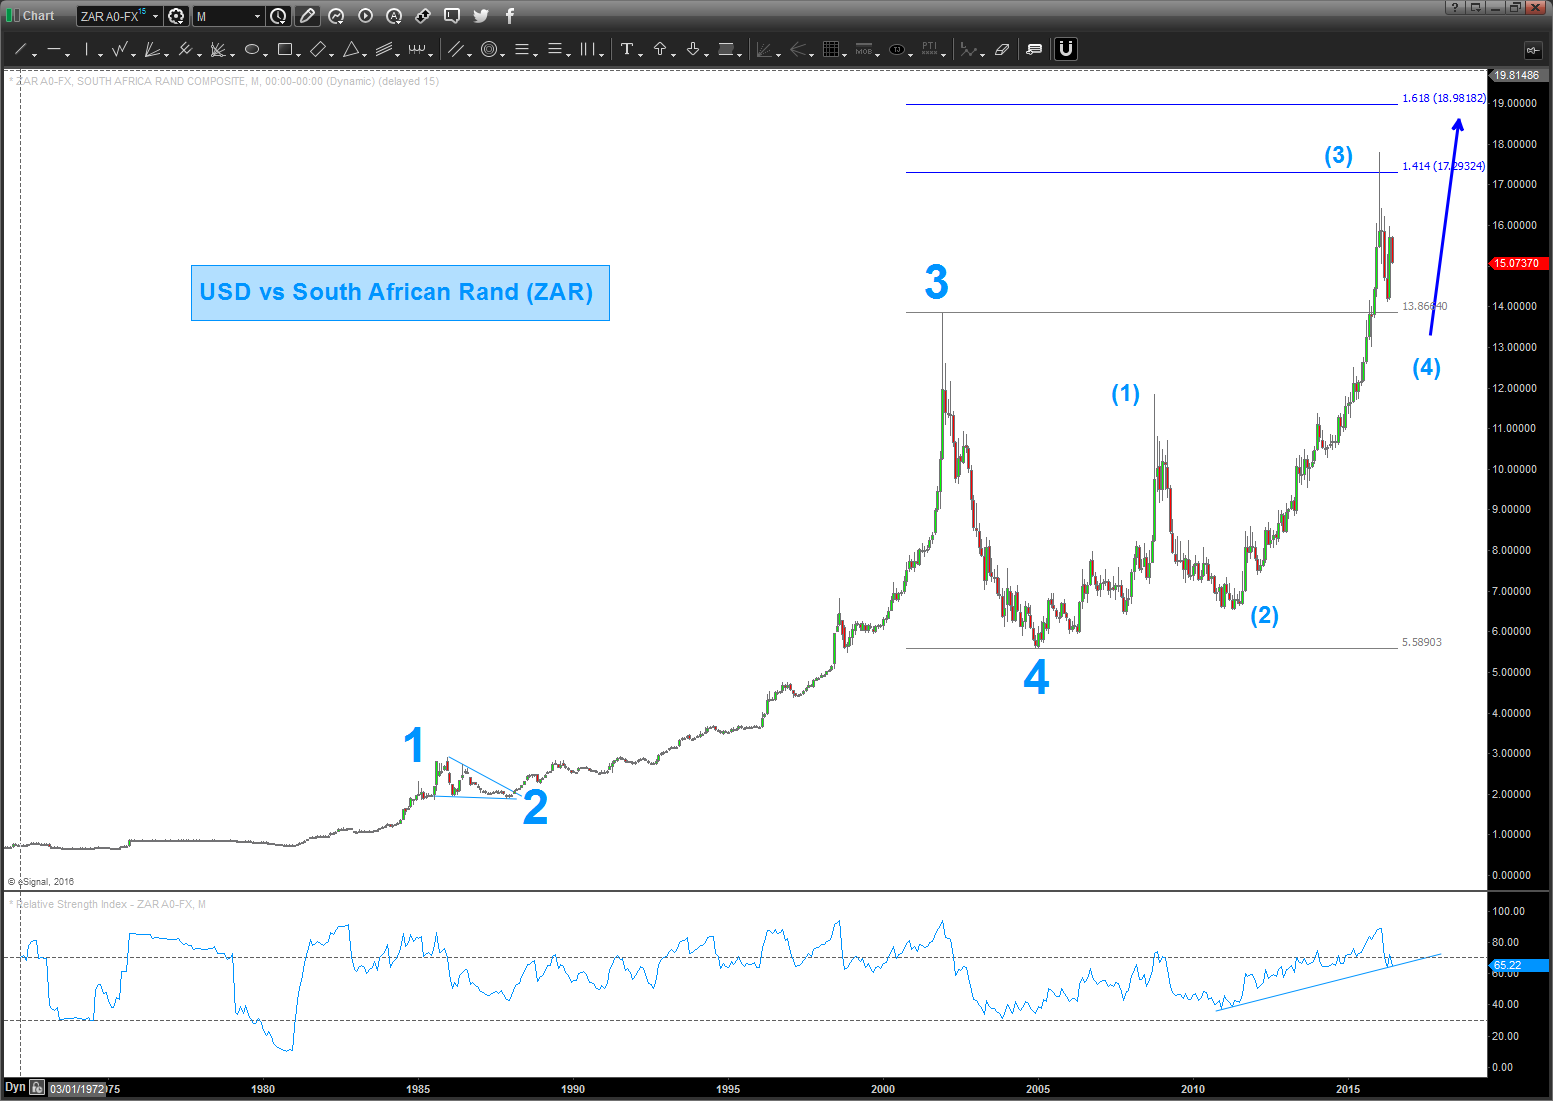
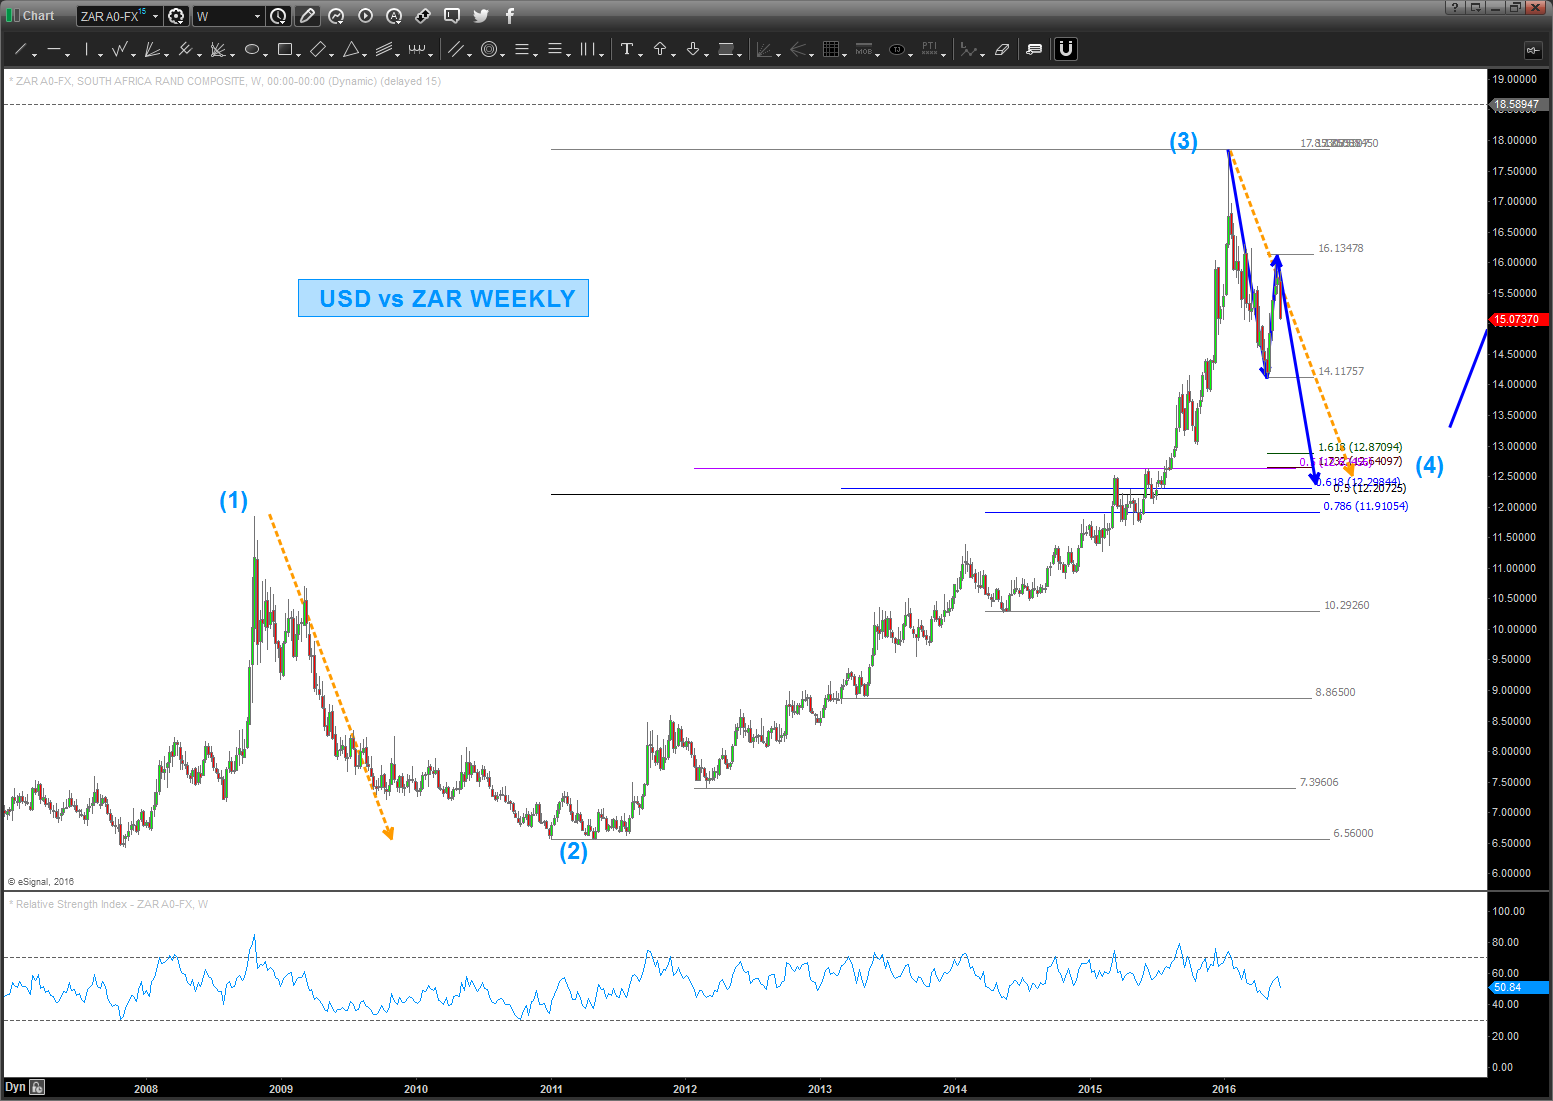
USD vs ZAR (South African Rand)
Posted on June 4, 2016 Leave a Comment
what an amazing and parabolic run … overall I see it correcting into the pattern on the weekly but am going to have to watch the most recent swing action (the big candle from Friday) to see where it goes next.
note the corrective move (orange dashed line) that lines up exactly w/ the projection … right now, that will be the best place (IMHO) to get long the USD vs ZAR. However, nothing IMMEDIATE from a pattern perspective as far as I can see.
hope this helps Jeremy and thanks for the questions and following the blog ….