Missing $LNKD in the chain updated from September 2013
$LNKD has been correcting since the top in September 2013 …it’s been a series of lower highs and lower lows so nothing is glaringly bullish EXCEPT the high was noted as a 3. So, ultimately, this corrective move in LNKD should be bought. the first and normal target is the end of the 4th wave of a lesser degree and that’s around 160. also, note the time component — the wave 2 correction is noted by the blue shaded box and then copy/pasted and shows from a time perspective that we could work 2 more month’s into the equation. Here’s the chart posted in September 13′:
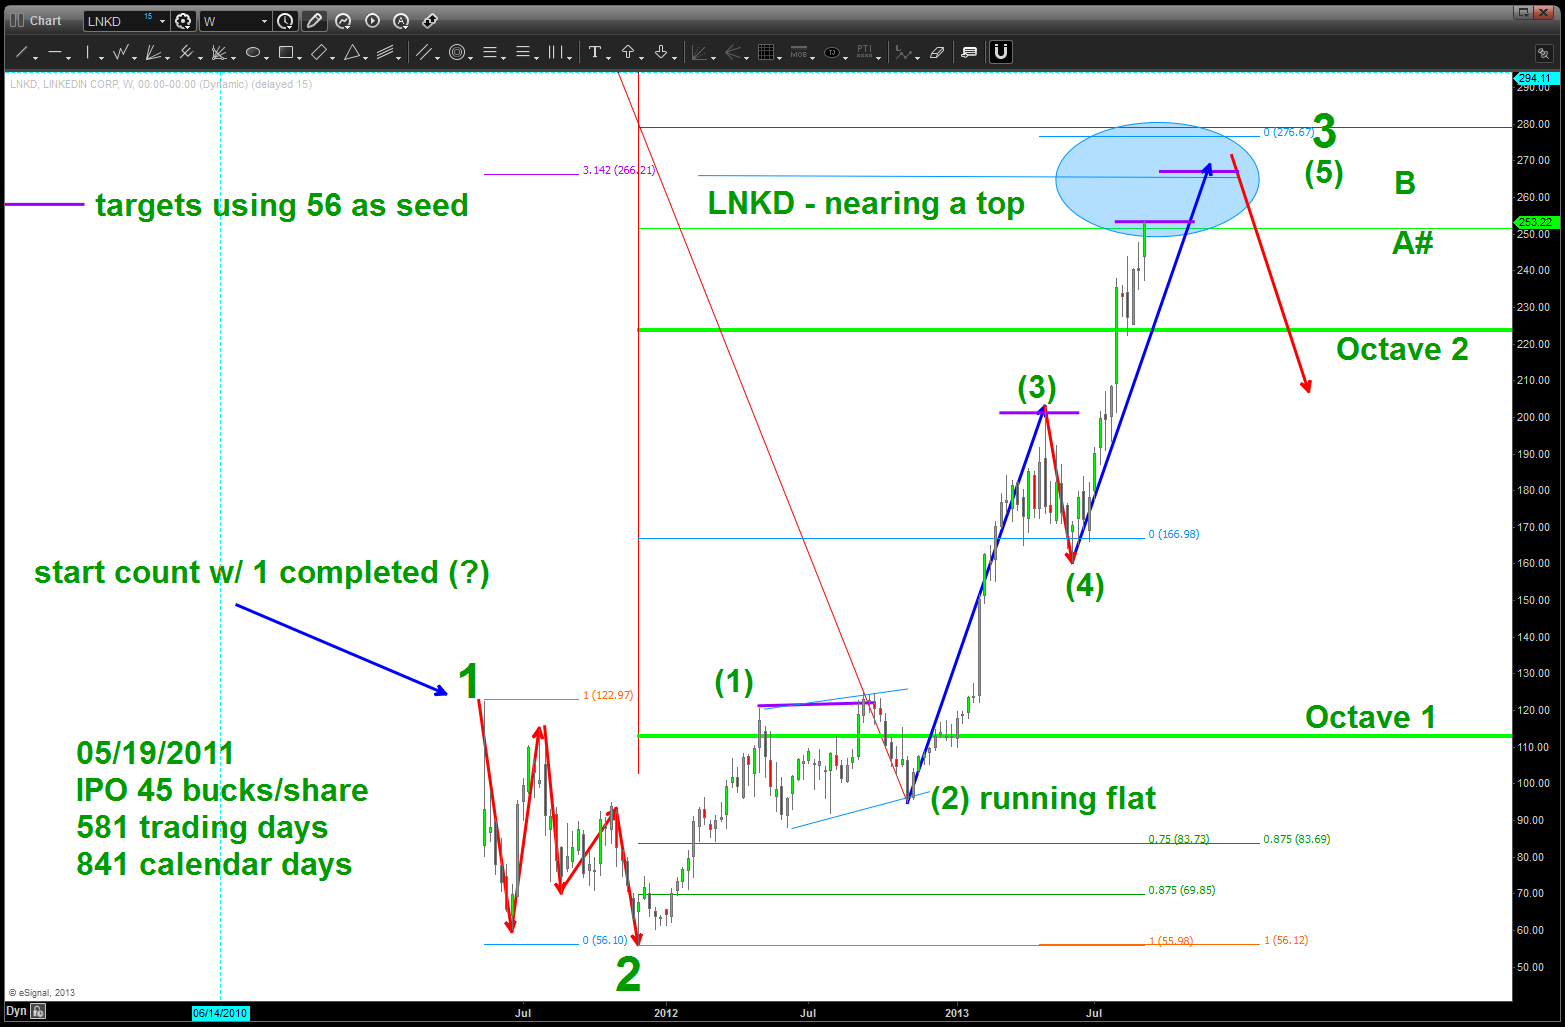
Nearing a TOP, caveat emptor
Here’s the updated chart:
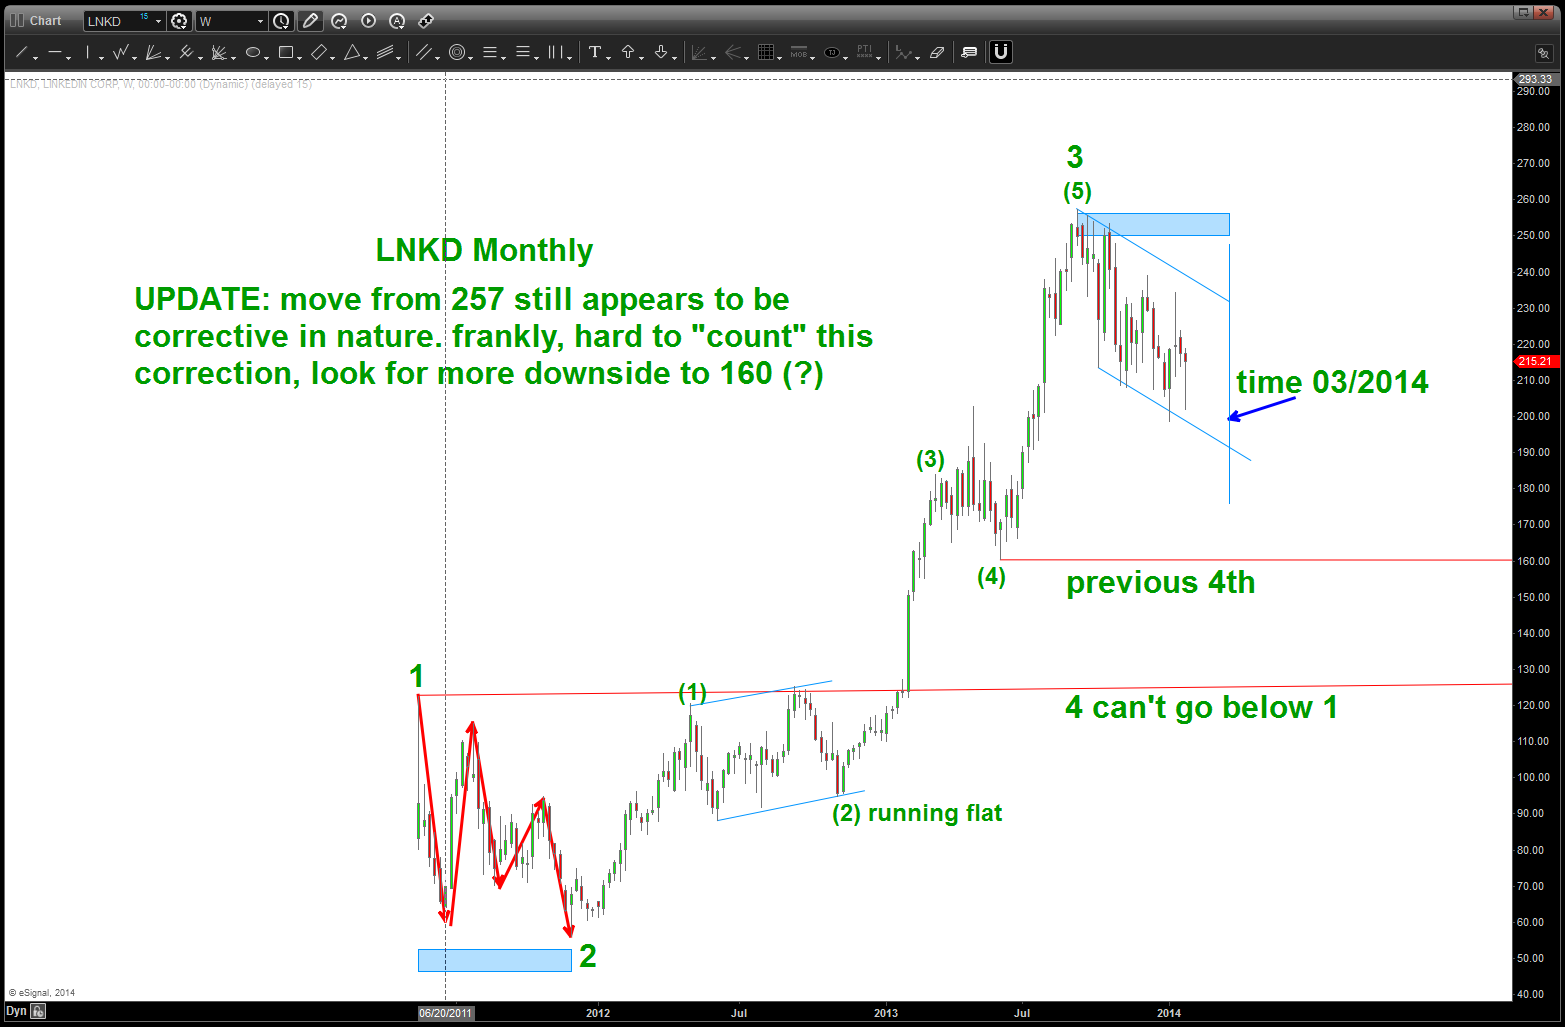
LNKD some more correcting?
the last thing I want to show is the Gold/Silver index? TILT…hugh? All I want to show is how the same PATTERN appears to be forming on LNKD and how, ultimately, it cracked and then down she went…don’t worry about the index being shown, just note the PATTERN of distribution before “they” pulled the plug.
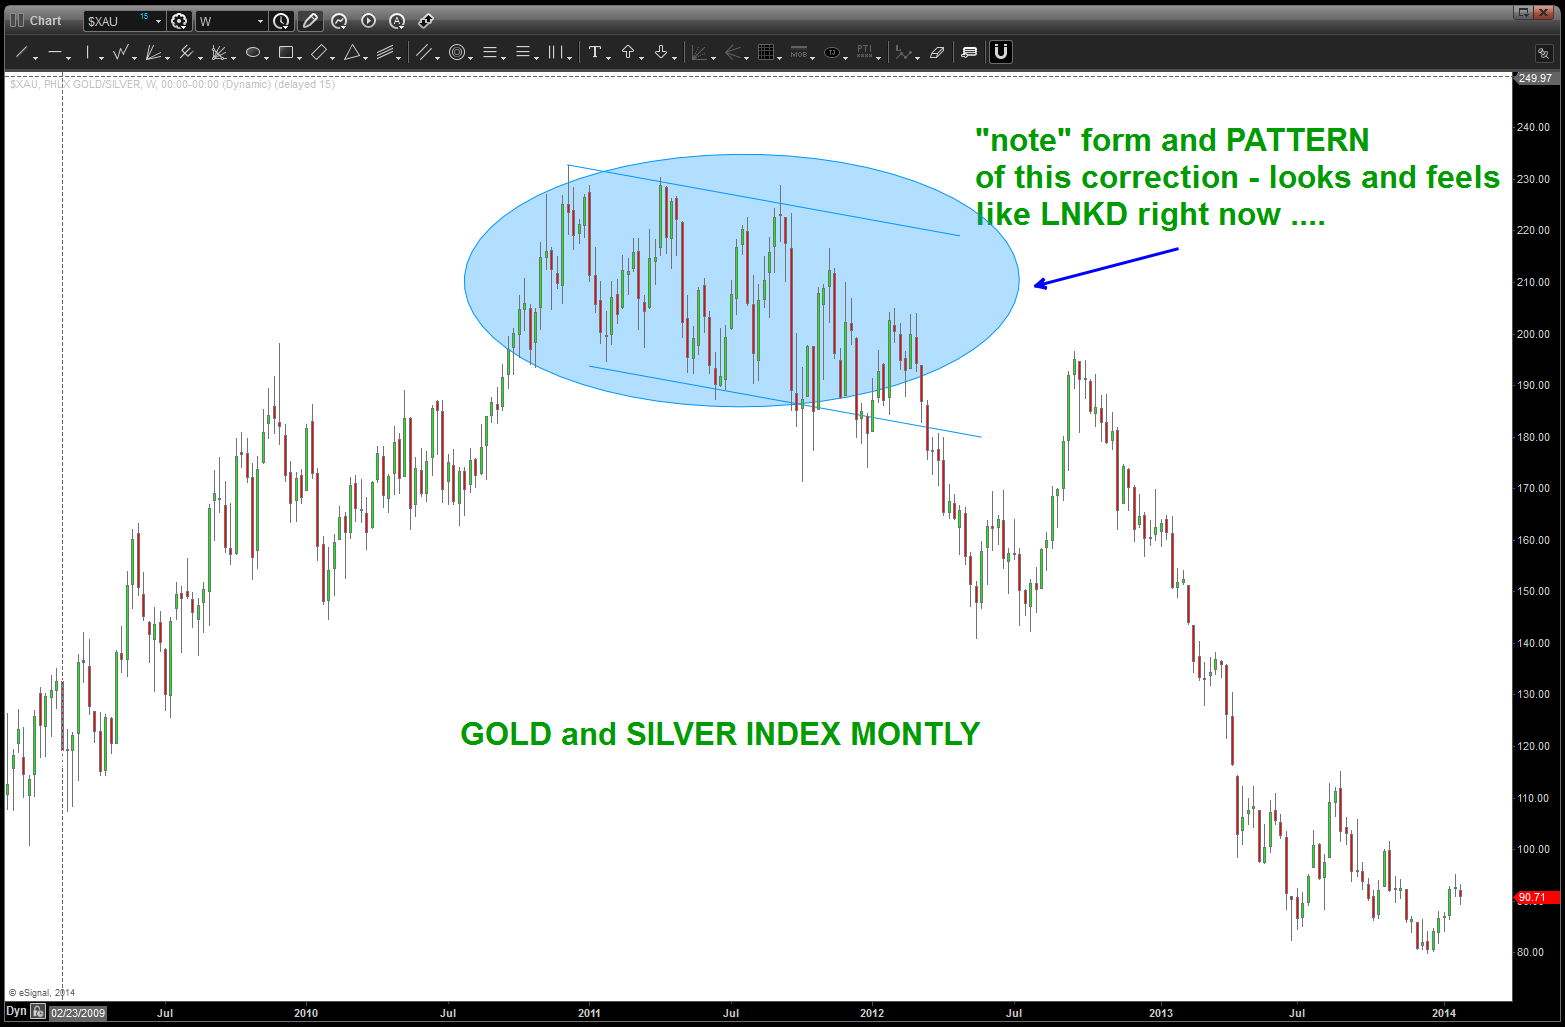
PATTERN at the TOP appears to be the same FRACTAL as LNKD.

Pingback: Linked-In and Math … | Bart's Charts