Linked-In and Math …
Folks, couple disclaimers before I start this blog:
- if you’ve been following me OR your new, you’ll know that I don’t make it a habit of doing the “could have would have should have.” Most of my posts (a majority) are real time – long before price ever gets to the targeted area or pattern
- I did a posts on $LNKD almost two years ago. Here’s the posts:
- https://bartscharts.com/2013/09/07/missing-a-lnkd-in-the-chain/
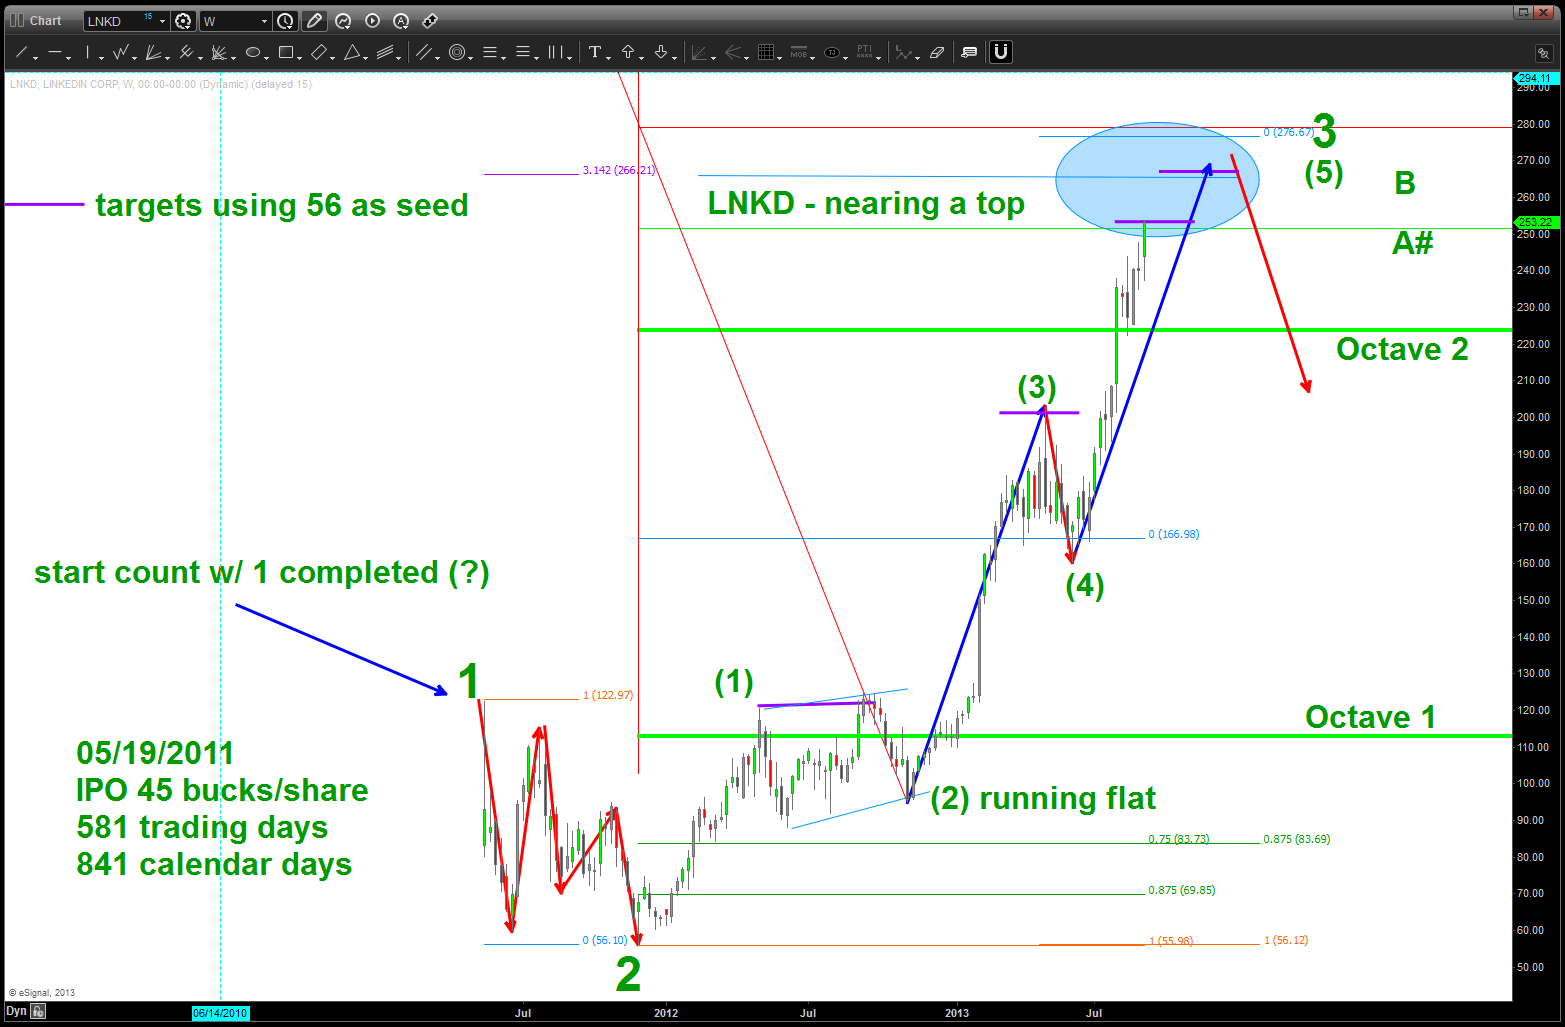
- this was as we approached the 250 area and notice I was seeing this as a 3 topping – which meant another high. I’ll post the chart below in a bit but pay attention the NUMBERS.
- https://bartscharts.com/2013/09/07/missing-a-lnkd-in-the-chain/
- https://bartscharts.com/2014/02/01/missing-lnkd-in-the-chain-updated-from-september-2013/
- hit the target area (but not all of the numbers) and started to correct
- https://bartscharts.com/2014/04/28/about-that-lnkd-chart-from-sept-2013/
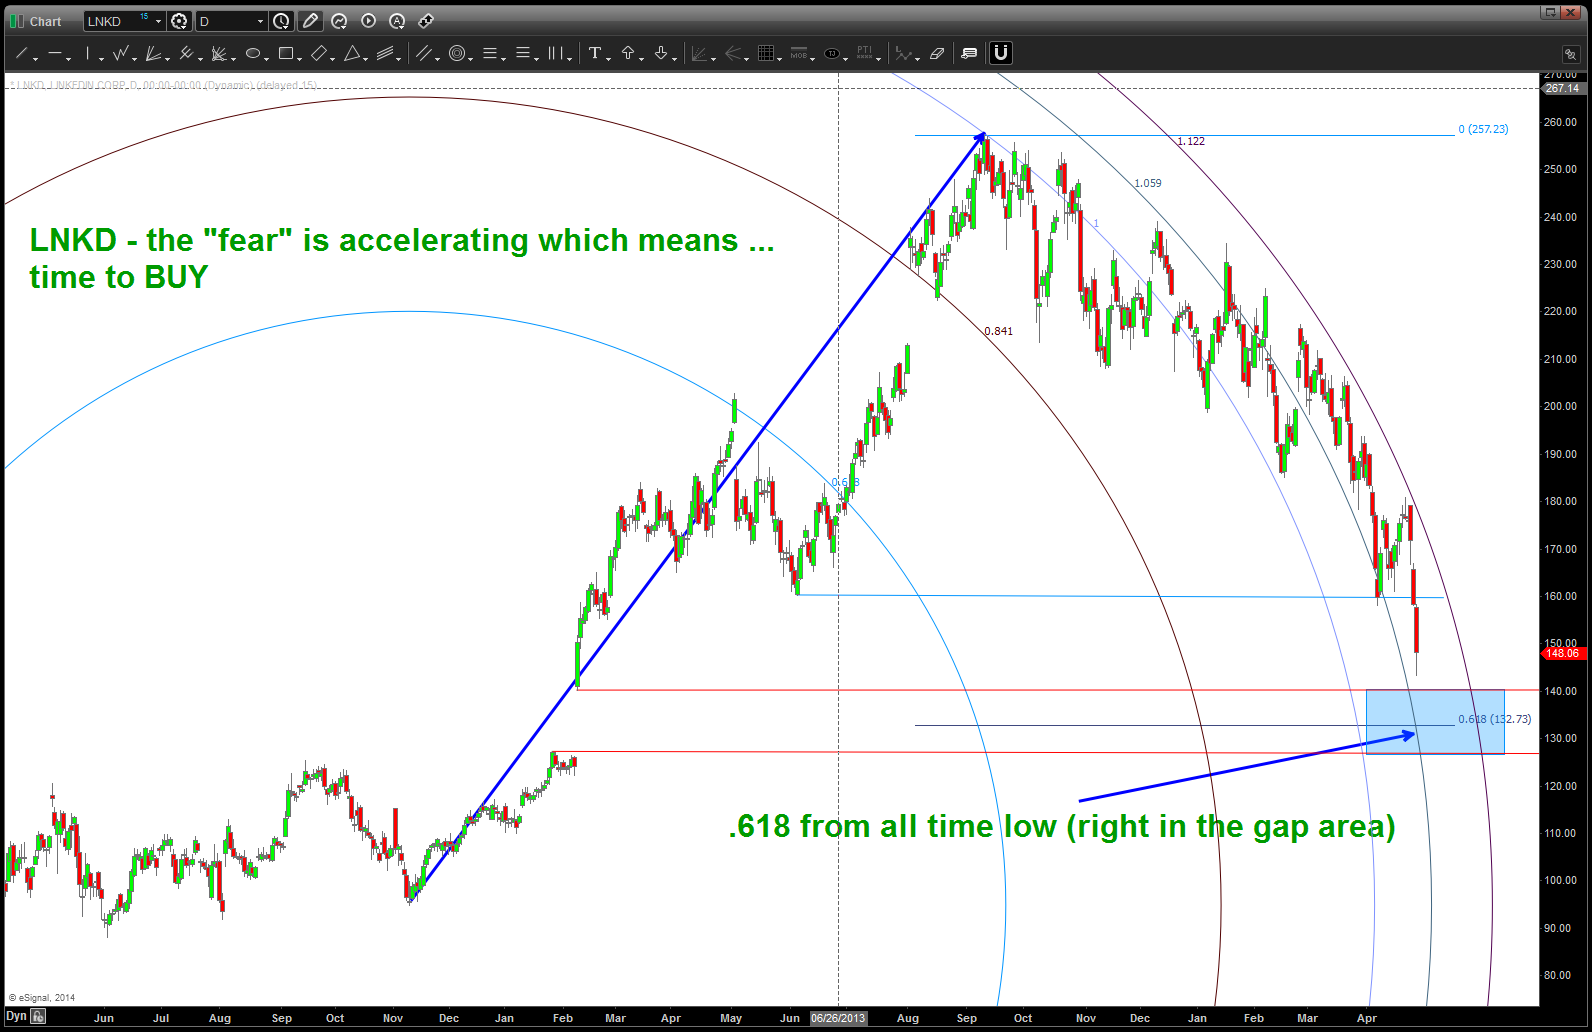
- a “wave 4 correction” was in process and using geometry alone recommended a BUY at the.618. Here’s the chart:
So, until the acquisition by MSFT was announced yesterday, I had forgotten about it. (I trade/focus on spot FX and like to look at stocks for friends and when asked).
Looks like the BUY worked great and we went up to a new high and hit exactly at the target using the signal reversal candle from the all time low. Michael Jenkins (a mentor and friend at http://www.stockcyclesforecast.com) taught me this technique. It’s pretty darn accurate and HAS NOTHING TO DO WITH THE FUNDAMENTALS. Here’s the chart:
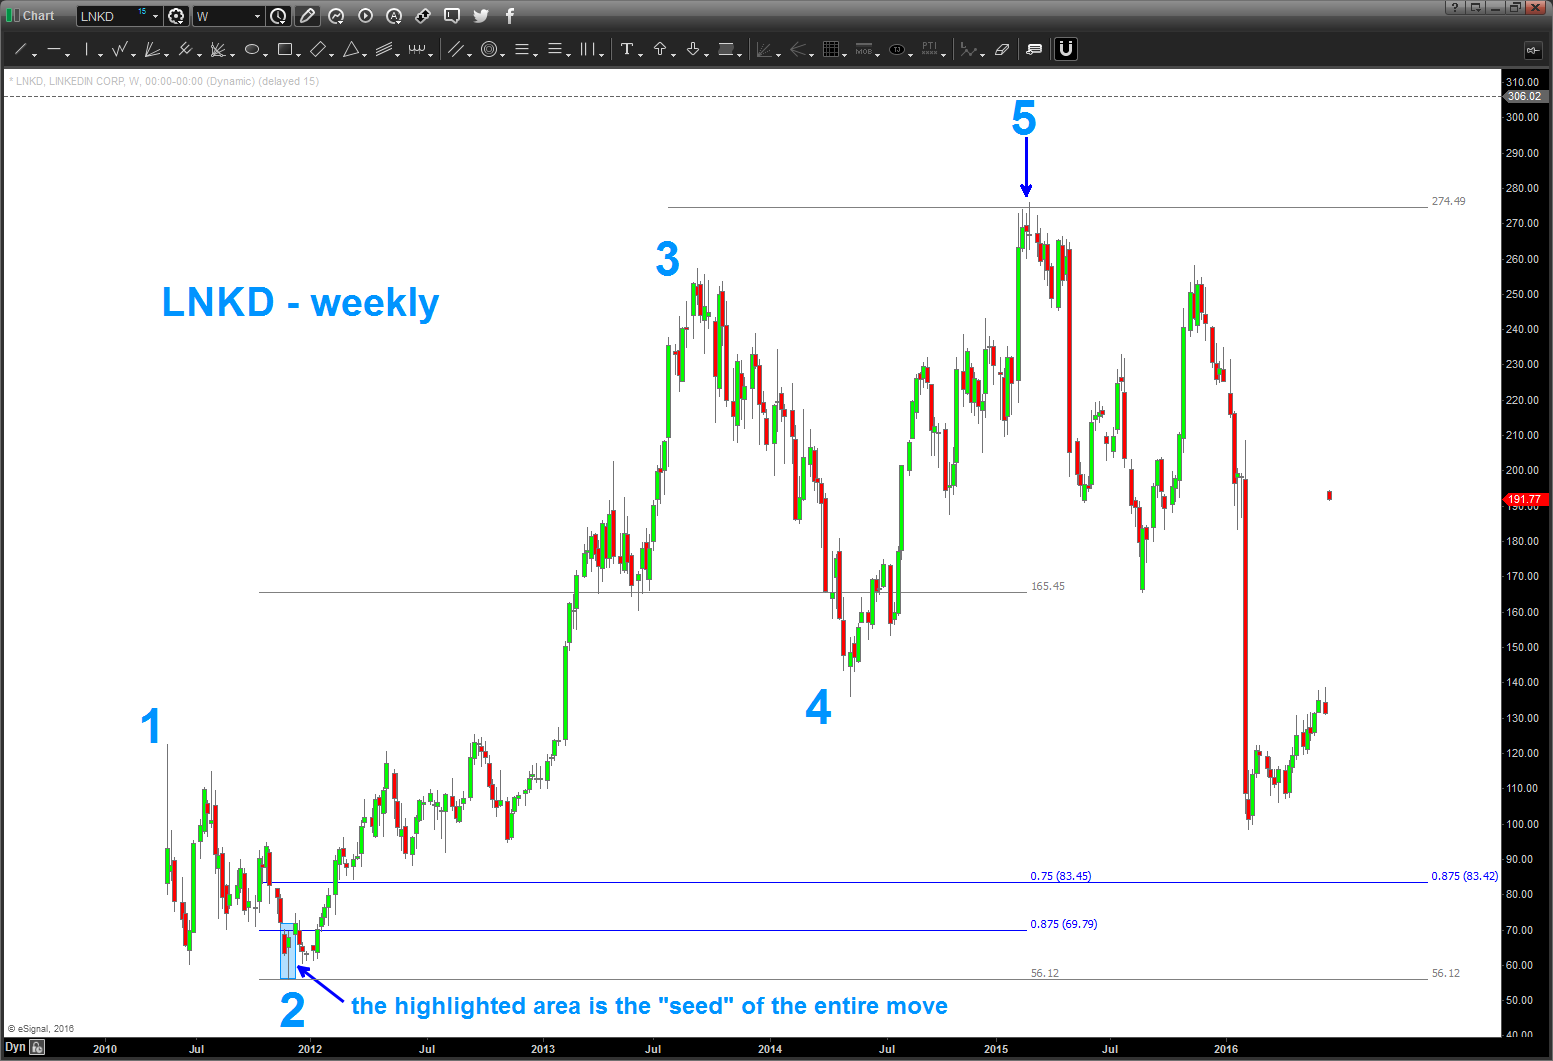
I know, you won’t believe (should you?) it’s basis is the zodiac, solstices, music, the great pyramid (which is proven to actually have 8 sides). If you’ll allow me to expand you’ll find that one single weekly candle contains the “DNA” of the upcoming move. EVERYTHING is based on that. In this case we used 1/8 increments of the LENGTH of that candle to project UP (long before price ever got there). When the “first” projection is done, then we simply double it and do another one …. note, when it went thru the first, it came back down and kissed it and took off. Key here ..the EXACT high was determined by the DNA candle highlighted in the chart above.
Now, I’m in the “could have would have” area but I just wanted to go over the numbers because its a good discipline and also reinforces the “pattern recognition” capability …
Here’s why the low came in where it did … all the numbers are based on sacred geometry and music:
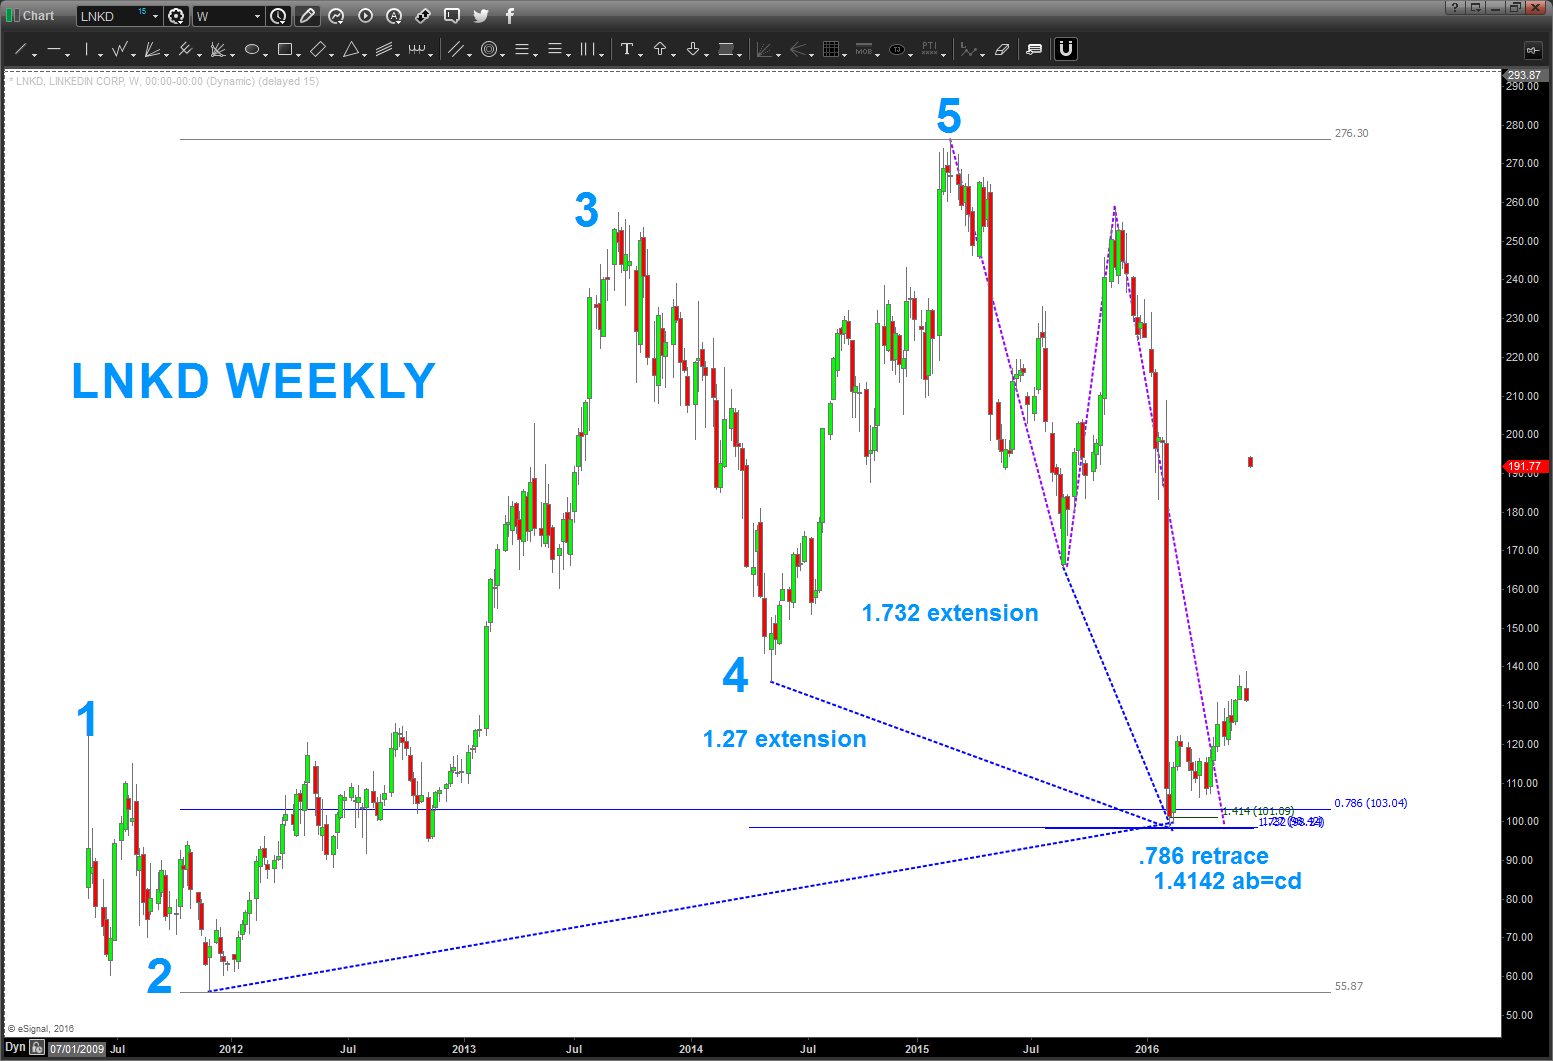
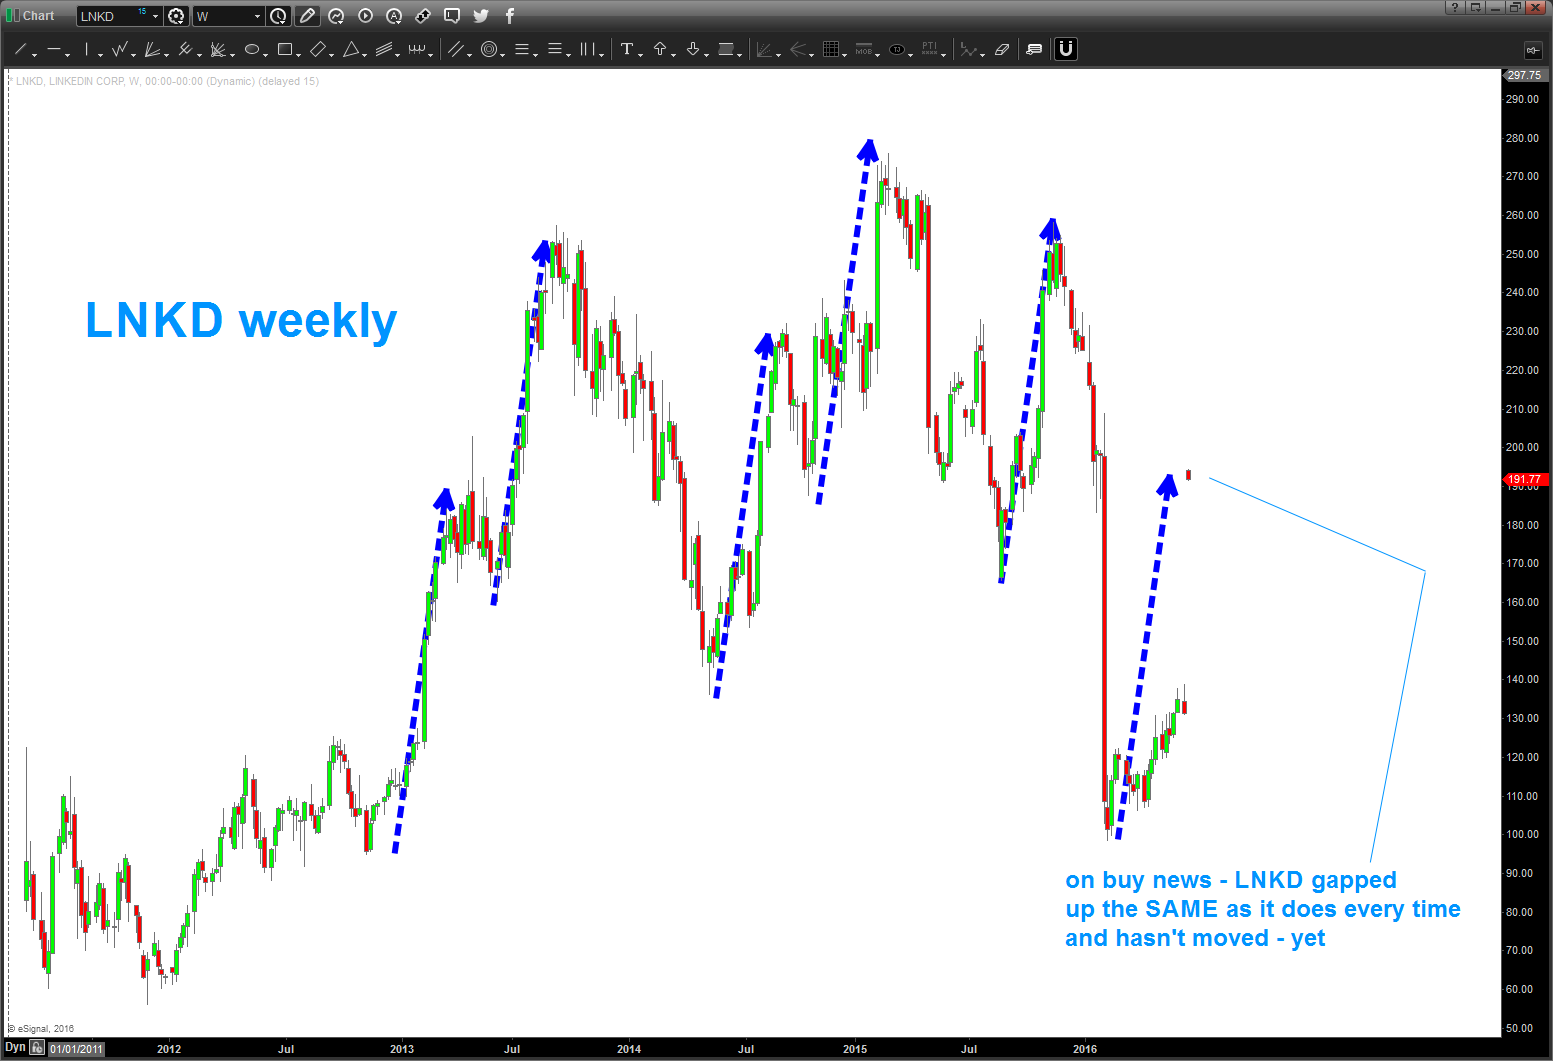
so, at 23.6 BILLION purchase price it gapped up big (and why wouldn’t it) Well, guess what, it gapped up right in line w/ as it always had … a blue dashed measured move:
so, where are we now? Kind of in no mans land, if you ask me. EVERYTHING has been pretty spot on and the MOVE UP was amazing. I’ll simply wait for the next pattern to try a BUY or a SELL. Because, in the end, I really don’t know OR care for that matter which way it goes.
Just wanted to provide some perspective on the patterns and numbers and how I have no idea of the fundamentals of any of this …
Bart
