Settled …somewhat
Posted on July 23, 2016 2 Comments
hey everyone .. wanted to let you know our household goods and car arrived late this week and we are “officially” settled in SoCal … loving it, every part of it.
hard to uproot but so much opportunity …if any of you are around the SoCal area IM me and let’s meet …
posts to follow …anyone need/looking at anything in particular?
Bart
@seeitmarket and the TLT update – possible island reversal on TLT from today’s action …stay tuned
Posted on July 12, 2016 Leave a Comment
nice timing for the post … 145 is still a possibility but the gap down today, left an island reversal if it holds for the day. any move should not go up above 145 (daily close) for this pattern to be valid.
Bart
Great British Pound – polarity principle at work
Posted on July 10, 2016 Leave a Comment
wow .. what an amazing vacation in the Outer Banks this past week. W/ a clear head, I open my charts this AM ..
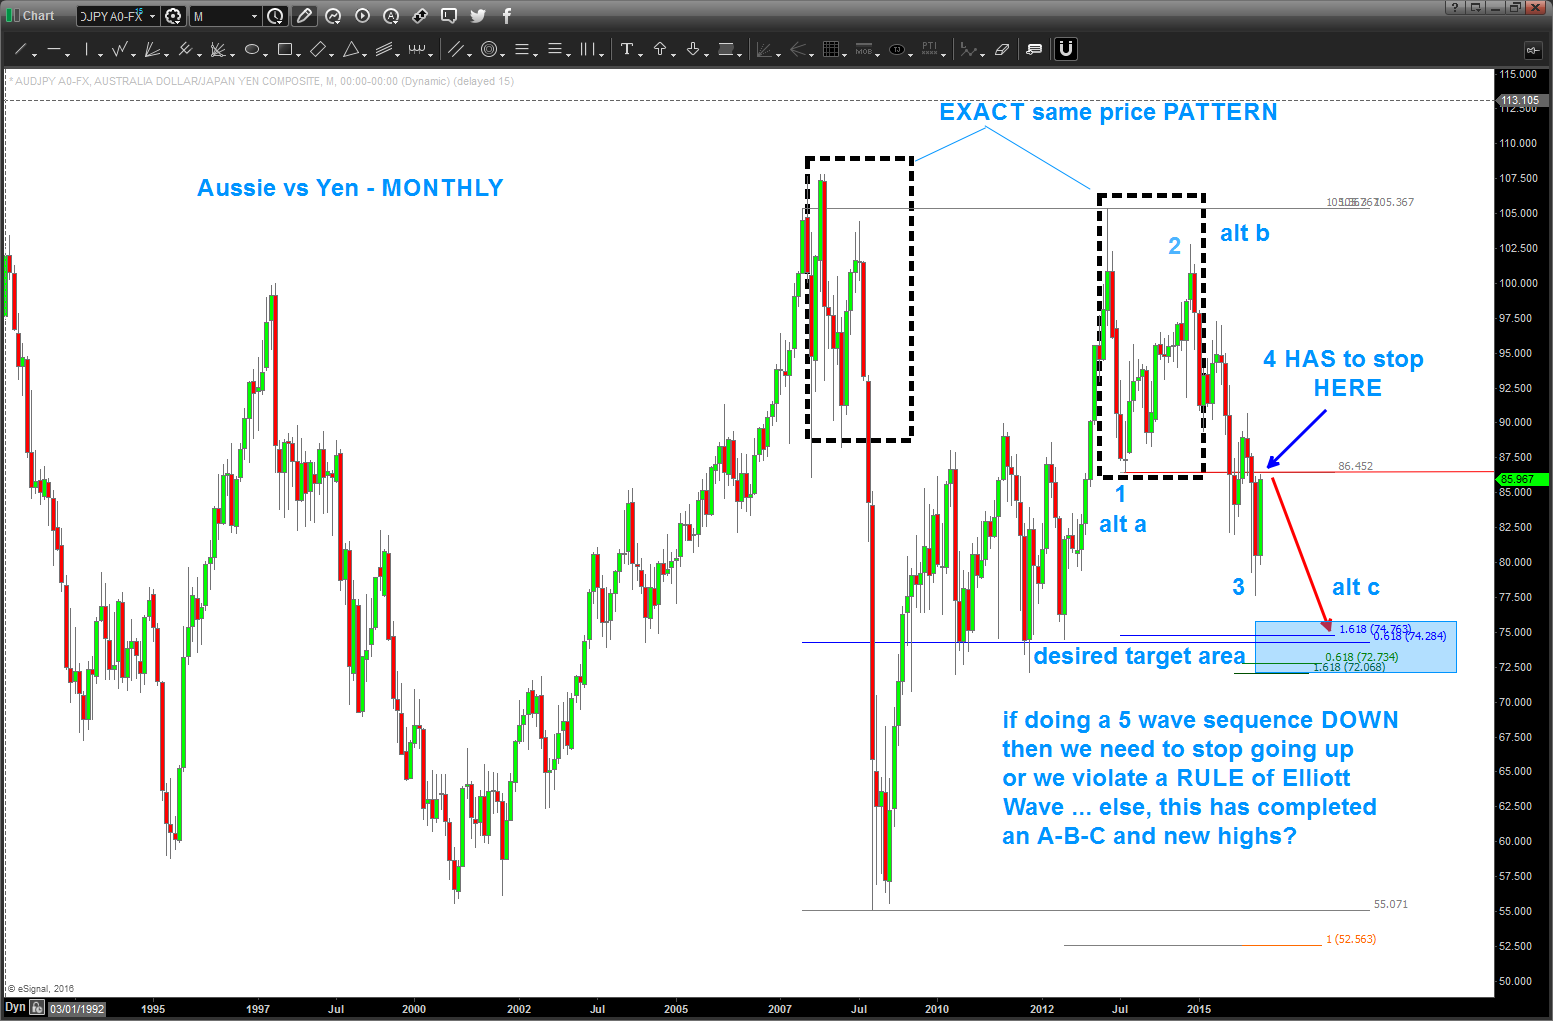
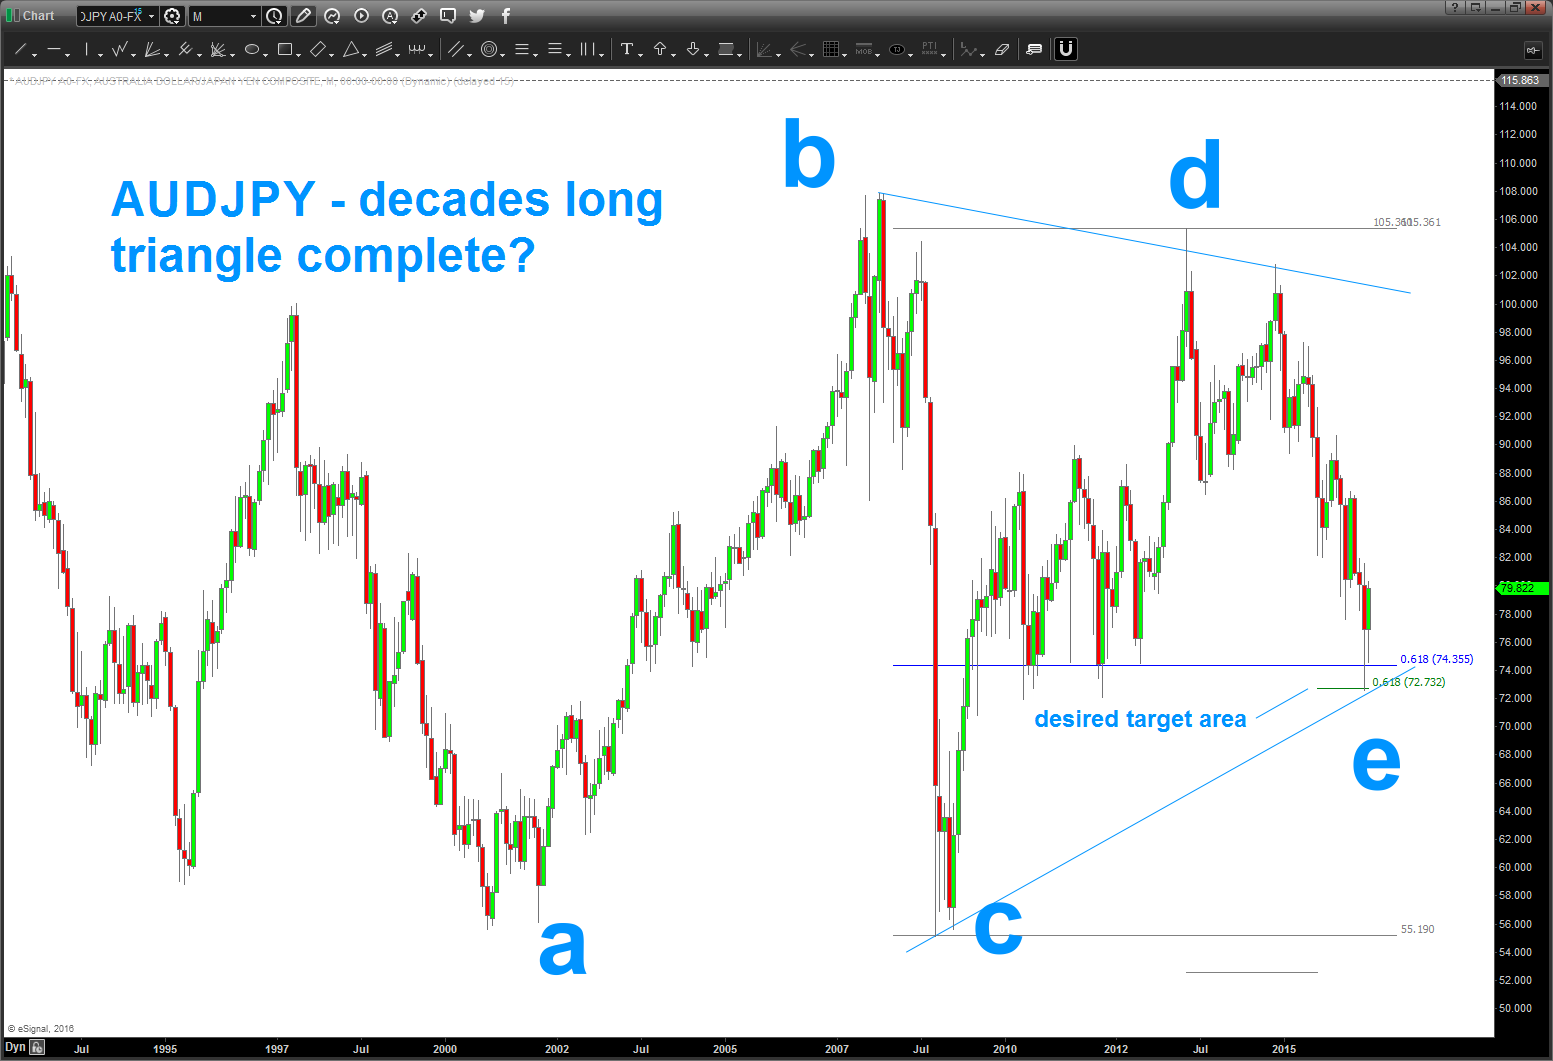
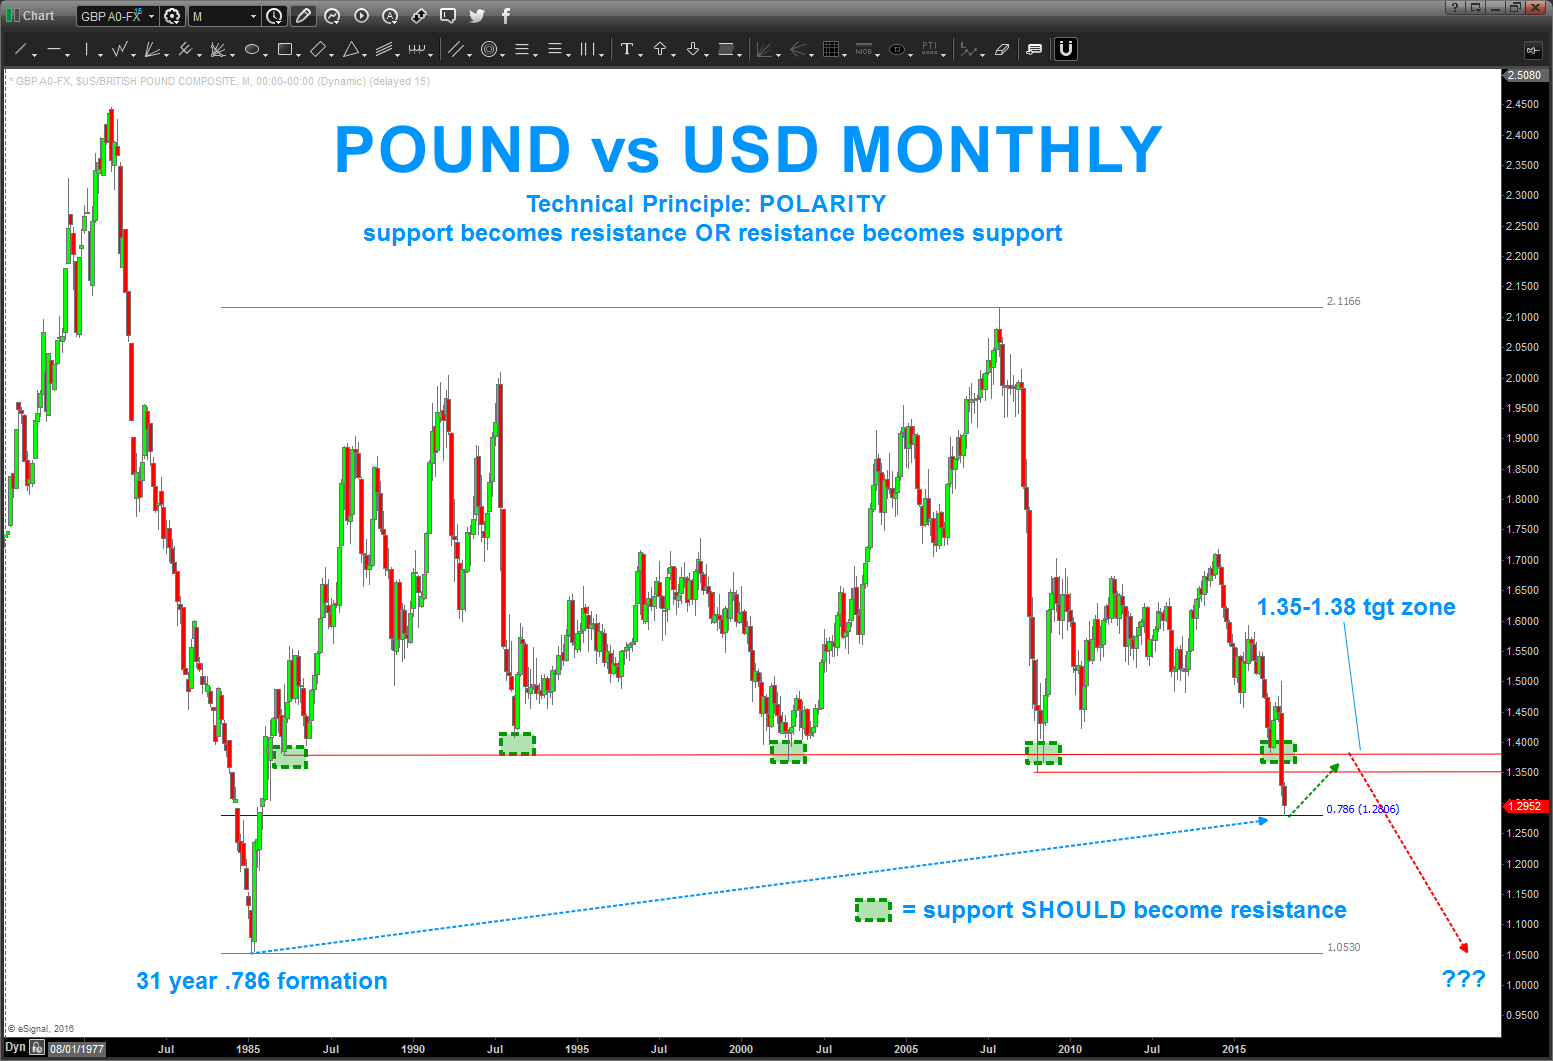
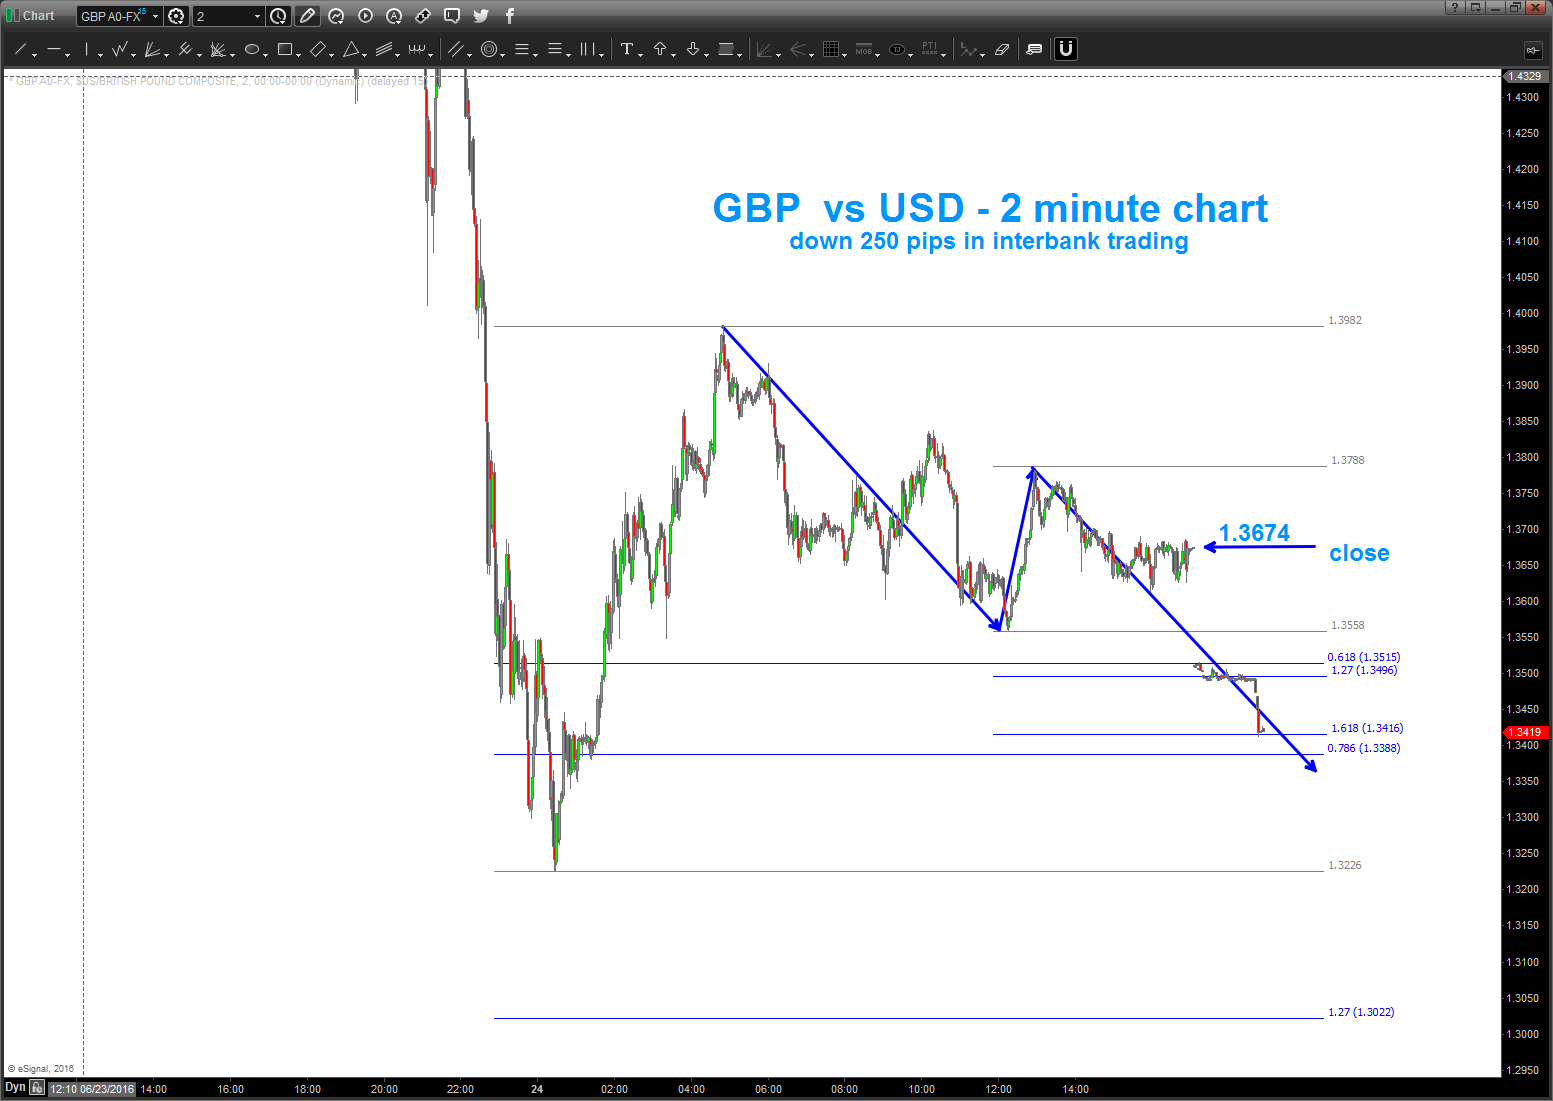
so, the Pound found support on a 31 year .786 retracement…it “should”. But, as we know, it doesn’t have to hold – at all. But so far it has …
now, if you’ve been following my blog you’ll find that this 30 year support in the 1.35-1.38 zone should not become resistance – polarity principle.
as for me, I’m going to look for a buy pattern (nibble) – folks – this is roughly 1000 pips away so, while it doesn’t look like much on the Monthly chart – it certainly could be a sizable rally right into the “wall of china” polarity principle.
hope you had a great week ….get some.
B
dude, cool website. if you want to know how the market works go here …
Posted on July 2, 2016 Leave a Comment
no questions, no issues … amazing website.
it’s ALL vibrations folks …
http://www.roelhollander.eu/en/blog-music/music-composition-math-numbers/
just to show you the connectivity of the NUMBERS, the VIBRATIONS and the MATH ….
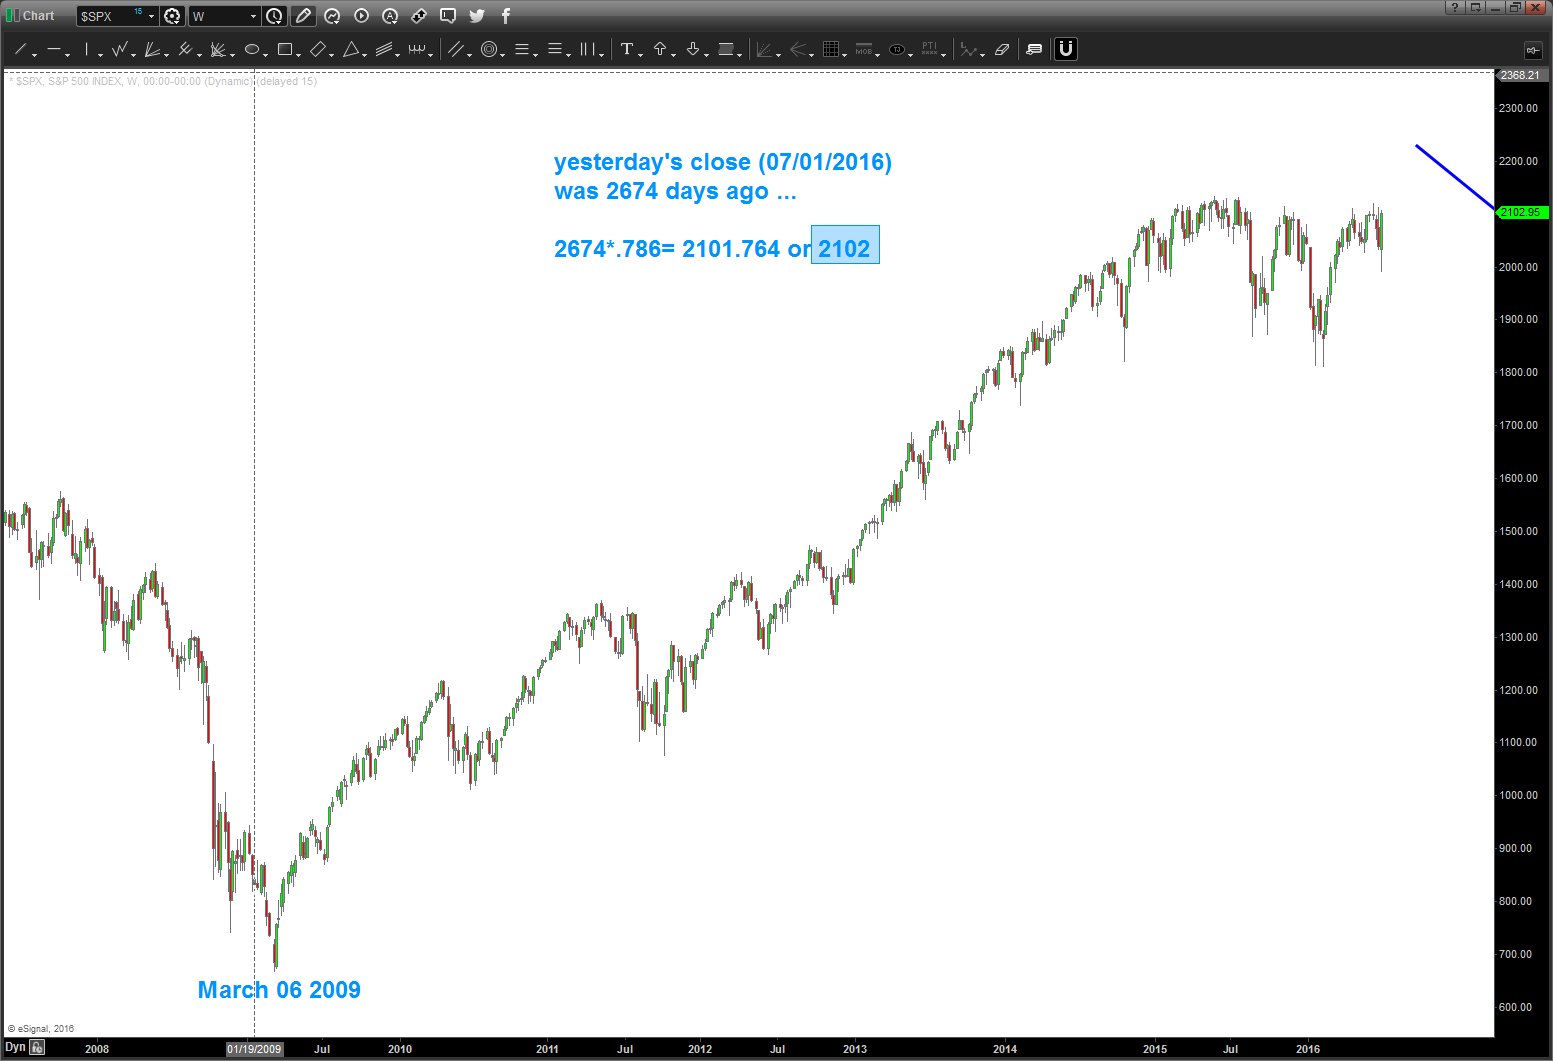
this current leg began March 06, 2009
yesterday’s close was 2,674 days ago.
2674*.786 = 2101.764 or 2102
THE EXACT CLOSE on the cash SPX.
Nothing is by chance … it’s bouncing around to music and vibrations. Our job is to use patterns to put probability in our favor to play in the market.
SIVB harmonics and geometry … can’t get any better than this UPDATE AS OF 06.27.16
Posted on June 27, 2016 Leave a Comment
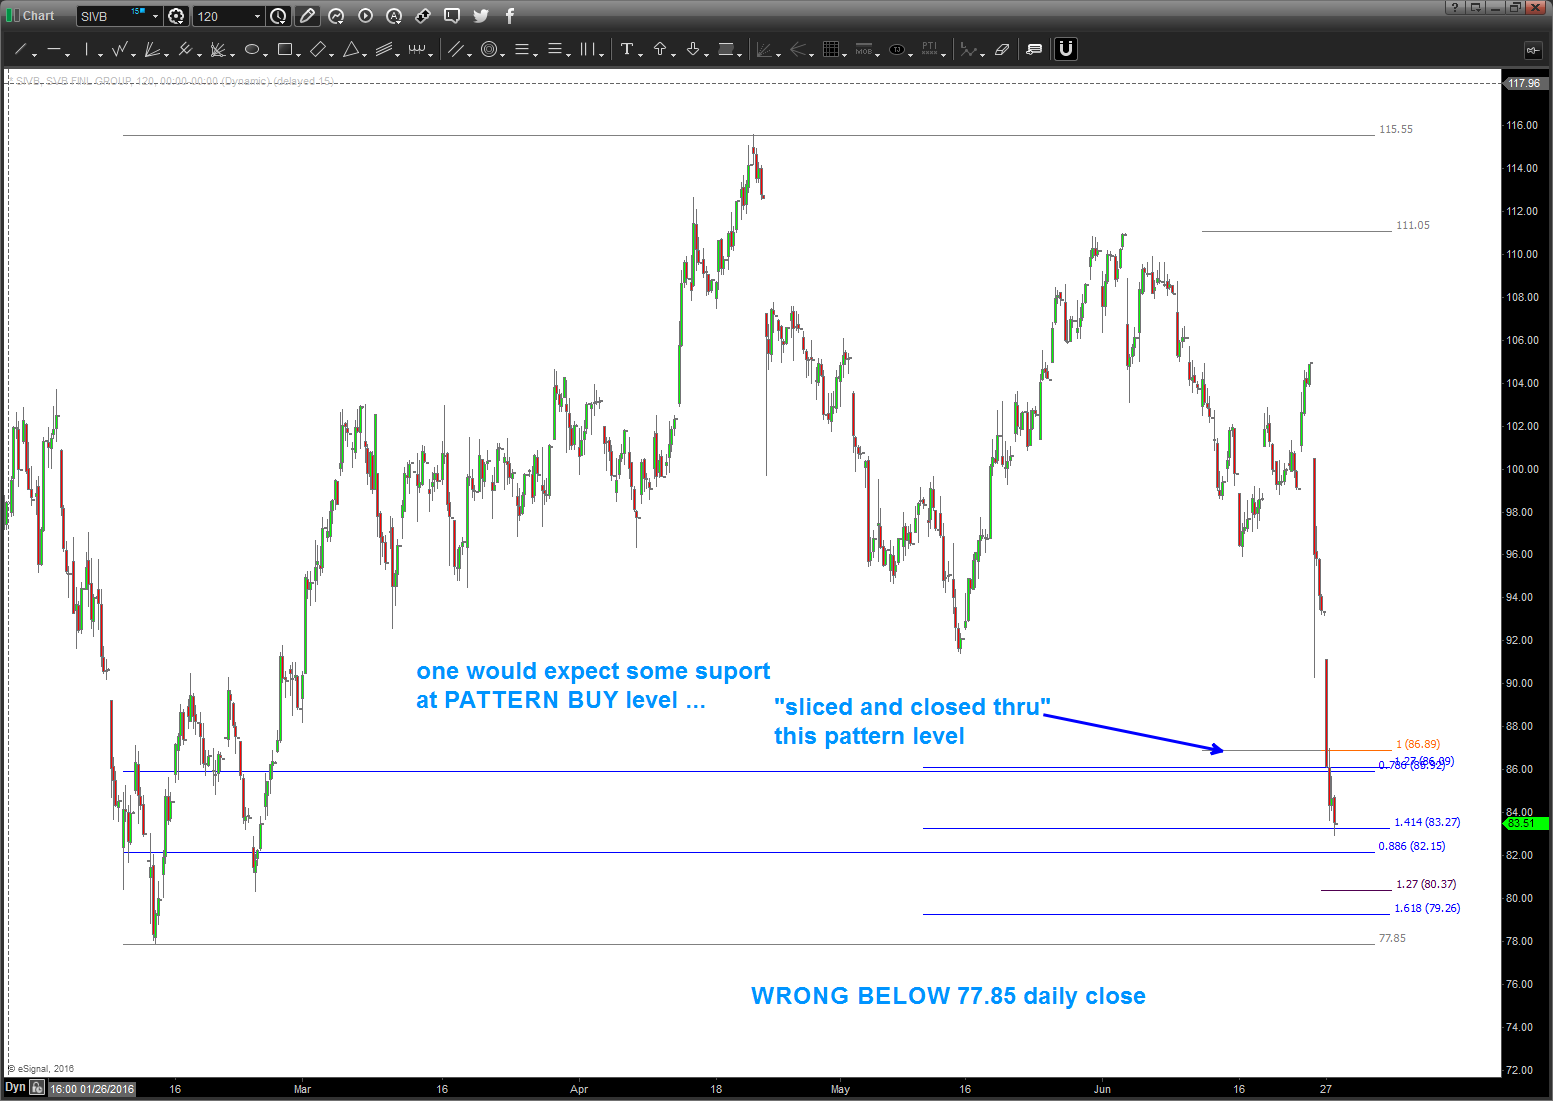
06.27.16 – some strong momentum today caused this pattern to get sliced thru and closed below. would have “hoped” for some strong support. However, there are targets lower – so watch those. also, note the xlp/$nya ratio … the banks will rally w/ any broad equity market rally (or they should) so not ready to call this “done” . For now, a close below the old low on a daily basis makes this wrong.
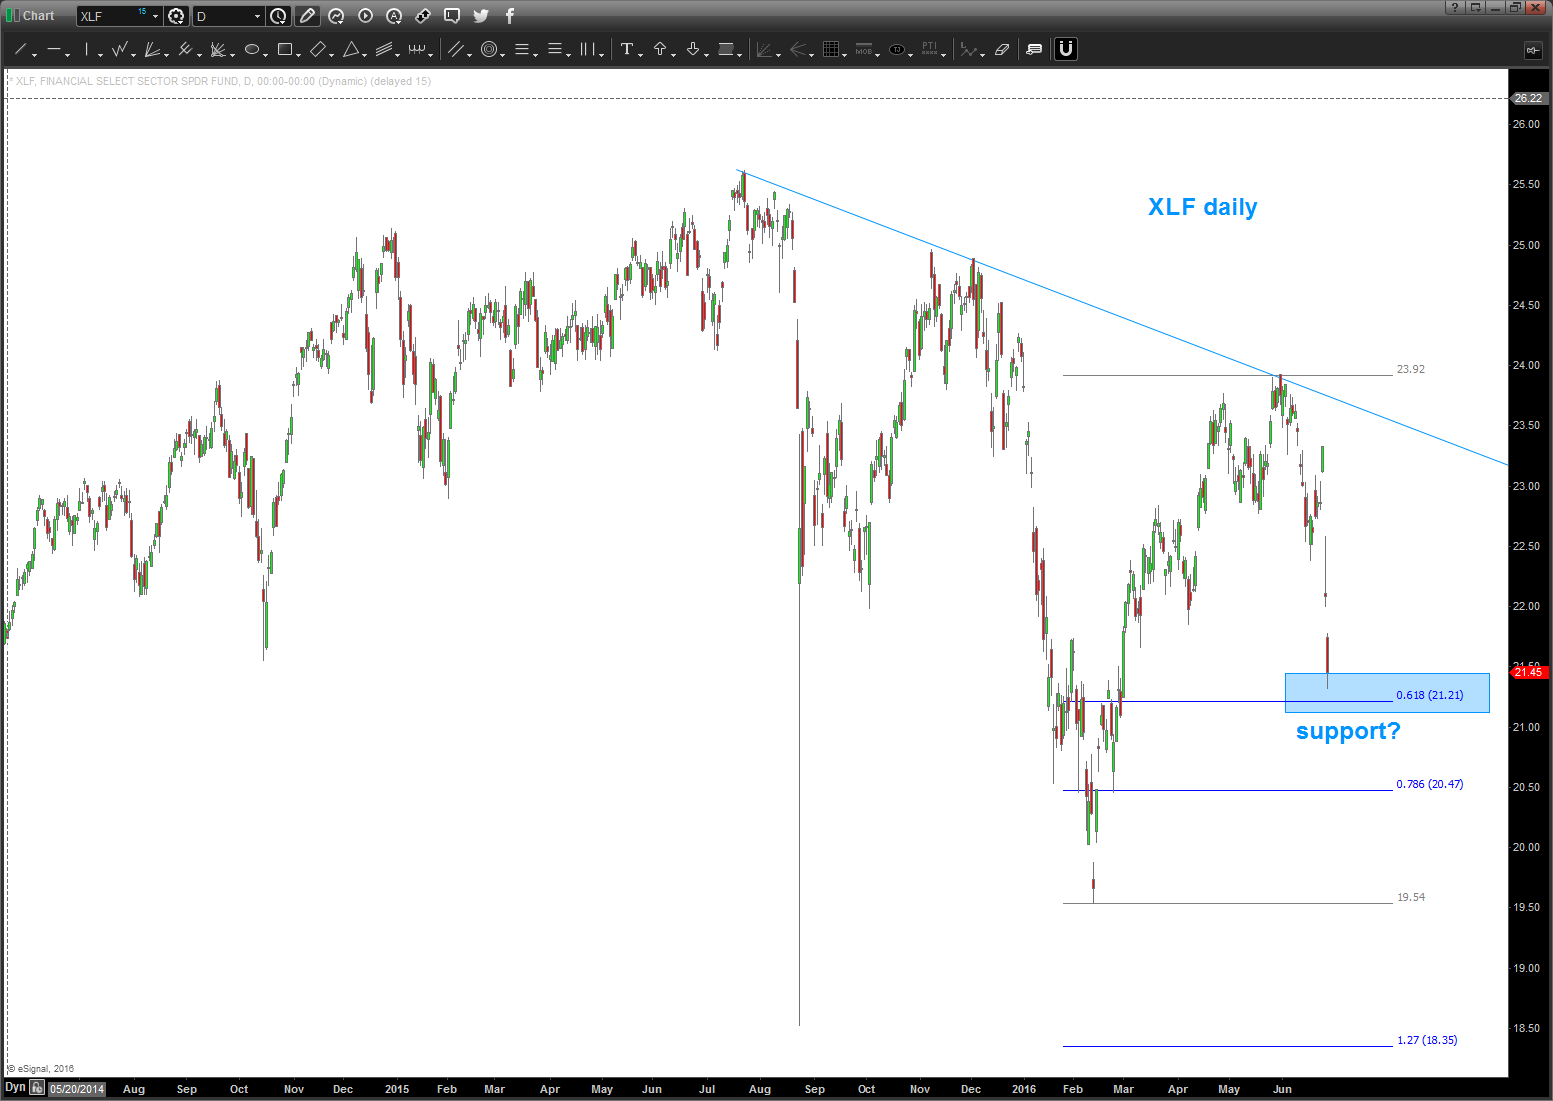
Watch the XLP/NYA ratio, the XLP looking for support at the.618 swing and the lower targets on SIVB before throwing in the towell.
+++++++++++++++++++++++++++++++++++++++++++++++++++++++++++++++++++++++++++++++++++++++++++++++++++++++++++++++++++++++++++++++++++++++++++++
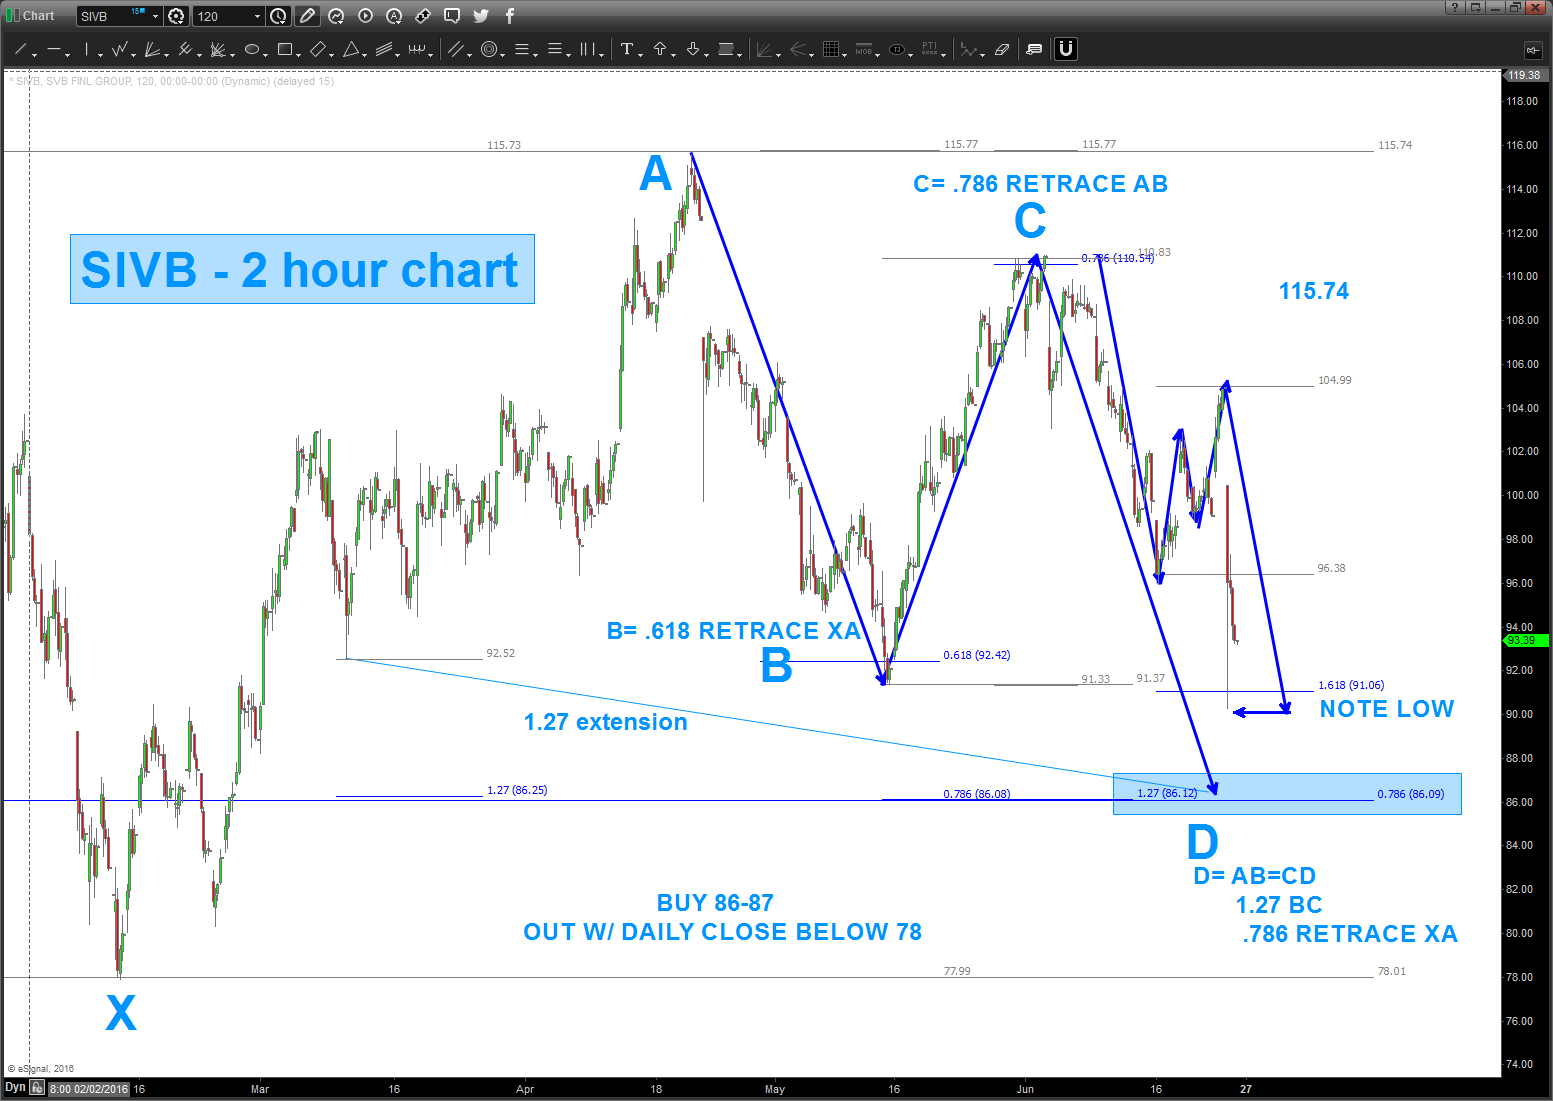
was cruising Stocktwits (@stocktwits http://www.stocktwits.com) and saw Howard had posted SIVB. When I don’t know a stock or ticker I like to go play around. WOW, this is a beauty.
it’s a PERFECT BUY pattern in/around 86.09-86.25. OK, 86-87. check it out …
XLP / $NYA – wow, what a “perfect” sell pattern on the ratio – means BUY equities (if it fails, watch out)
Posted on June 27, 2016 Leave a Comment
here’s the power of this ratio:
- https://bartscharts.com/2016/05/08/xlp-nya-update/
- ratio BOTTOMS, at the BUY pattern of the ratio – SELL equities
- https://bartscharts.com/2016/03/30/xlp-nya-update-pay-attention/
- when the ratio TOPS then BUY equities
- we have a wonderful SELL the ratio pattern which means Equities should be bottoming for a BUY swing trade of the US equity structure.
DANGER WILL ROBINSON … if/when the patterns fail (and they do) the market breathes in the direction of the failure. Note, we have some VERY strong thrust into the pattern level and this “usually” means the pattern will fail BUT you never know do you? So now for the best part of the pattern recognition world the “if-then”.
IF the pattern works, equities should bottom for a nice BUY (swing trade – not long term for now … )
IF the pattern fails, equities will continuing selling off and we should look for the NEXT pattern to play … make sense?
Here’s the “perfect” sell pattern:

SIVB harmonics and geometry … can’t get any better than this
Posted on June 26, 2016 Leave a Comment
was cruising Stocktwits (@stocktwits http://www.stocktwits.com) and saw Howard had posted SIVB. When I don’t know a stock or ticker I like to go play around. WOW, this is a beauty.
it’s a PERFECT BUY pattern in/around 86.09-86.25. OK, 86-87. check it out …

