Natural Gas (NATGAS) NG #F
Posted on July 31, 2016 Leave a Comment
folks, for those of you have been following me for a while you know that sometimes you eat the bar and sometimes the bar eats you. (man I love that movie … the Big Labowski)
anyway, the “bar has eaten me” on Natural Gas. I played w/ a foldback pattern that REALLY looked nice and it basically failed below the levels – BUT the PATTERN still appears to be working …perhaps?
either way, I think we have a big low in place on Natural Gas and I haven’t looked at it for a WHILE after it kicked my butt. looking at it today – I see another potential foldback potential.
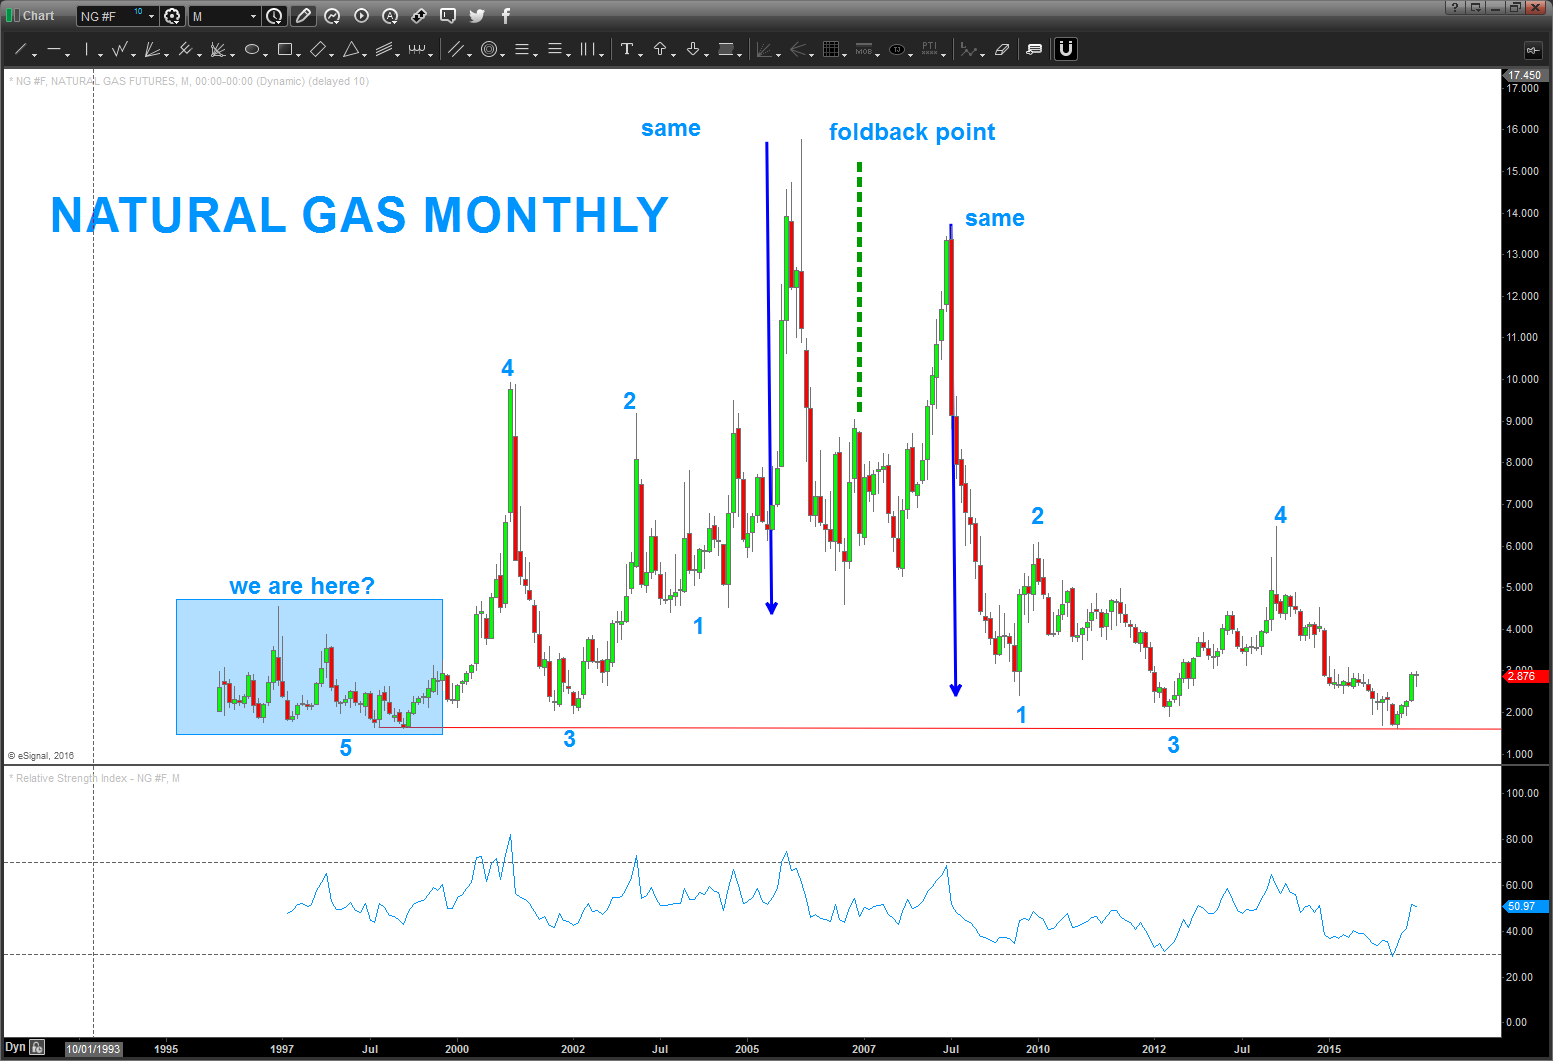
man, I wish I had more data on Natural Gas prices …
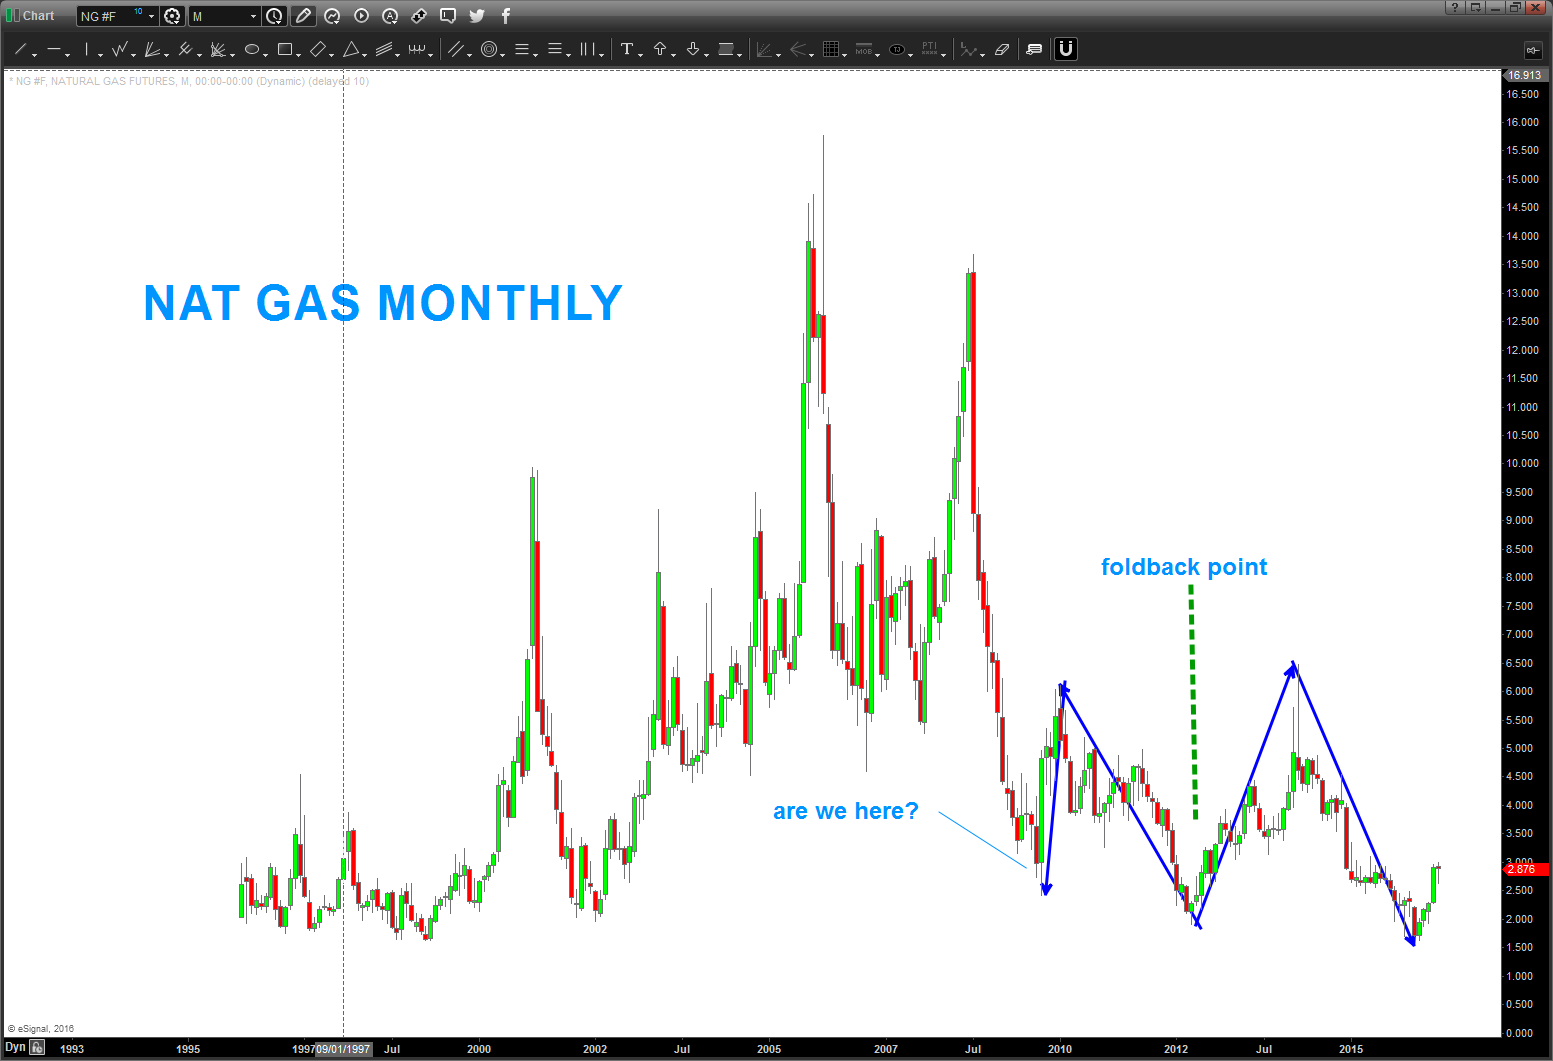
here’s the “other” foldback that kicked my ass …the form and symmetry sure look nice, don’t they? If right, natgas is about to rip higher ..
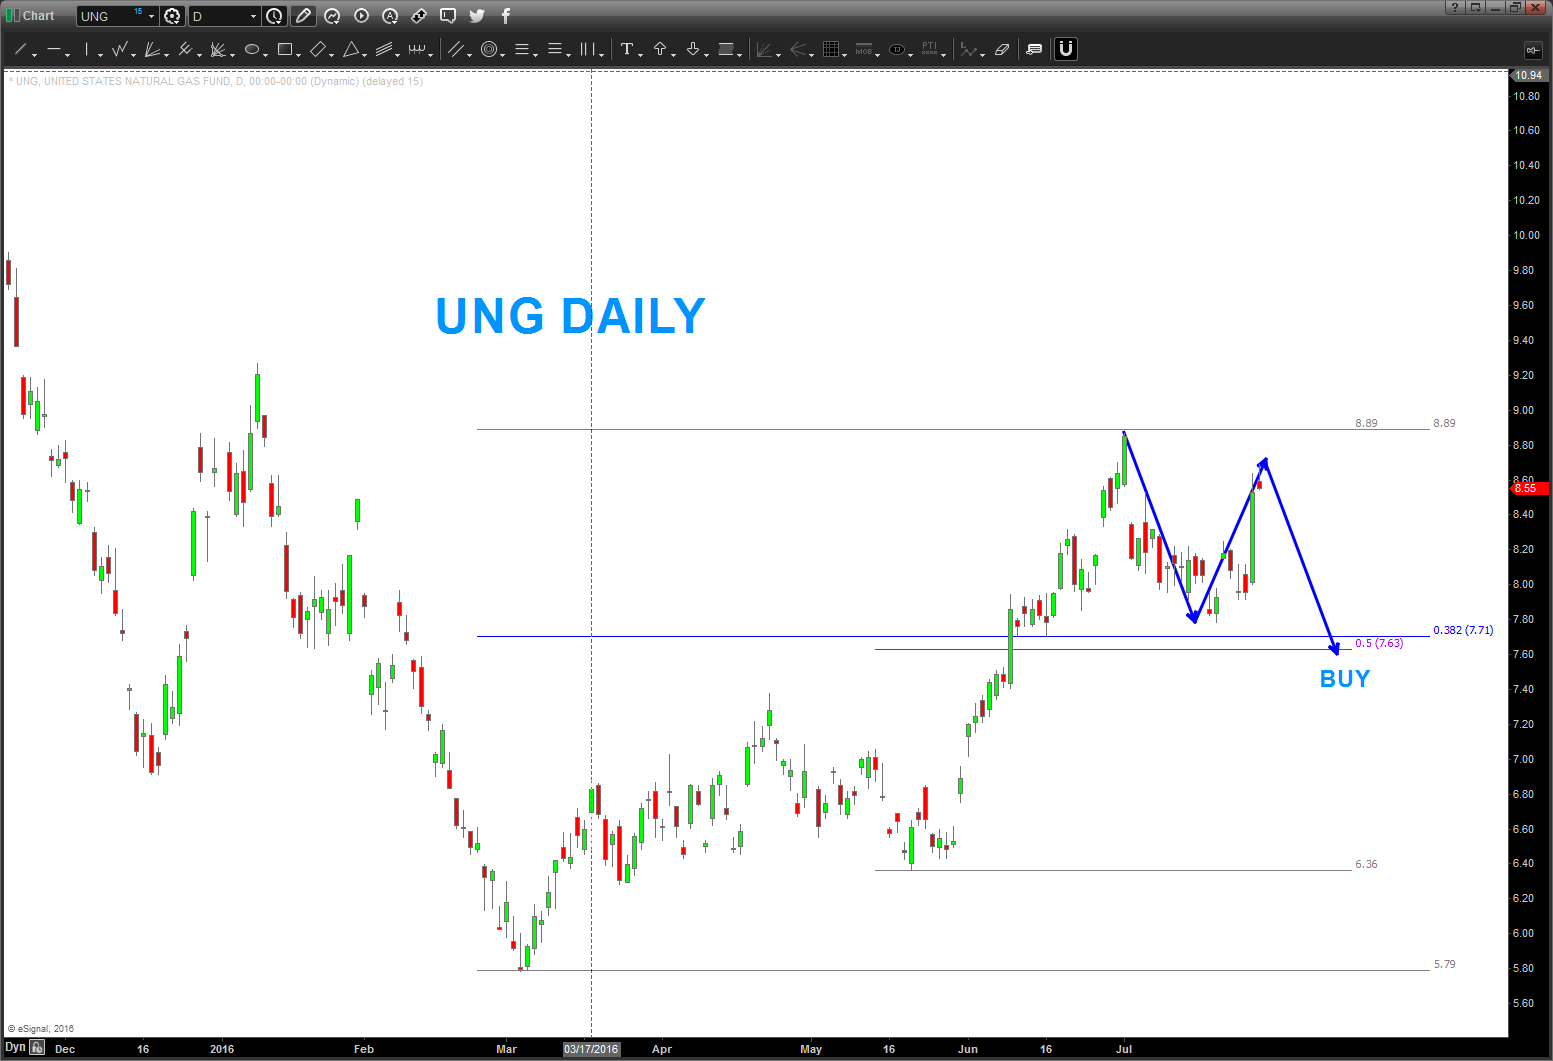
here’s a look at $UNG
LONG BOND since 1981
Posted on July 31, 2016 Leave a Comment
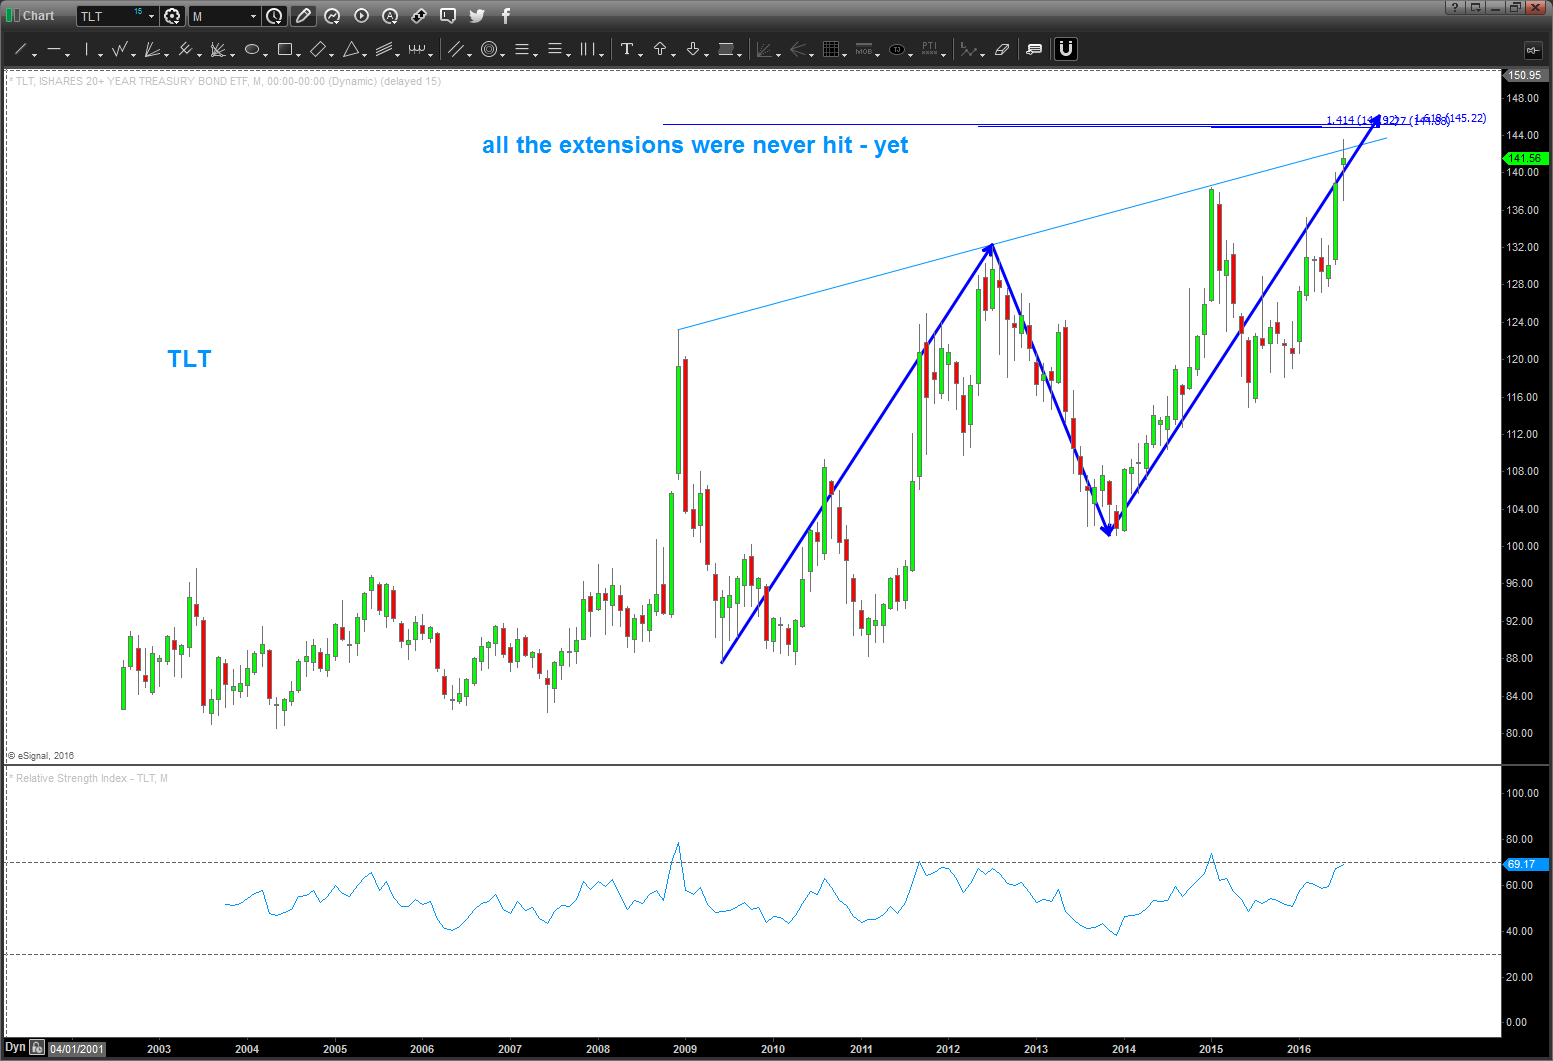
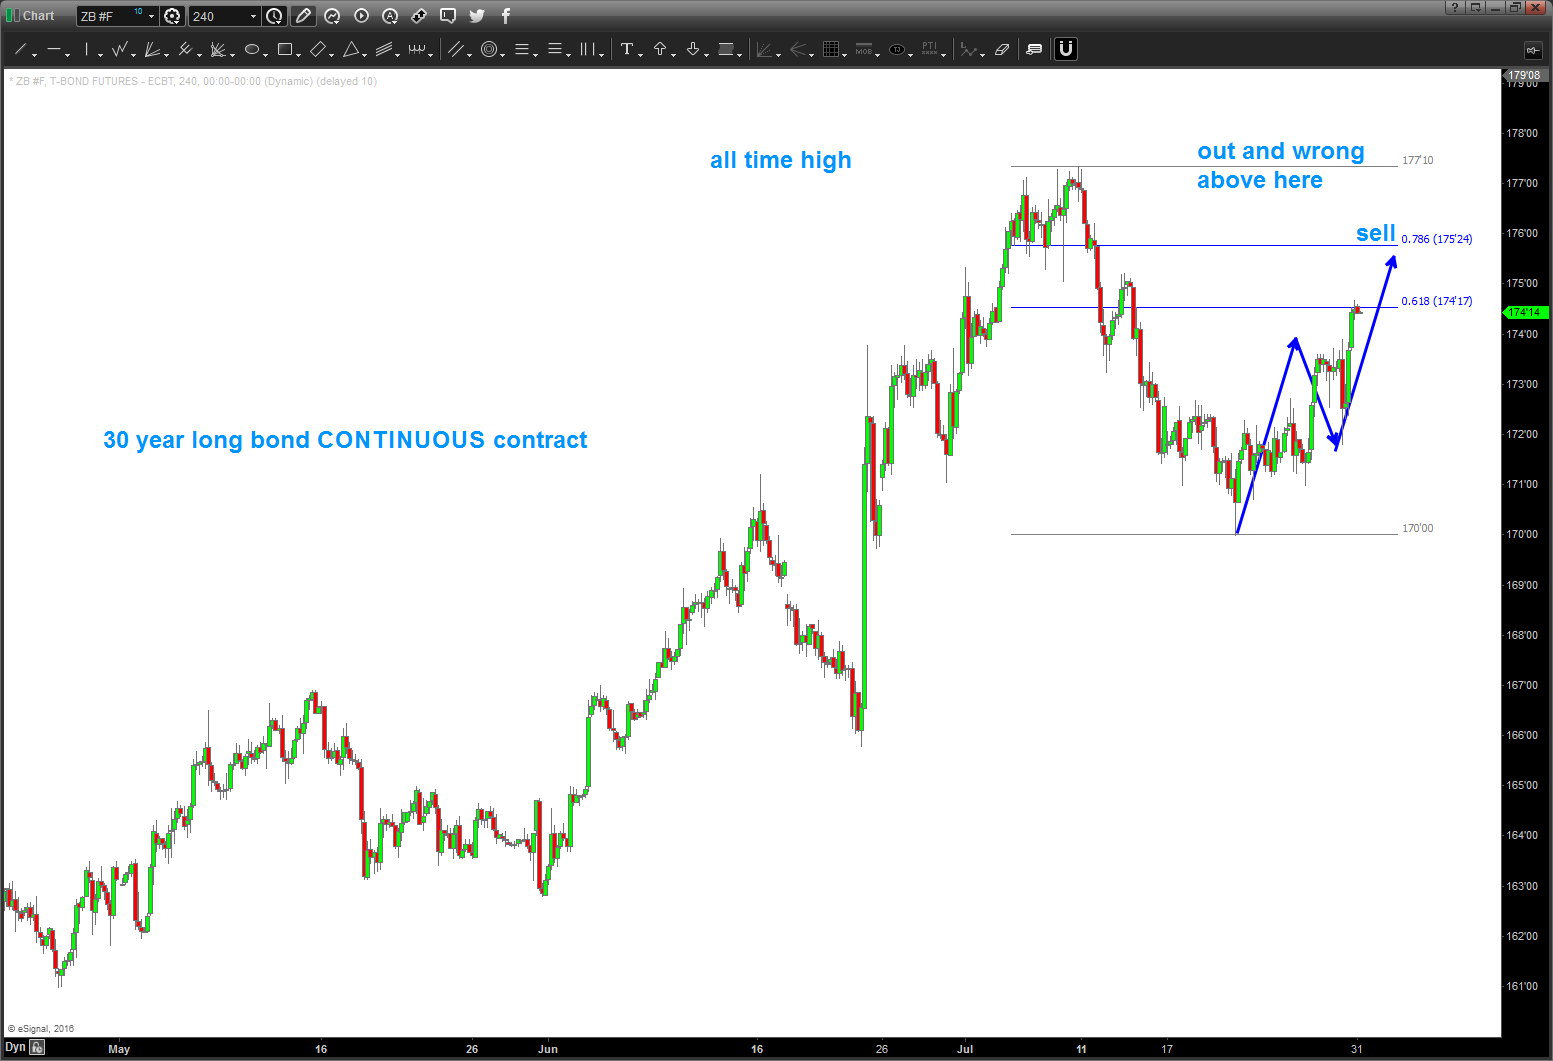
i did this post for @seeitmarket around the TLT (long bond (20 year +) ETF: http://www.seeitmarket.com/tlt-price-target-view-treasury-bonds-stretched-15862/ and the targets around 145 still loom ….
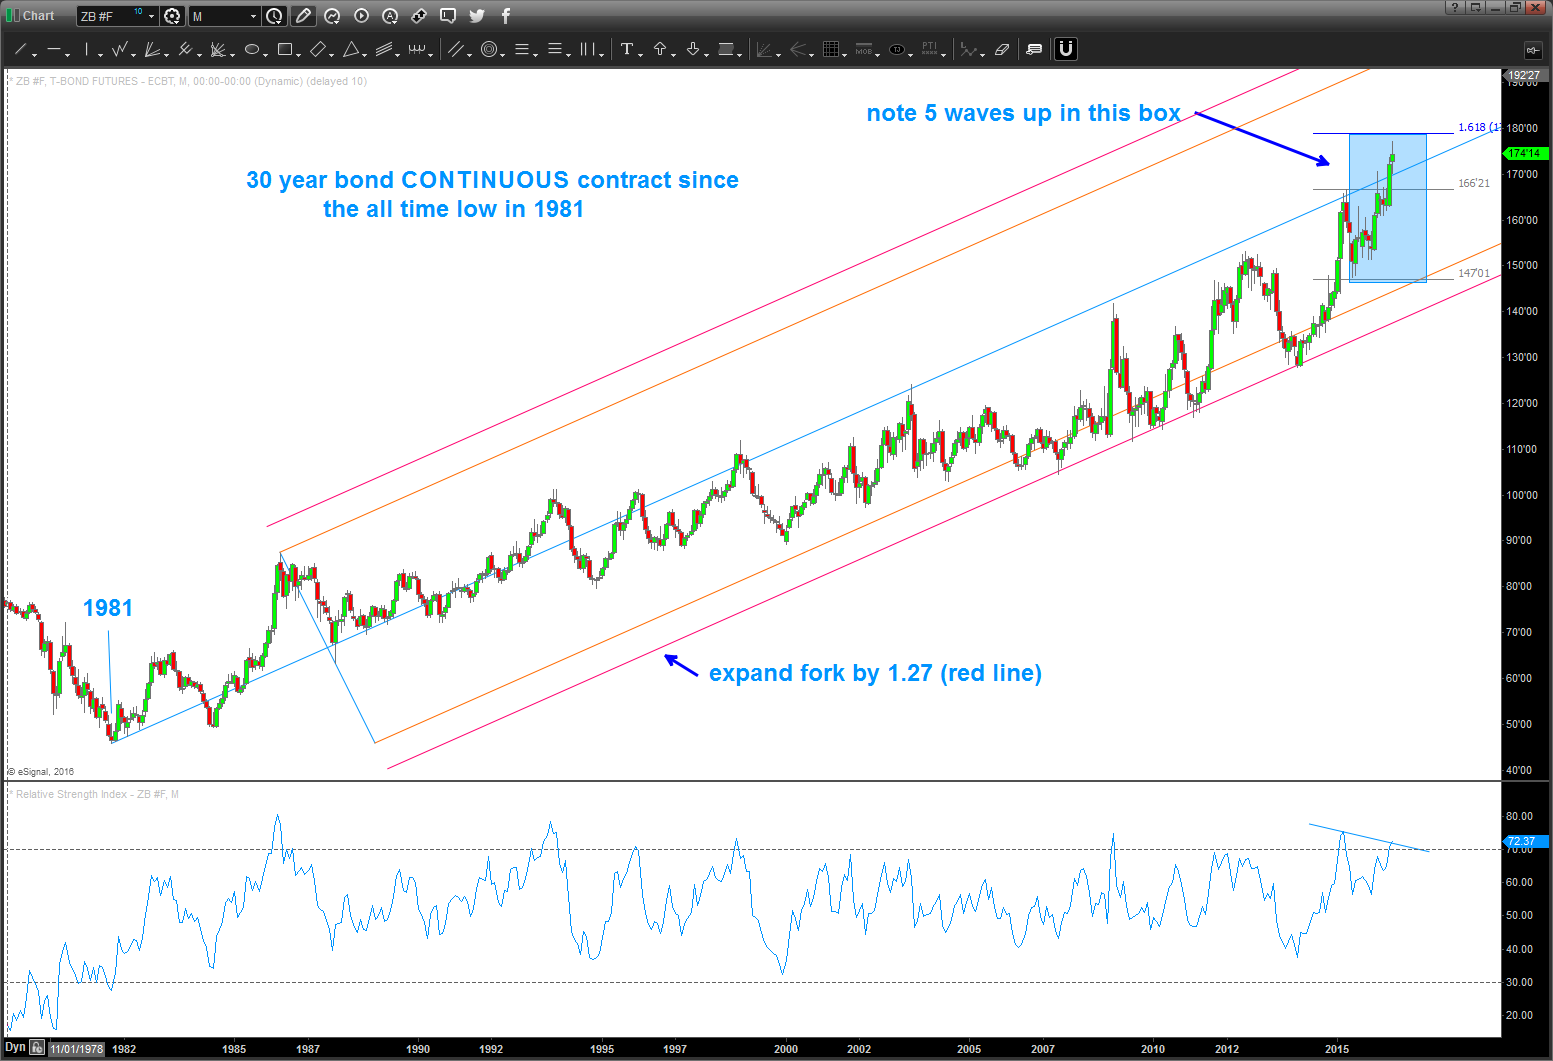
so, here’s the long bond and the TLT charts ….not trying to “call a top” just find patterns. could they keep going higher? well of course ..but man, this is really getting quite crazy now, isn’t it?
note, on a monthly you can see 5 waves completing (30 year continuous) and that should mean a pullback but is it the 5th of the 5th? who knows …
$LIT – Lithium ETF
Posted on July 31, 2016 Leave a Comment
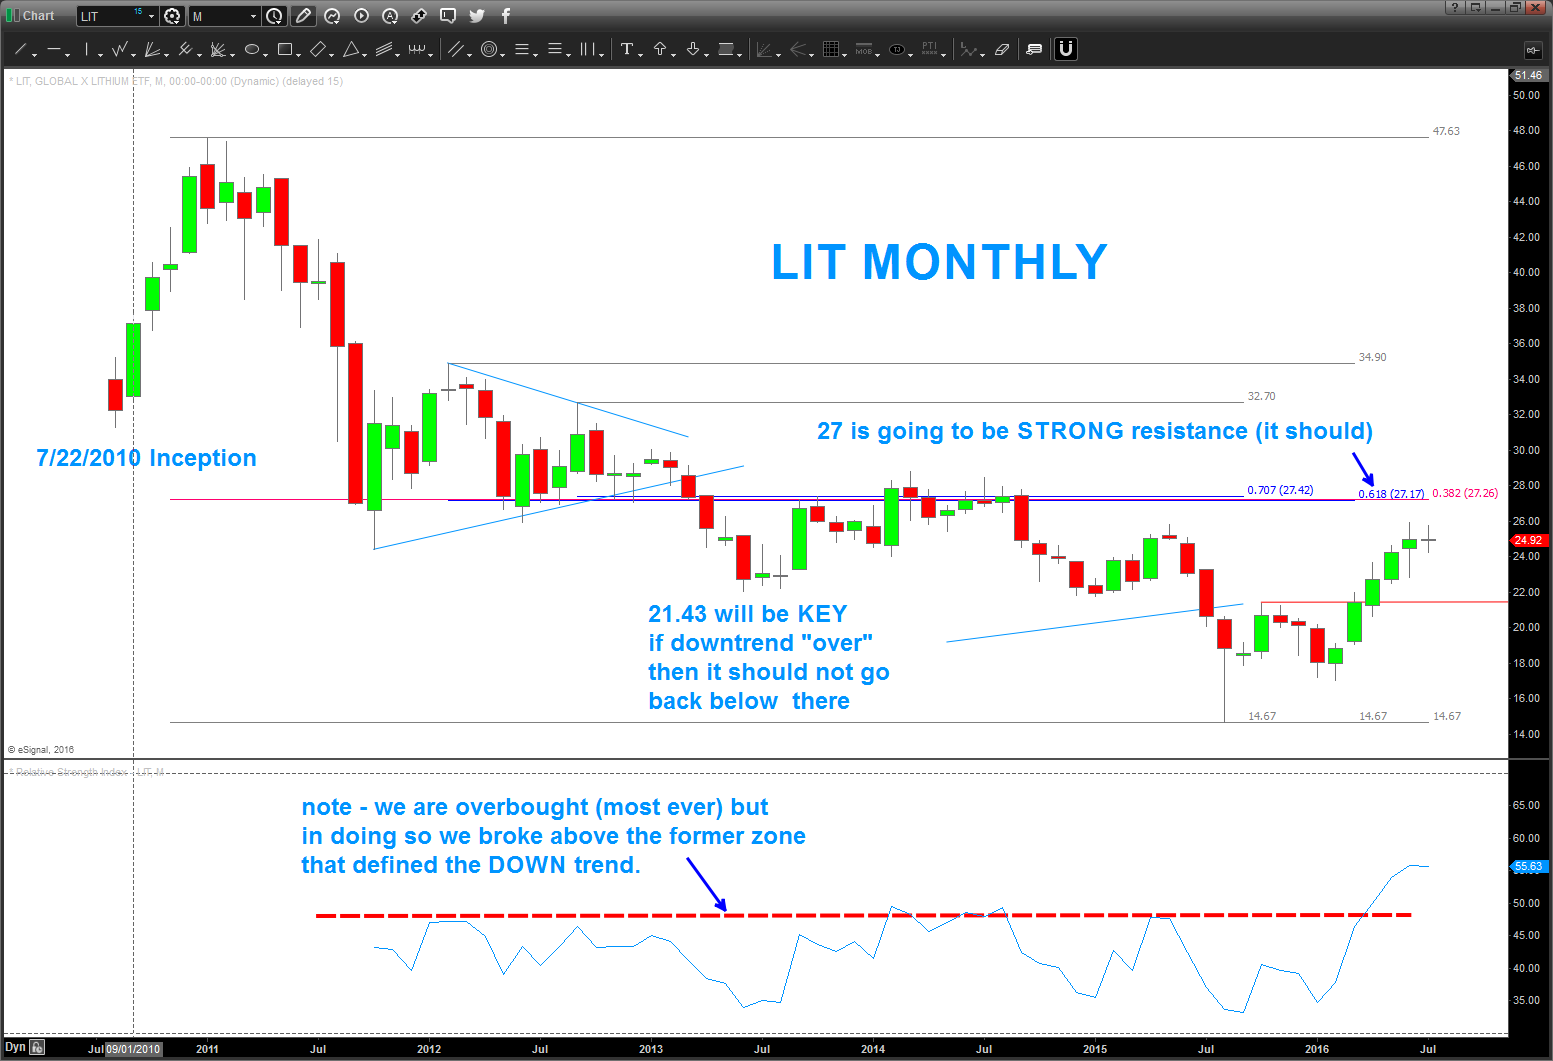
i expect consolidation in/around here w/ 27 being the overlapping of 3 ratios and it SHOULD be resistance.
the key here is the level of the RSI – have we broken out into a new RSI zone that defines a bull market? also, if this is the case are we finishing up 3 on the way up? if we are then this pullback needs to remain above 21.43 as 4 can’t overlap 1.
either way, I expect a pullback here or a little more higher … then it will get VERY interesting.
note the 21 level -some nice overlapping ratio’s, a measured move like the last correction – could be a nice spot to get long
didn’t know there was an ETF for Lithium.
hope this helps.
B

$WFM …an update from 11/03/2015
Posted on July 24, 2016 Leave a Comment
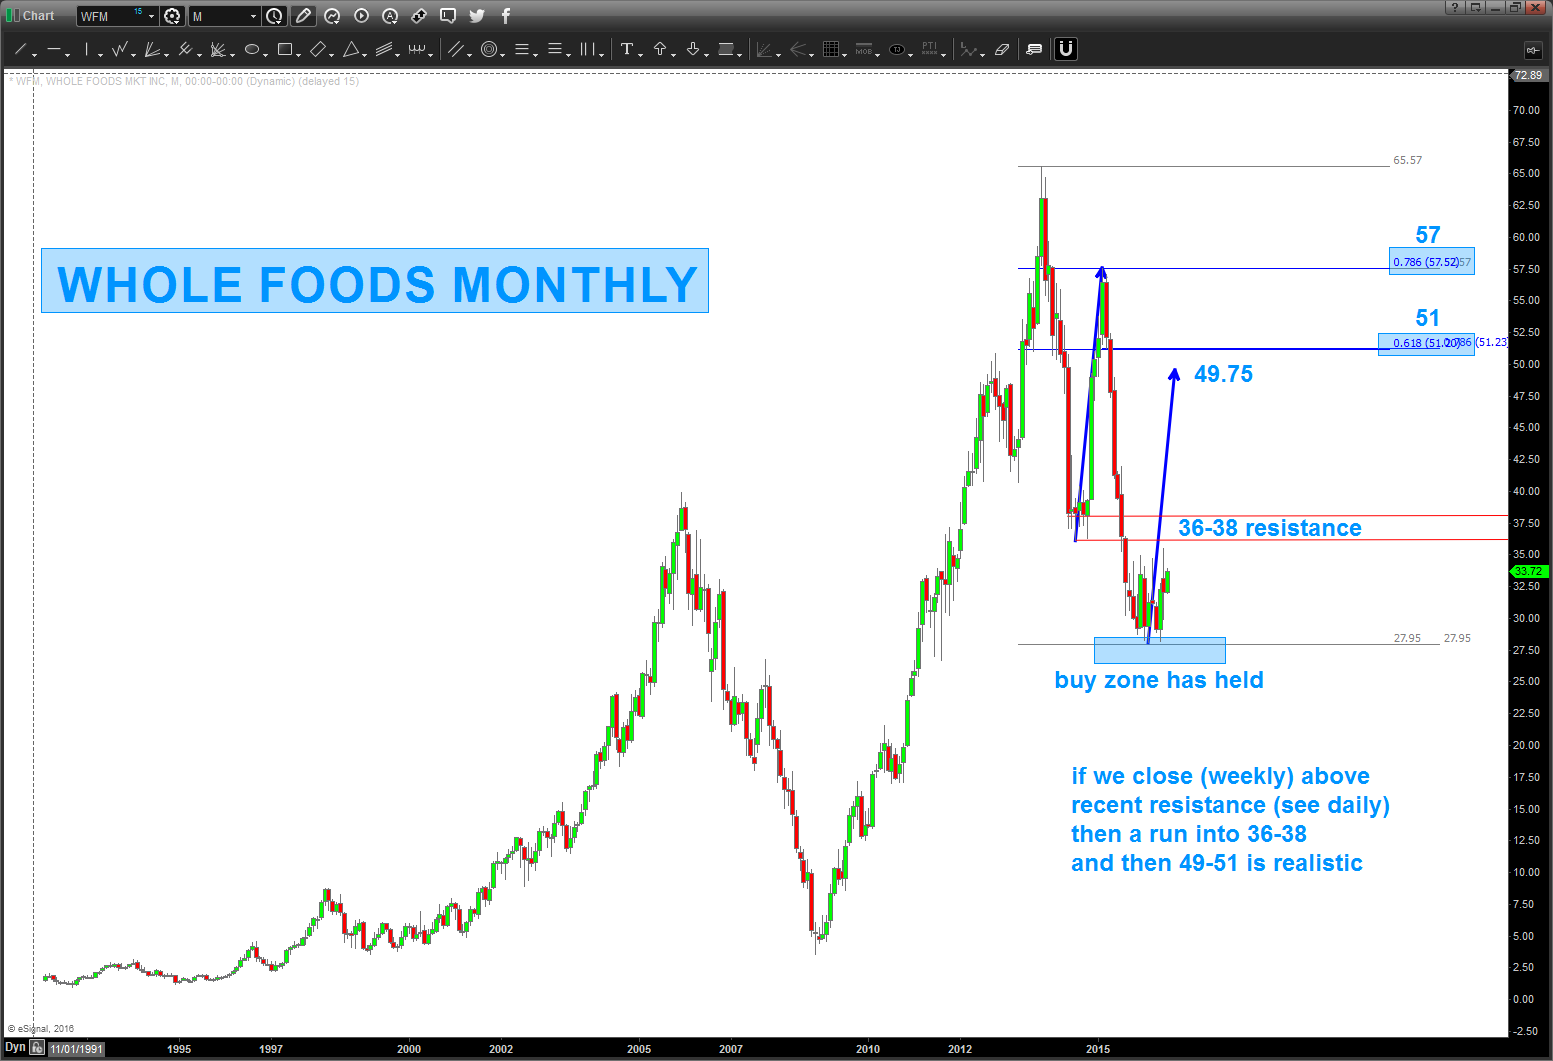
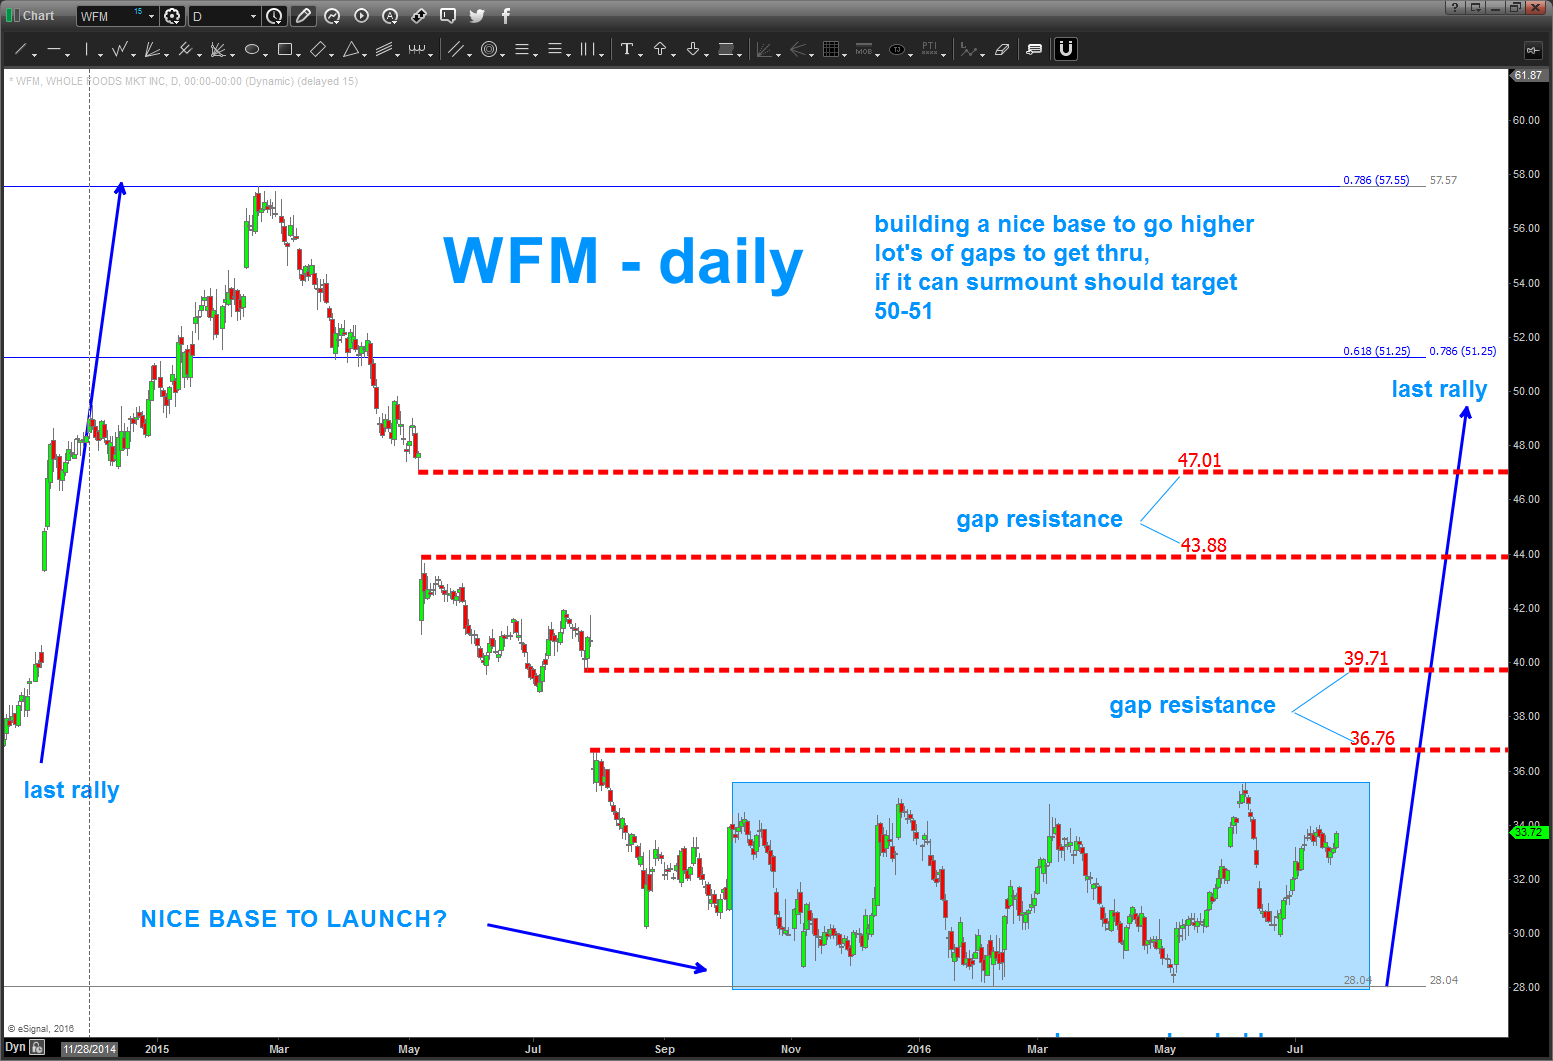
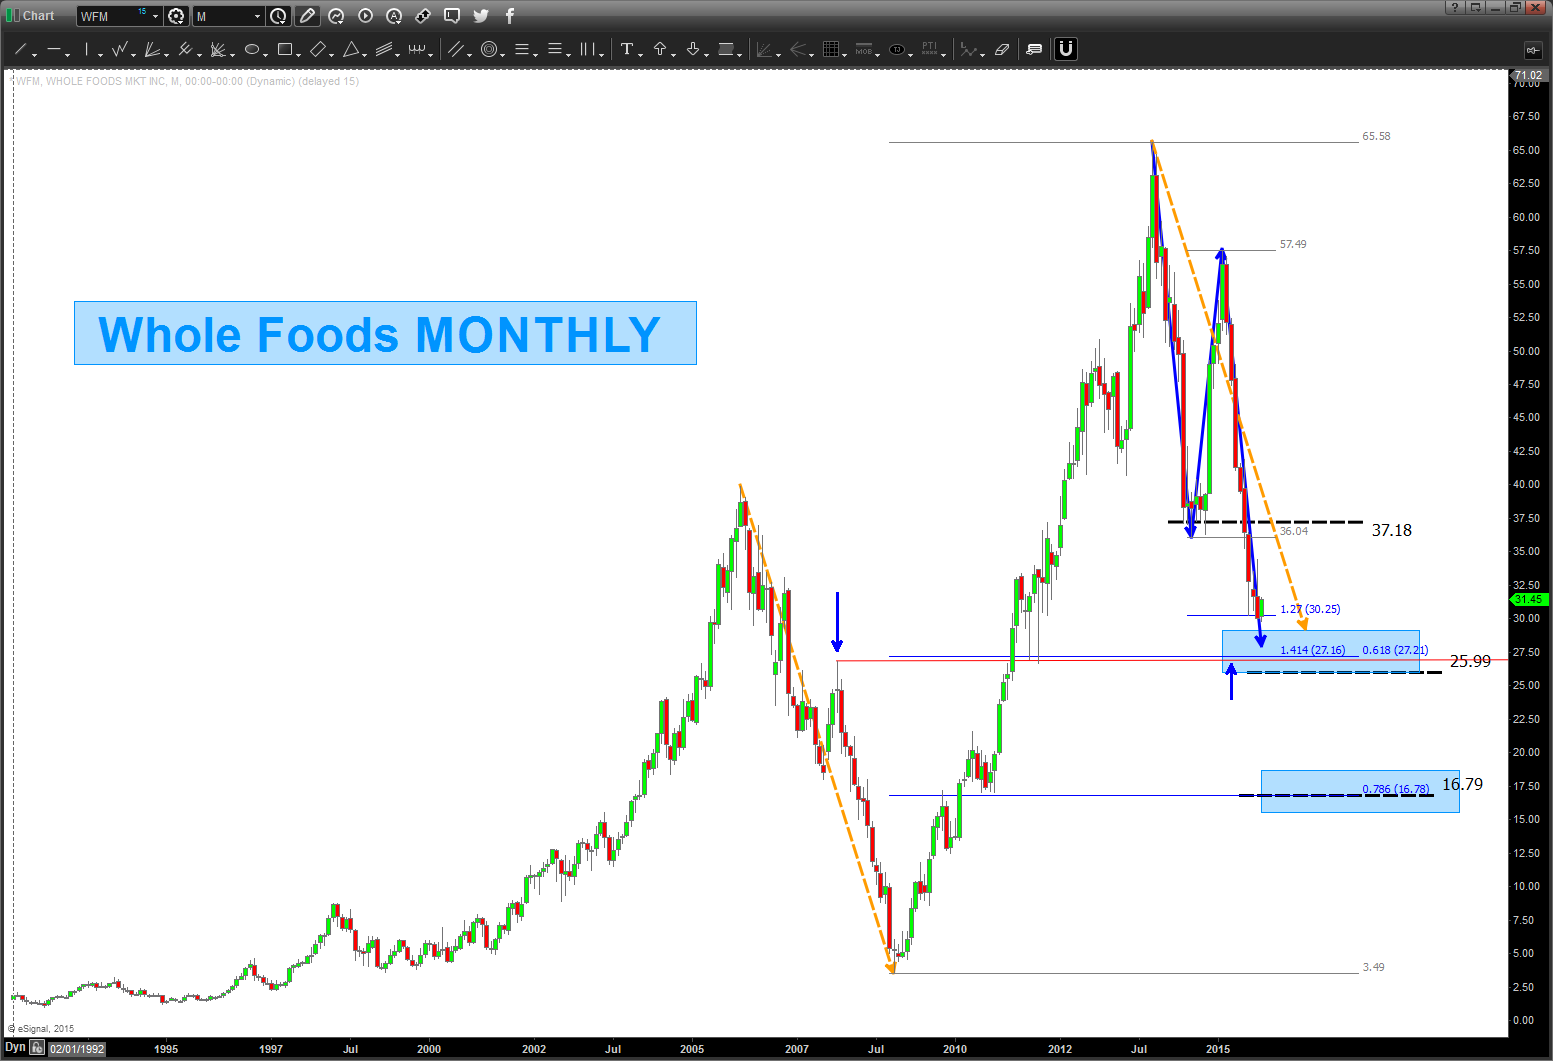
07/24/2016 – appears to be building an ice base to attack daily gap resistance levels and perhaps roll into higher levels. a daily/weekly close back below 28 signals a failed pattern and this analysis is wrong.
here was another update: https://bartscharts.com/2015/11/04/wfm-update/
hope this helps my life long friend … see you in San Diego dude!
Bart
I enjoy listening to JC Parets (@allstarcharts) (www.allstarcharts.com ) as he’s entertaining as hell and also knows his stuff. I blame him for getting me blogging and haven’t looked back since …he’s introduced me to blogging, google hang out, twitter and now periscope. today, was doing some emails and “periscope” popped up that he was cruising the charts so I simply hit the app and was immediately logged onto his computer screen where he was pushing some charts around.
one of the charts – Whole Foods. Besides something about overhead supply, divergence, moving averages and stuff like that I called up the chart on a monthly and saw a PERFECT BUY PATTERN.
- note the blue arrows – projects into 27.94
- but more importantly, note that they are equal in PRICE and TIME right in/around here.
- note the extensions (sitting on the 1.27 extension right now)
- 1.4142 extension hits right on the .618 retrace (that’s good) at 27.16-27.21
- last, look at the dashed orange line .. it’s a measured move which represents the largest corrective move since the all times lows in the early 1990’s
So, sure looks like it “should not” go thru 27 so it presents a nice risk reward.
how about some math?
- (square root 65.58-2)^2 = 37.18
- (square root 65.58-4)^2 = 16.79 (right on the .786)
- (square root 65.58-3)^2 = 25.99
so, we have a LOT of thrust coming into this level but a lot of math is coming into play in/around 26-27.
thanks JC!
Bart
$CELG
Posted on July 24, 2016 2 Comments
was asked to take a peak at CELG …
some things to consider:
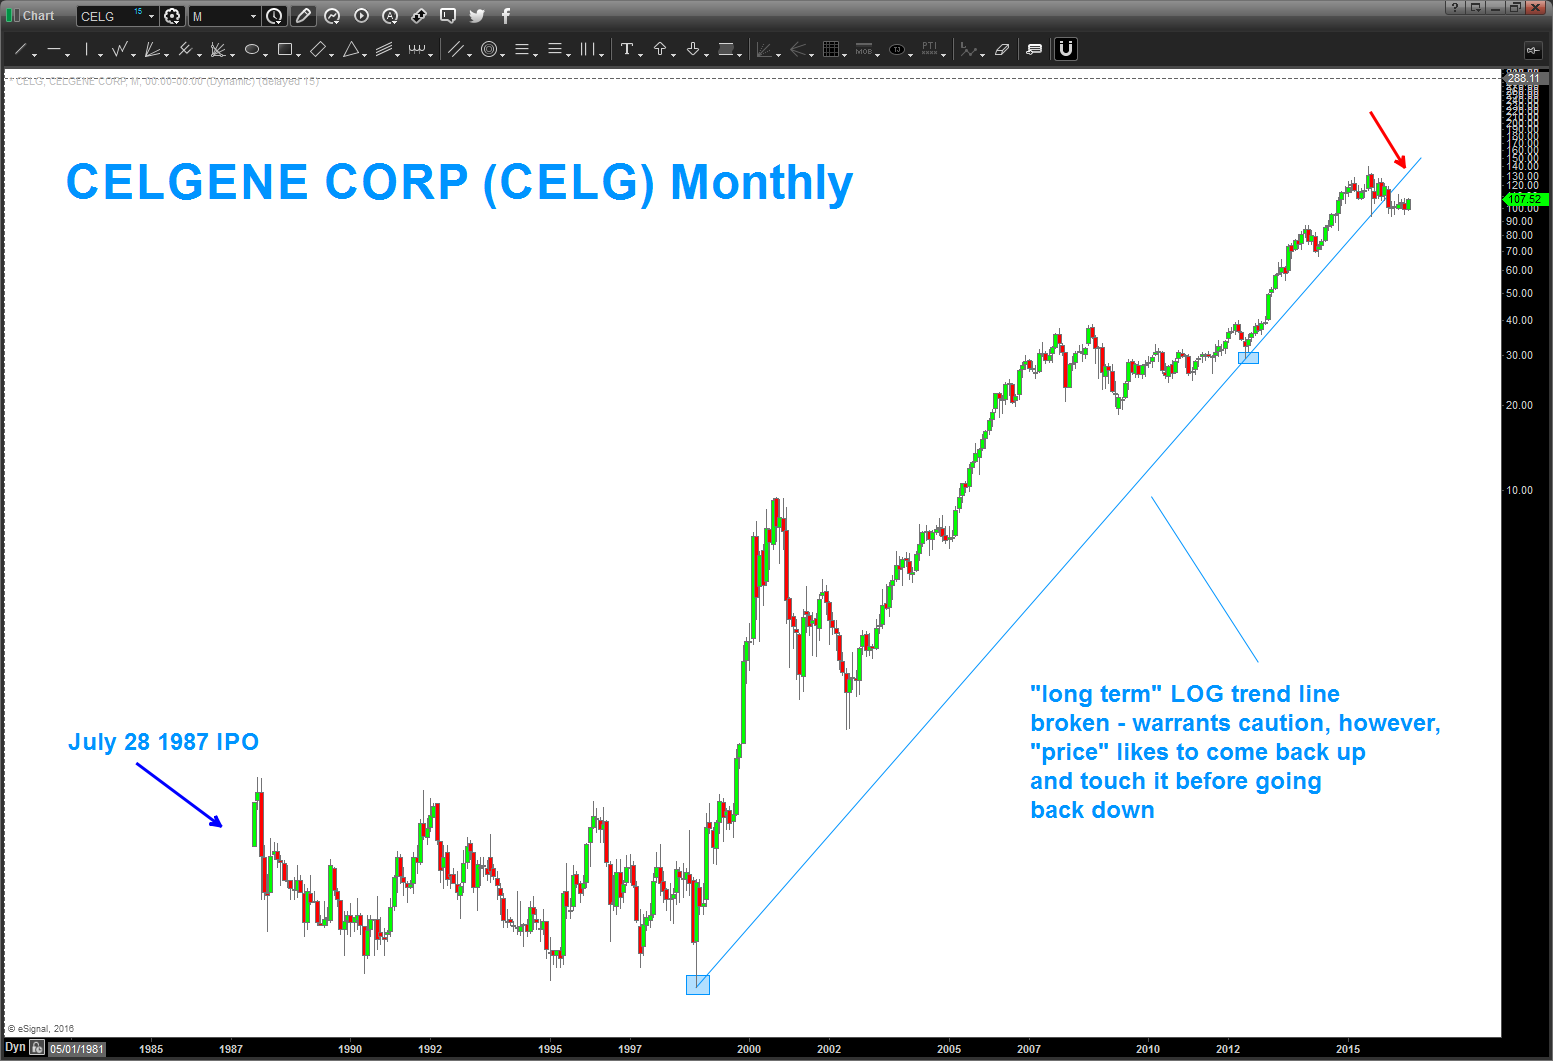
- note the “long term” LOG trend line that was broken. that, in and of itself represents a breakdown or loss of strength in the underlying trend. IT DOES NOT mean it can’t go higher, it just means that the acceleration/growth has dissipated.
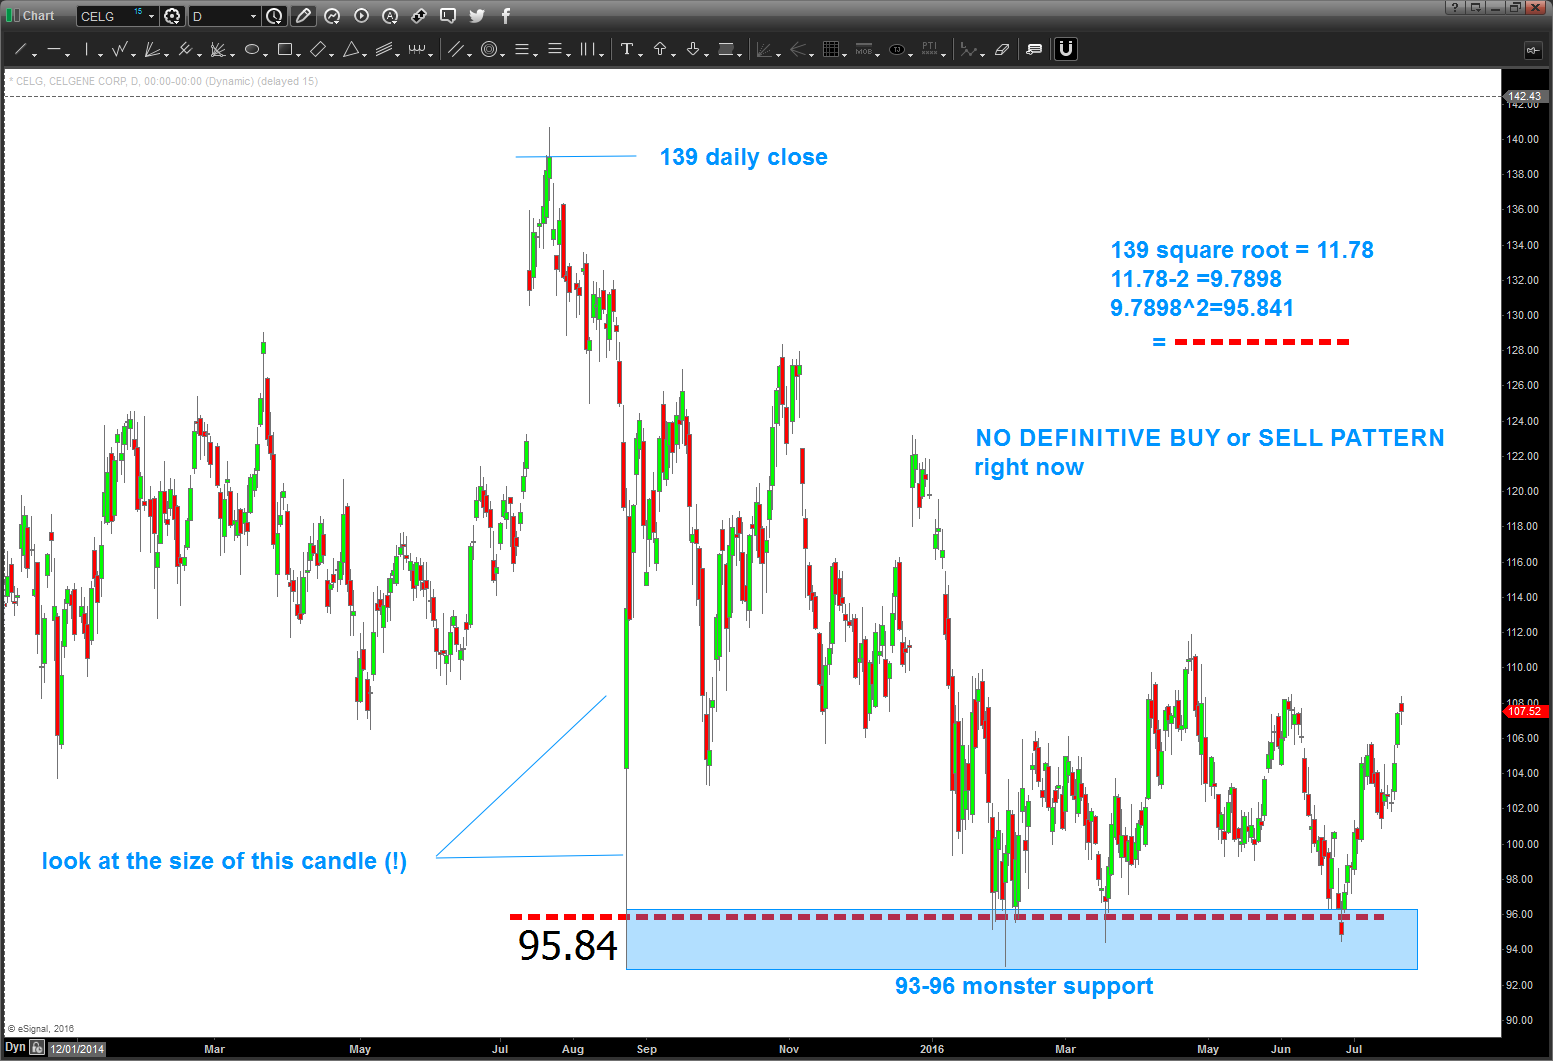
- the 93-96 area is MAJOR support here
- note the size of the candle that hit in late August – that’s some support
- also, note the REASON for the support area at 95.841 – it did an exact square root correction and only close below that level once
- as for patterns, nothing jumps out at me on the daily time frame. a base of support getting read to launch a vertical attack up is conceivable but, for now, nothing CLEAR to me.
- a case can be made that the reaction from late August 2015 is a year long triangle in the making and if we fail lower “here or a little higher” then down she goes.
Overall: I’m neutral as the bulls/bears are locked in any number of ways. Caution Will Robinson.
Hope this helps dude … Beat Army, always.
Bart
Stonehenge, the Pyramids and the high on the NYSE Index …UPDATED 7/23/2016
Posted on July 23, 2016 Leave a Comment
07/23/2016 – posting this again because the MATH and the NUMBERS and the VIBRATIONS are so important. I don’t want to go into a “war and peace” diatribe regarding “WHY” this high in the NYSE was/is so important. But, I do want you take notice ….
- note the all time low …10/4/1974. That NUMBER which is actually a VIBRATION … sorry, going to go down a rabbit hole for a moment
- the ancients used words to equal numbers which equaled music. essentially, when we SPEAK our dialect we are actually emitting a sound which plays a tune that is harmonious or not to you. so, in order for the words we SEE as we read and THINK they assigned numerical equivalents .. 26+26 = 52. 52 weeks in a year .. yes/no?
- so, that LOW at 347.77 was the SEED for the rest of the move into the high on May 21, 2015.
- below you will find how – using LOGS (which are cool) we are able to calculate the EXACT HIGH on the NYSE …yes, go read it, it’s the EXACT high.
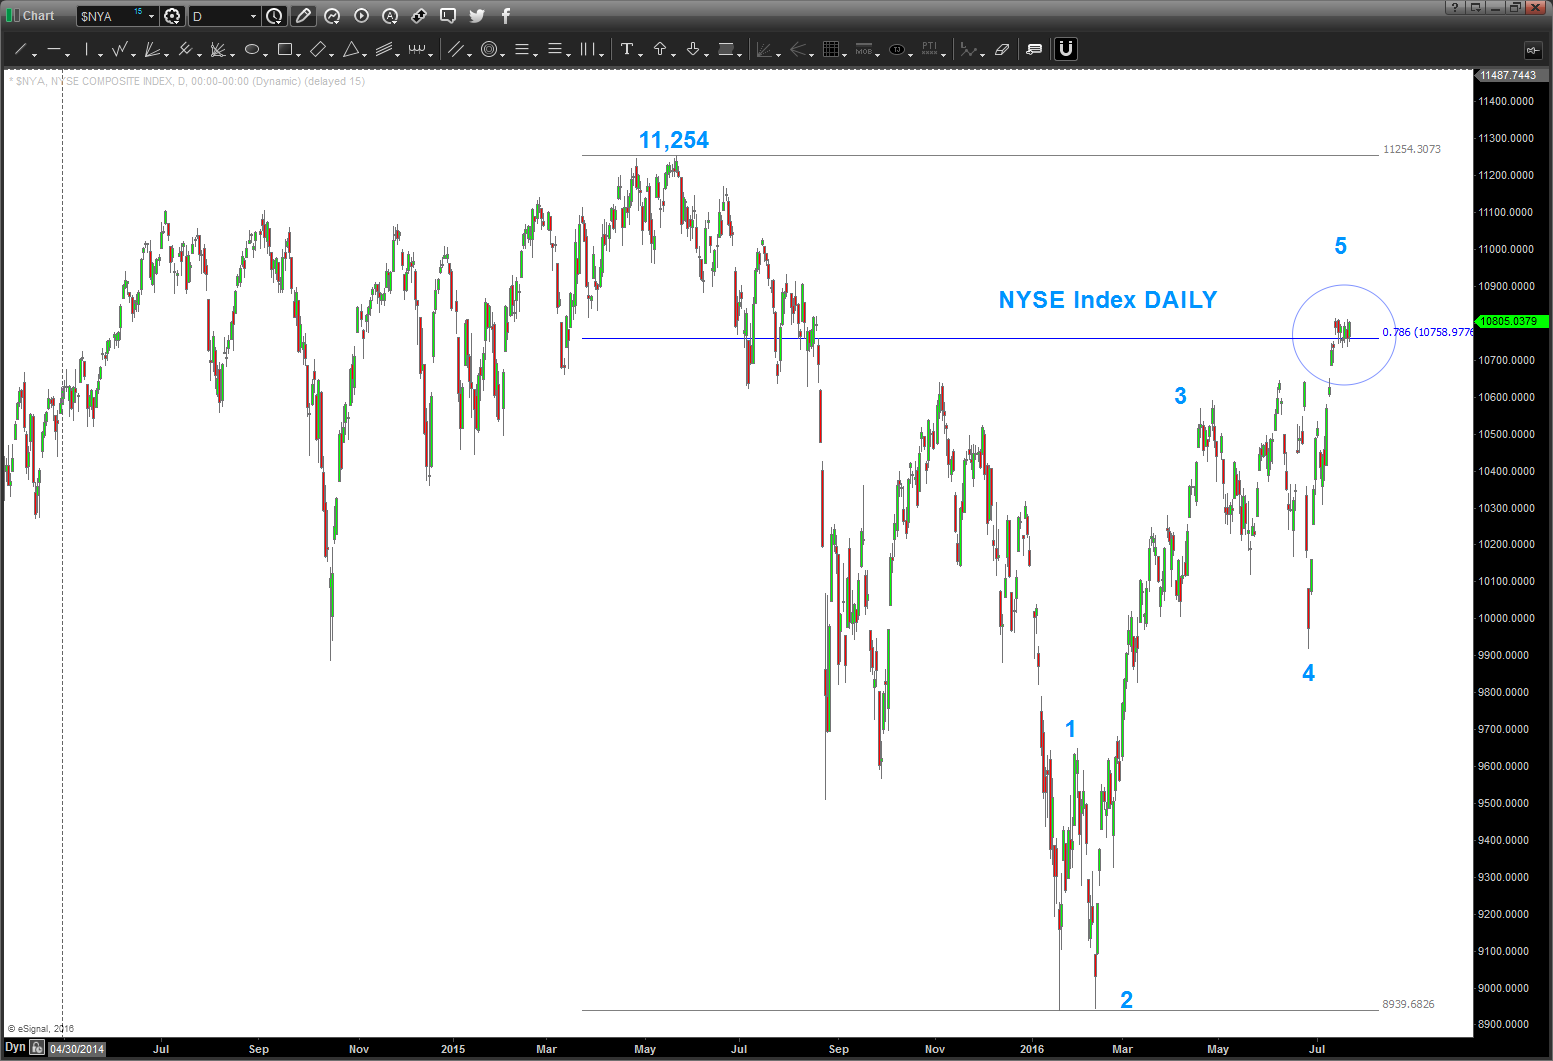
- Why is this important? Well, the NYSE index is a huge deal … it’s not manipulated and it’s encompasses most everything in that is traded (5000+ securities). so, take note of the chart below … we’ve hung out for 7 days at the .786 but HAVE NOT REALLY CLOSED BELOW IT. THAT IS BULLISH …
- I also see 1,2,3,4,5 waves completing – which is also BULLISH. It warns of a corrective pullback but the TREND is still UP and 1,2,34,5 waves UP means it wants to go higher after a pullback.
so, in summary, there are many bullish aspects of what’s going on right now … but as long as the NYSE stays below 11254 I have to remain cautious. If we blow thru there .. game on! then, perhaps the DOW tries to go seek the END OF THE OCTAVE at 22,346 as explained here:
I’ve seen the planetary aspects that my friends/mentors have been sending me and I also know the Bradley model turned DOWN HARD on Friday into late fall. Just use stops and let the math work …
Bart
I’ve been asked, why do you use long term log charts so much …? Frankly, I think they are the MOST important tool in a chartists tool box.
When a mathematical property (LOGS, ANTI-LOGS, EXPONENTS) are responsible for the British Foot System, Stonehenge and the Great Pyramids I take notice …
In a prior post we discussed that “decimal points” are just “things” and when using vibrations (i.e. the market) we can move/adjust the decimal point. Take for instance the all time low on the NYSE Index at 347.77.
- PI = 3.142
- 3.142 = 31.42
- 31.42*347.77 = 10926.93 (see light blue dashed line)
Of note, the amazing Martin Armstrong called for his ECM model to turn October 01, 2015. I suspect if might have something to do w/ PI and the decimal shift. You see the fateful top in 1929 was September 03rd. 10/01/2015 was 31,439 days ago OR 3.1429.
If we go back to your long term LOG charts you’ll see the power of connecting lows via trend lines (those are key cycles) but what we can also do is PROJECT price targets and time targets.
Today, we’ll just focus on PRICE.
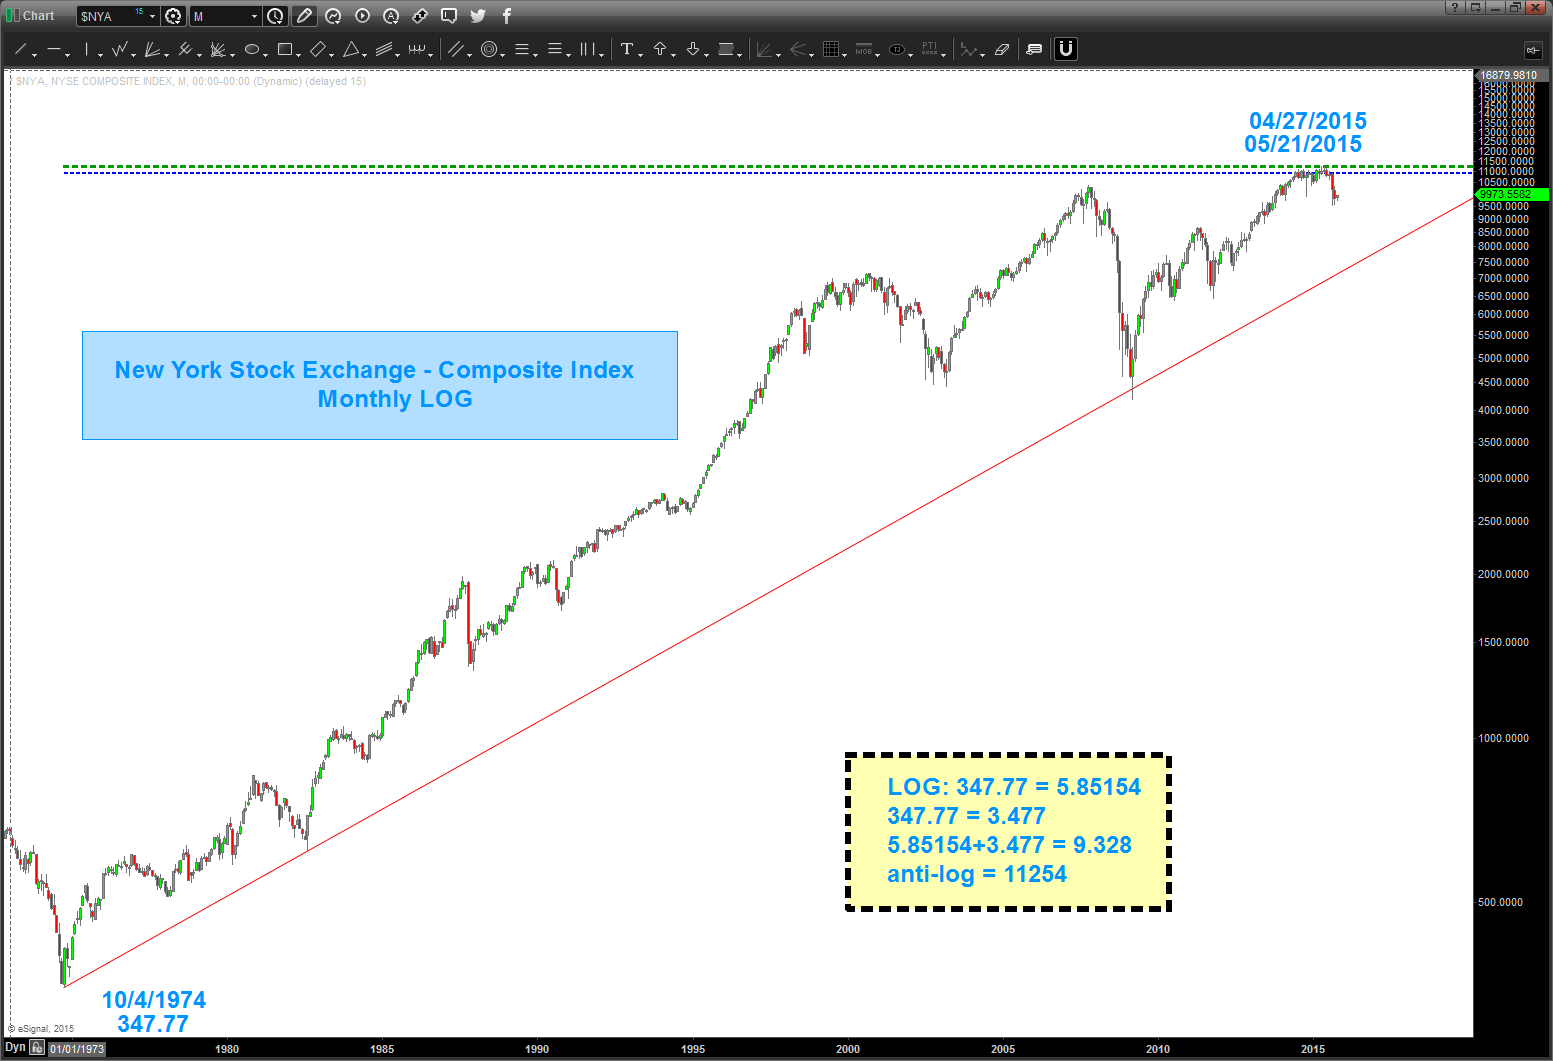
- All time low: 347.77
- Log (the LN key on calculator) 347.77 = 5.85154
- 347.77 = 3.477
- 5.585154+3.477 = 9.32854
- anti-log 9.32854 = 11254
Is that the EXACT high? Um, yeah, pretty much but – IS IT THE HIGH? I don’t know but what I do know is everything is tied together and it’s all math …
have a good weekend …
