$CELG
was asked to take a peak at CELG …
some things to consider:
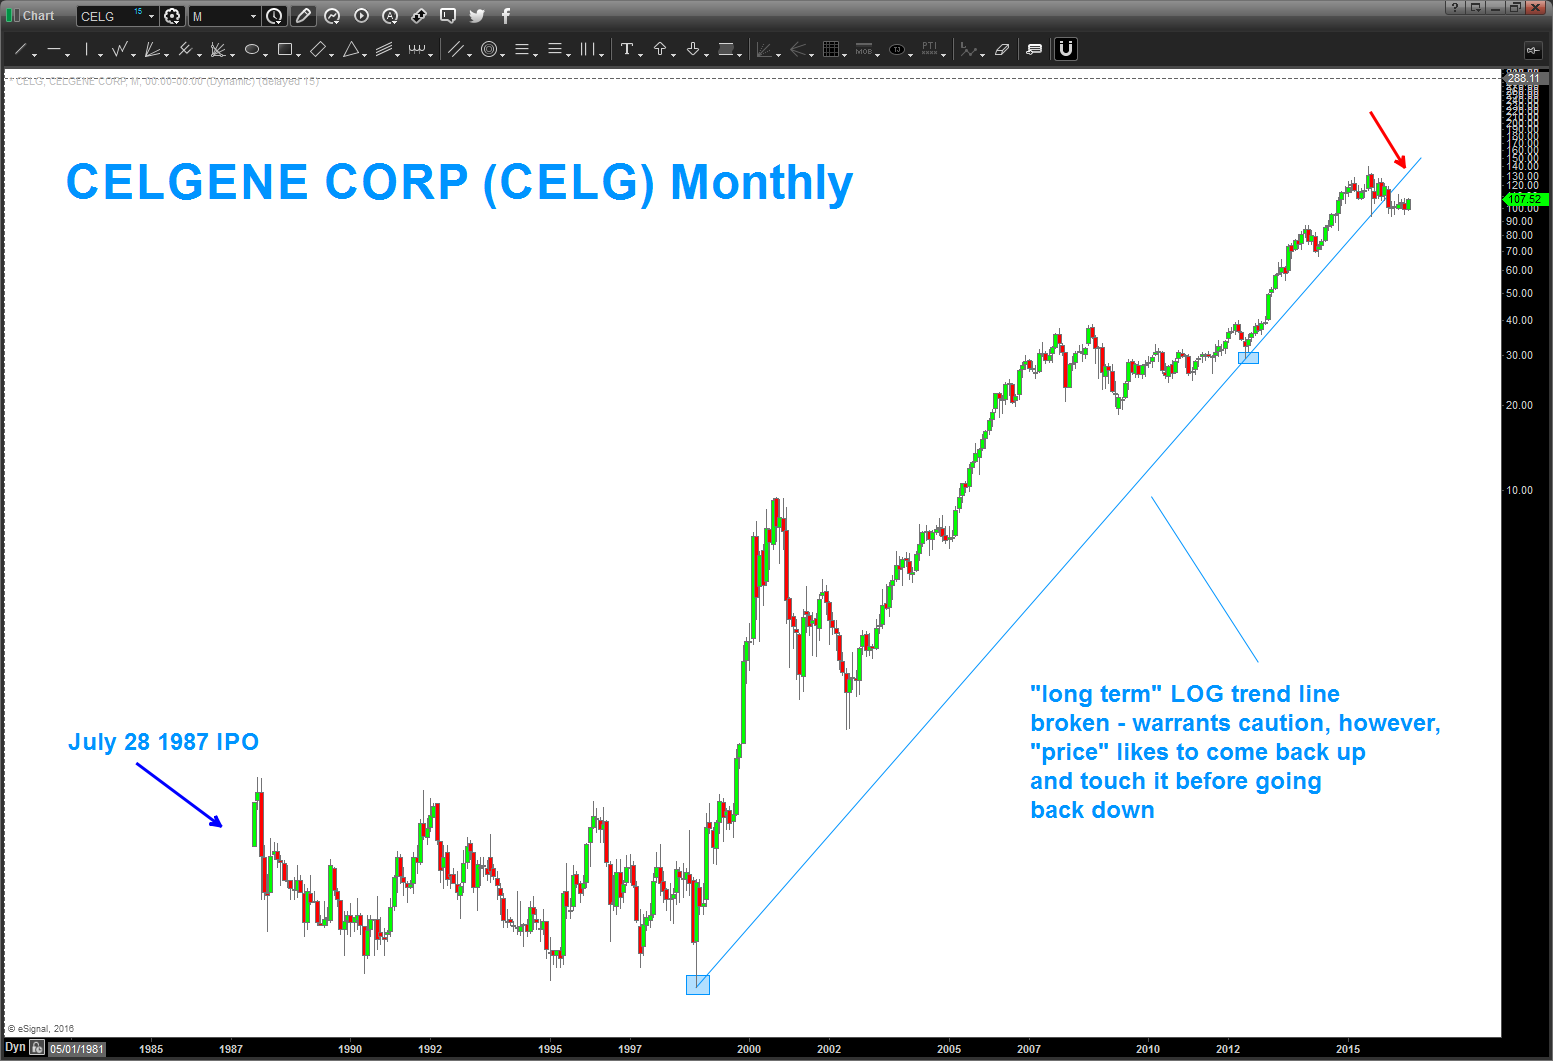
- note the “long term” LOG trend line that was broken. that, in and of itself represents a breakdown or loss of strength in the underlying trend. IT DOES NOT mean it can’t go higher, it just means that the acceleration/growth has dissipated.
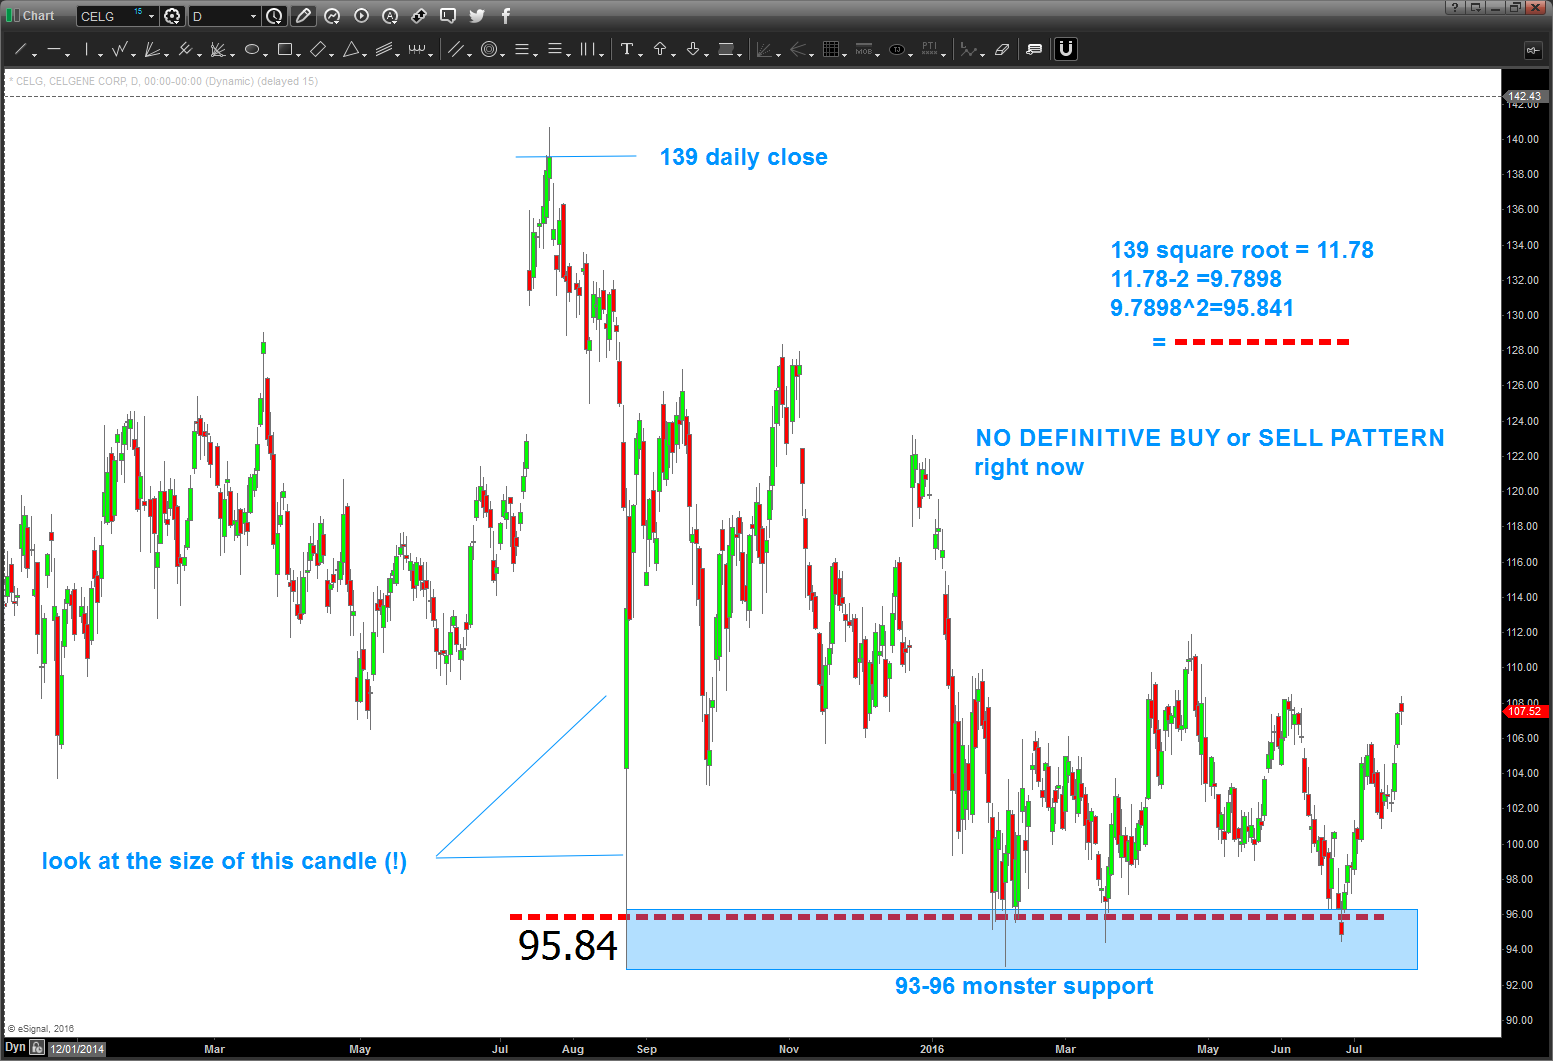
- the 93-96 area is MAJOR support here
- note the size of the candle that hit in late August – that’s some support
- also, note the REASON for the support area at 95.841 – it did an exact square root correction and only close below that level once
- as for patterns, nothing jumps out at me on the daily time frame. a base of support getting read to launch a vertical attack up is conceivable but, for now, nothing CLEAR to me.
- a case can be made that the reaction from late August 2015 is a year long triangle in the making and if we fail lower “here or a little higher” then down she goes.
Overall: I’m neutral as the bulls/bears are locked in any number of ways. Caution Will Robinson.
Hope this helps dude … Beat Army, always.
Bart

Thanks!!! So what I am seeing is by connecting all those highs since last August and by connecting all those lows, it appears we have a breakout approaching as the distance between high and lows narrows. It also appears that CELG just broke through that line connecting all those highs, which it has struggled to do in the last year. I have been expecting a breakout to the upside in mid-August. Have been watching this pattern for 3 months. Seems to be coming true. What am I missing??
Hope that all makes sense.
Scott F. Blundo Rustic Stone & Garden Design, LLC 603-393-0749 Rusticstoneandgarden@gmail.com http://www.rusticstoneandgarden.com Go Navy!!
Sent from my iPad
>
I don’t think your missing anything – the only thing I am concerned w/ is that LONG TERM log trend line break. If we can get a DAILY close above the descending high to low trendline then it “should” break and go back up to seek that long term trendline. I don’t have anything definitive to make a powerful SELL or BUY pattern. Does that help dude?