E-MINI
Posted on September 11, 2016 Leave a Comment
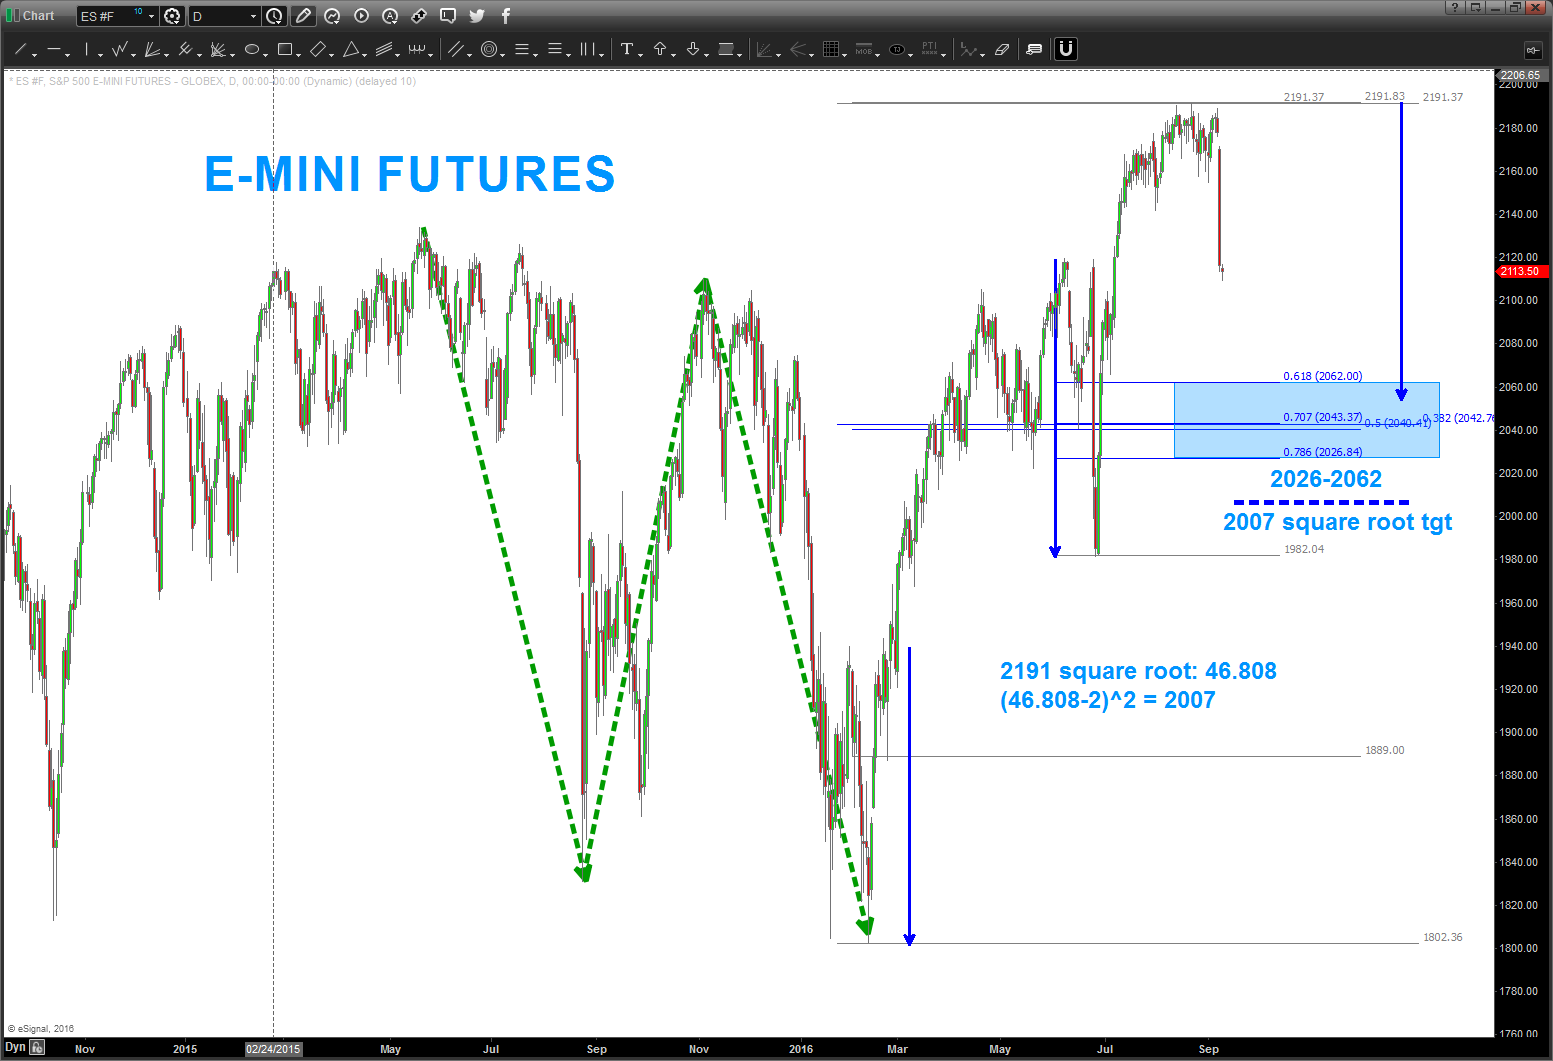
here’s the targets to the downside for now .. note the blue arrow has been EXACTLY equal to the last corrections each time since March. so, those levels are going to be key as shown by the light blue rectangle.
Remember, we were squaring out “numbers” from the “birth” of the S&P 500 … that’s “usually” a big deal so we shouldn’t be surprised that it gave away like it did on Friday .. square outs from ‘birth dates’ usually cause “stuff” to happen, just saying.
REMX
Posted on September 9, 2016 Leave a Comment
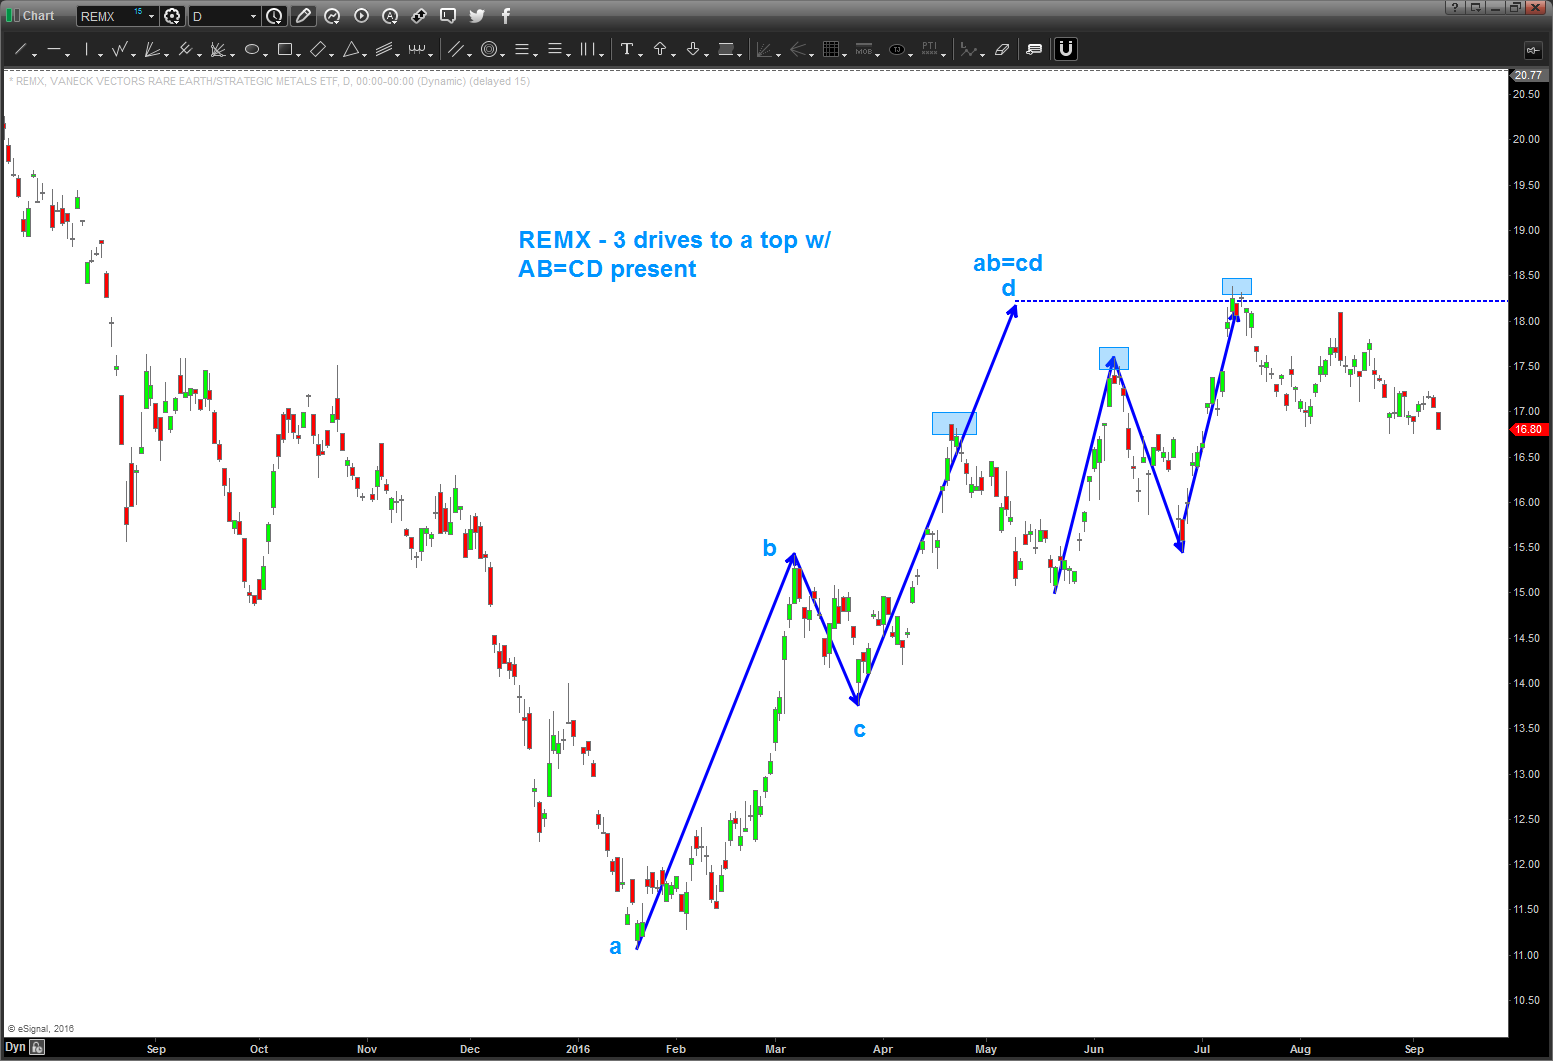
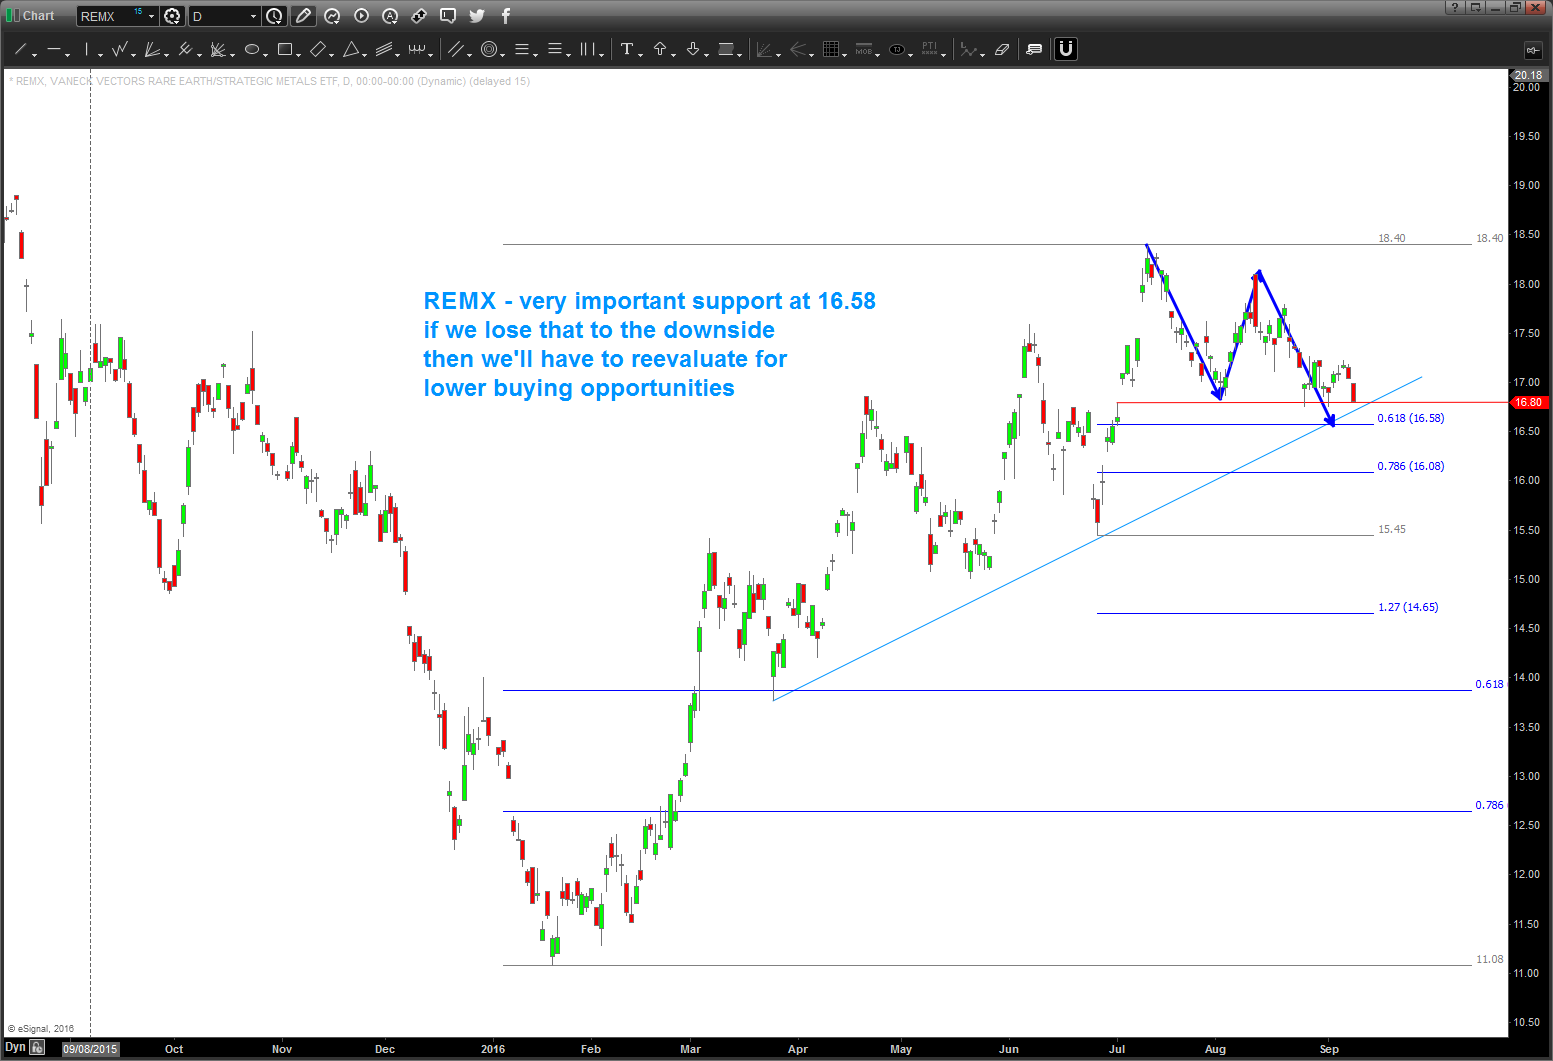
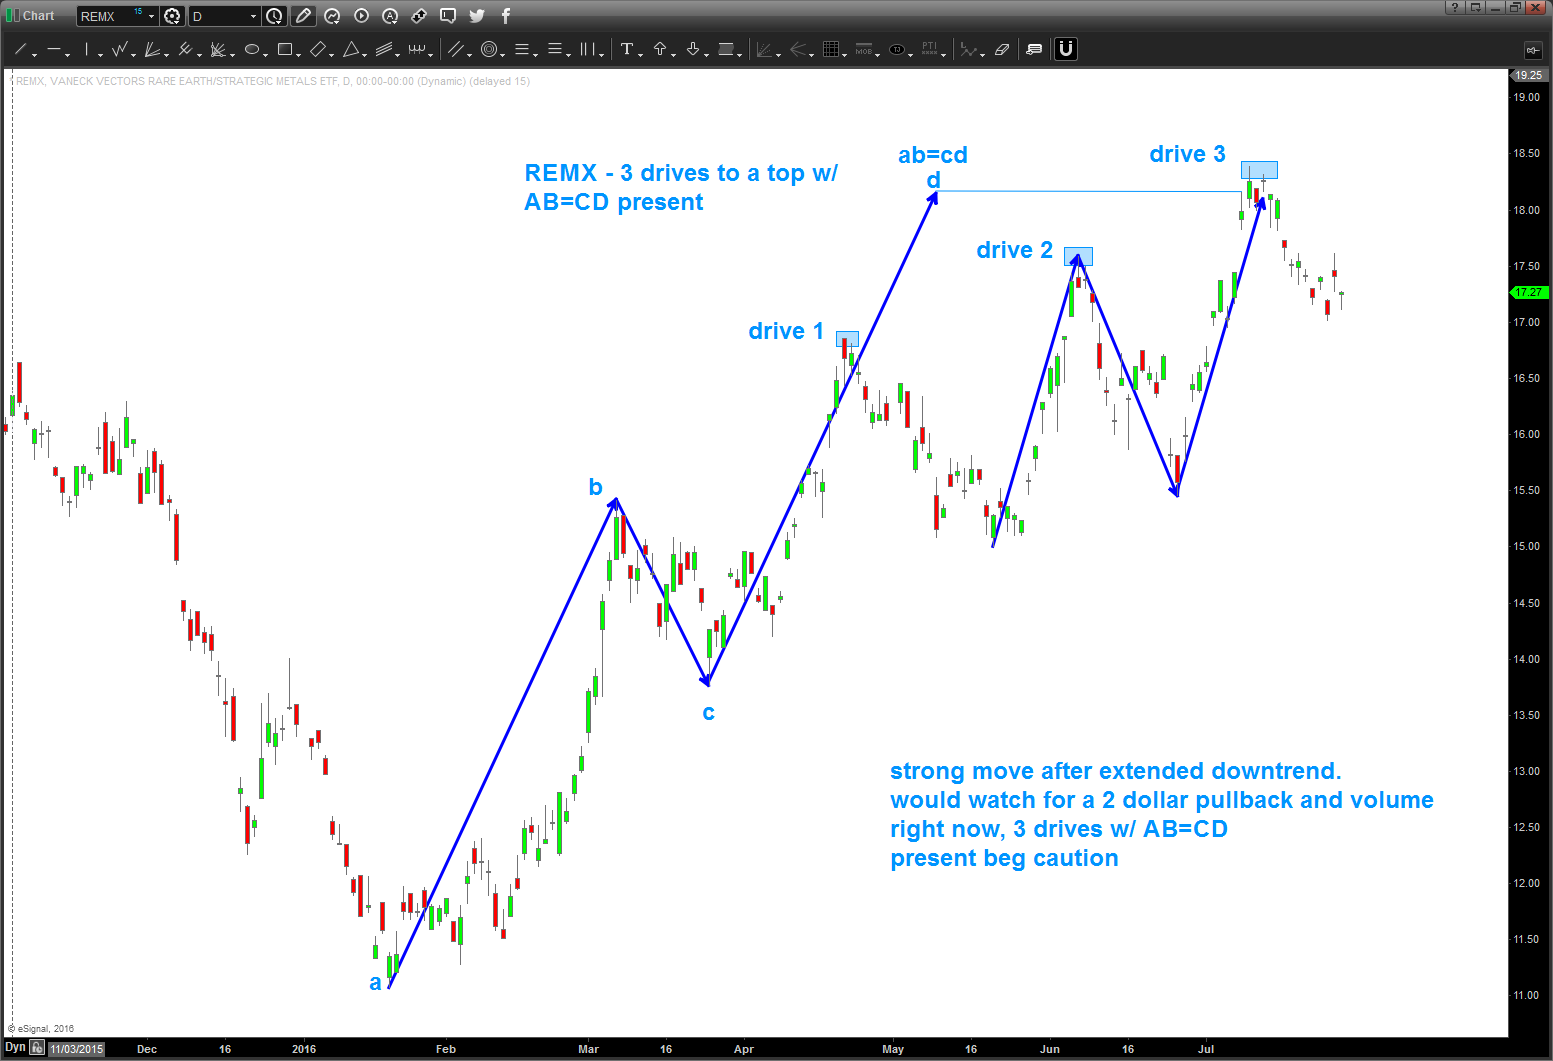
9/9/2016 – important support at 16.58.
- projection and trend line
- IF bullish THEN this should hold it
- IF we lose this level to the downside on a daily close THEN need to reevaluate and WAIT for a pattern to appear lower.
B
Platinum / Gold ratio analysis
Posted on September 9, 2016 Leave a Comment
sure looks like Platinum should start to outperform.
nice 3 drives to a bottom w/ time symmetry.
if these levels fail, we do have a lower target but sure looks like the RATIO wants to go up …

XOM update
Posted on September 6, 2016 Leave a Comment
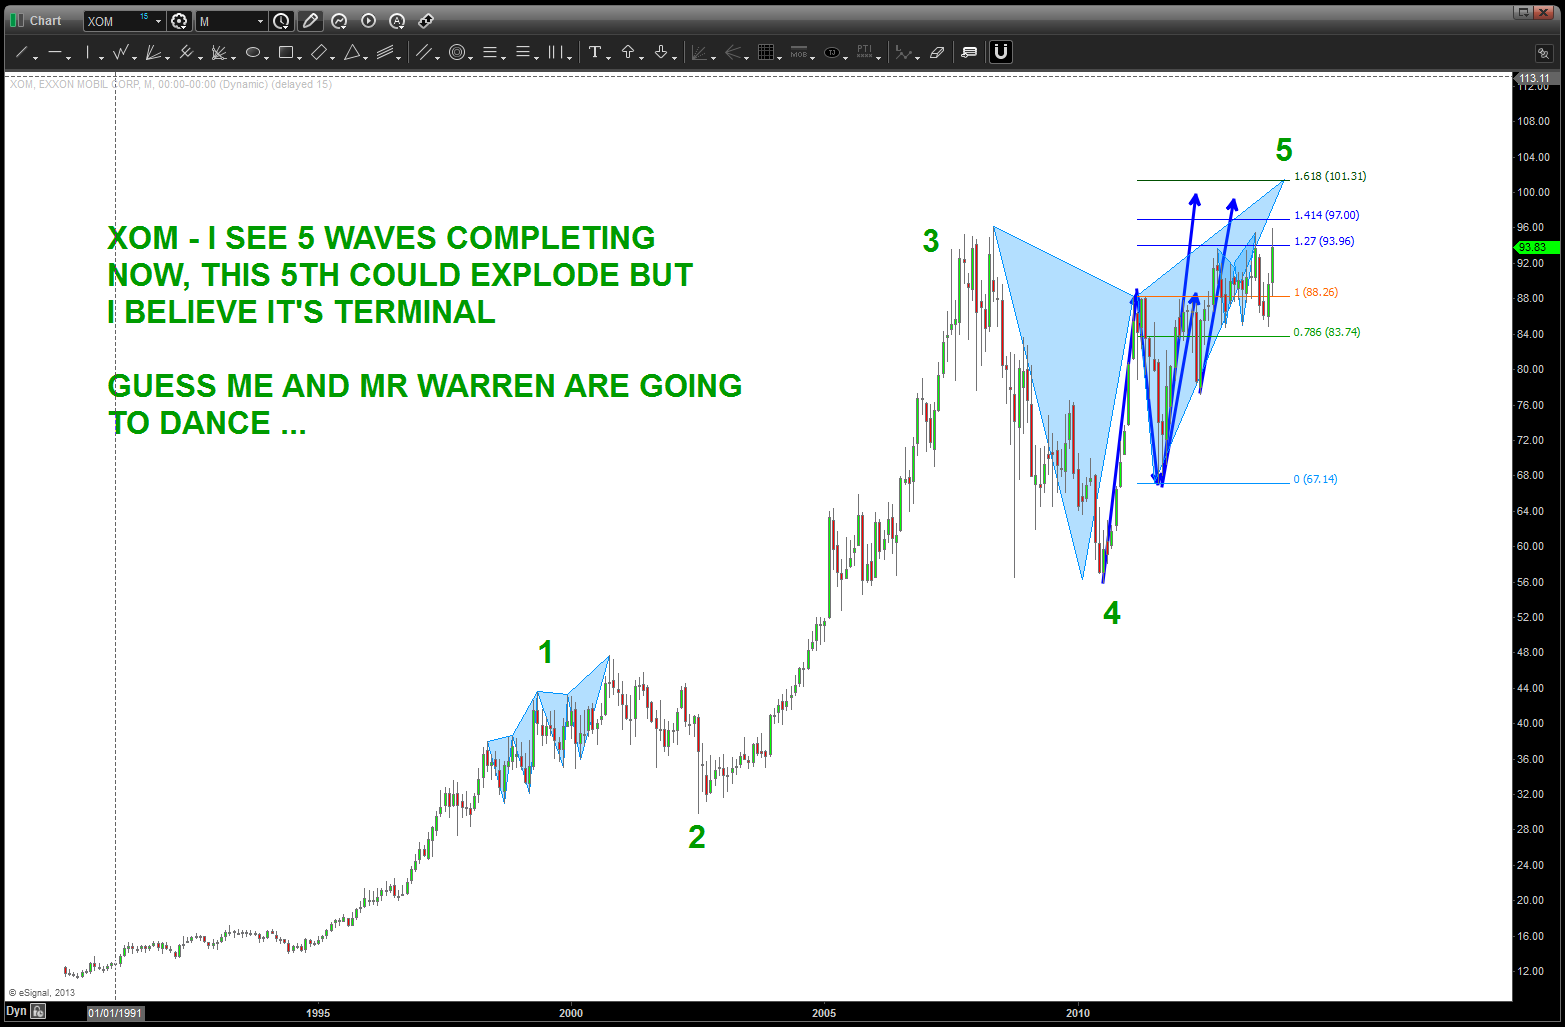
09/2015/2016 – short zone appears to hold. break below 86 on a daily or weekly close will seek 80 for starts.

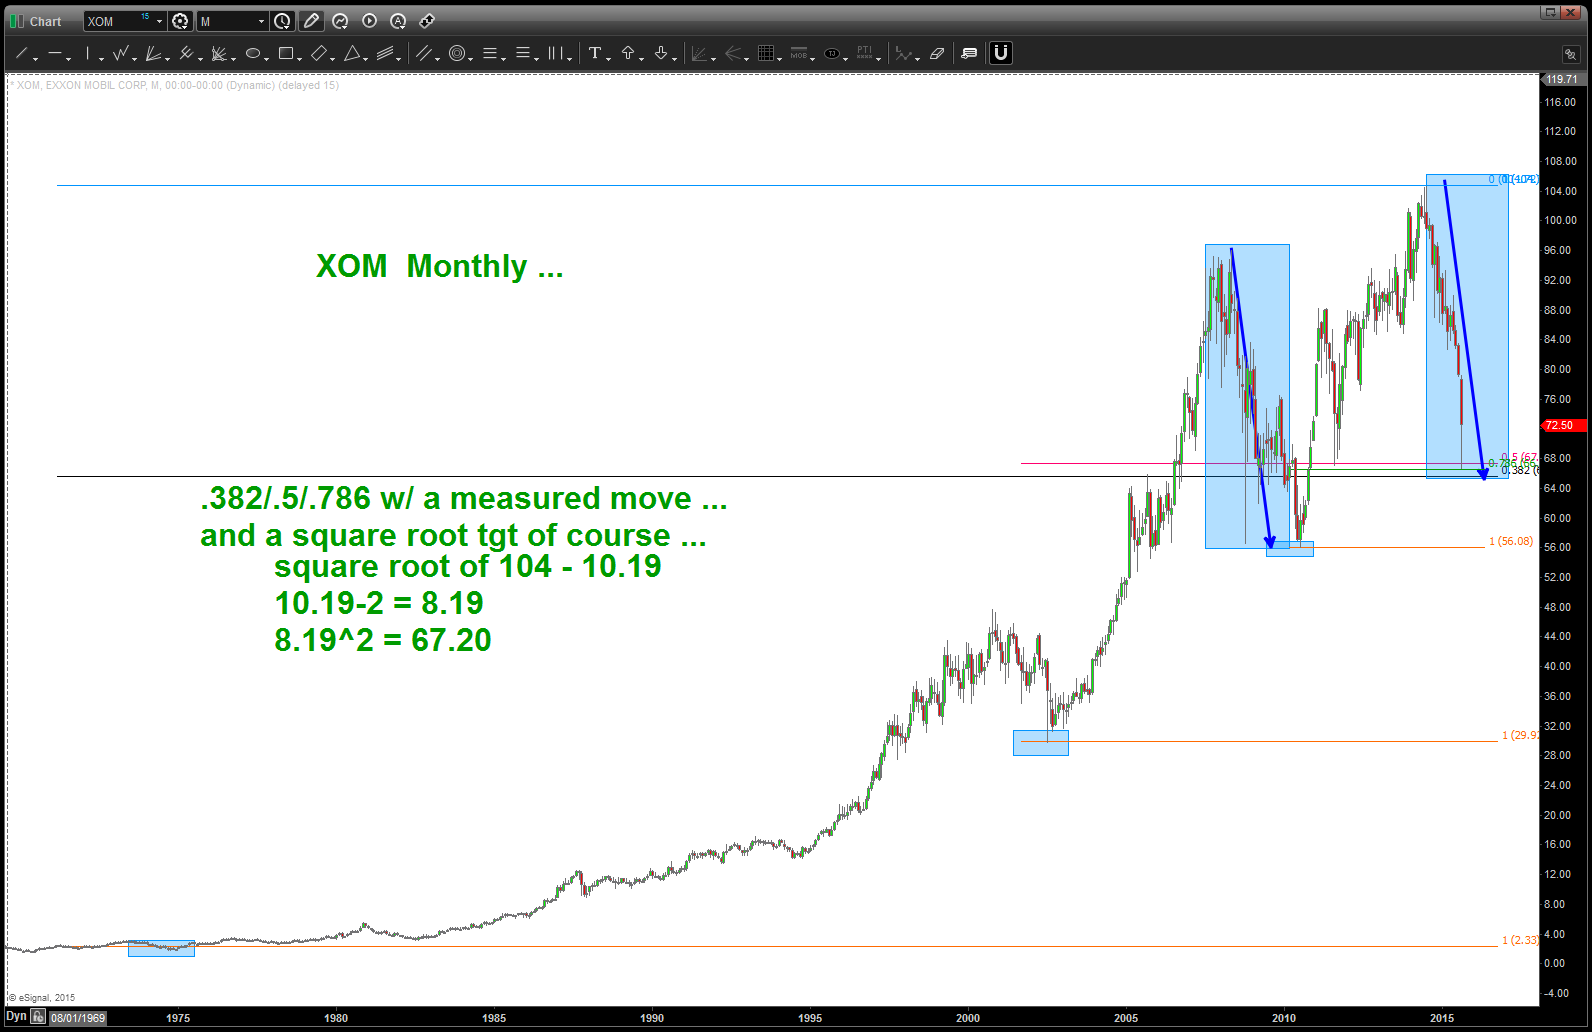
04/24/2016 – the “zone” shown below has worked and XOM is rallying in 3 waves. IF the thesis that the high at 104 was a big top THEN this pattern shown below should work. If not, then it will continue higher. This is a very nice sell pattern.
please read the entire post from the bottom to the top to understand what could possibly going on here ….
thanks and hope you have had/are having a good weekend.
Bart

folks – I am sorry that I didn’t post this earlier as this ranks up there as a “no brainer” in my simple mind …
- the ENTIRE KEY is the square root target
- IF square root targets lie on top of 3 Fibonacci retracements and a measured move then Lions (square root target), Tigers (measured move) and Bears (pardon the pun – retracement levels) it is “usually” market magic.
also, the pattern from November 2013 is included. was looking for 101-102. shoot me …
strategy is key here .. as you can see we do have a target a little lower also BUT that daily candle is impressive, wouldn’t you say?
Truncation … low in USD vs JPY in place?
Posted on September 5, 2016 Leave a Comment
the more I look at:
- USD Index “low” in place and advancing …
- thrust/momentum from the lows in the USD vs JPY …
the more a case can be made for truncation as shown below … so, here’s the other side of the coin. going to have to go for it w/ a stop and see what happens … just waiting for a buy pattern to test the thesis.
Bart

Lumber revisited – again …
Posted on September 5, 2016 2 Comments
09/05/2016
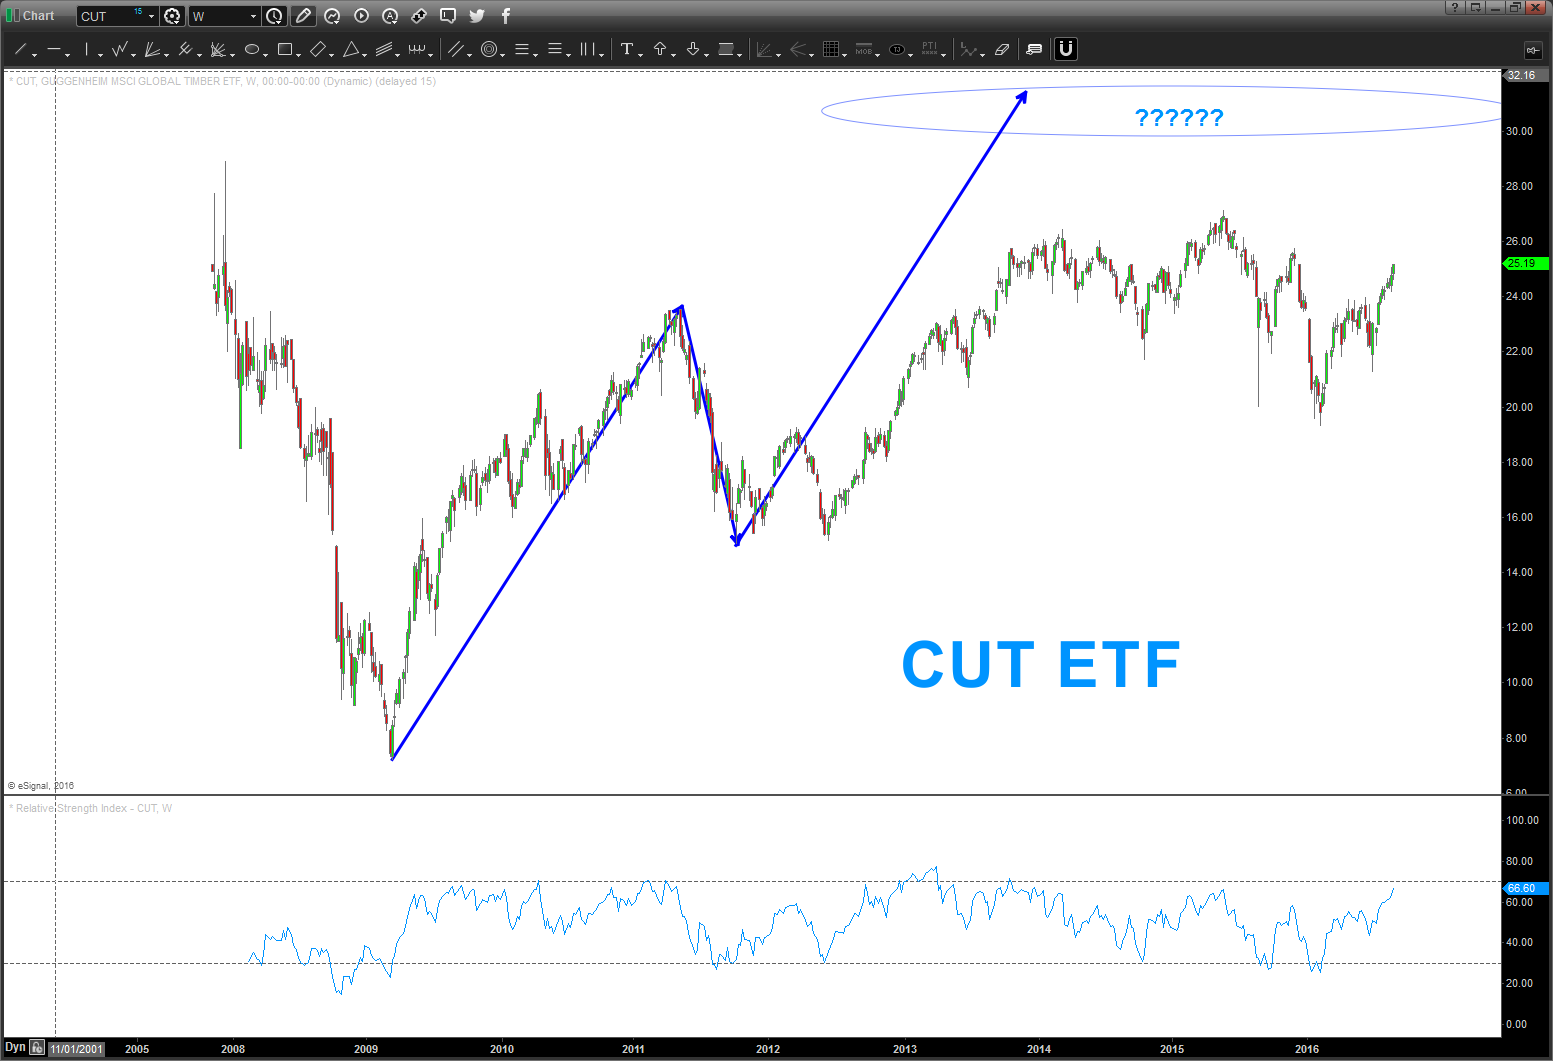
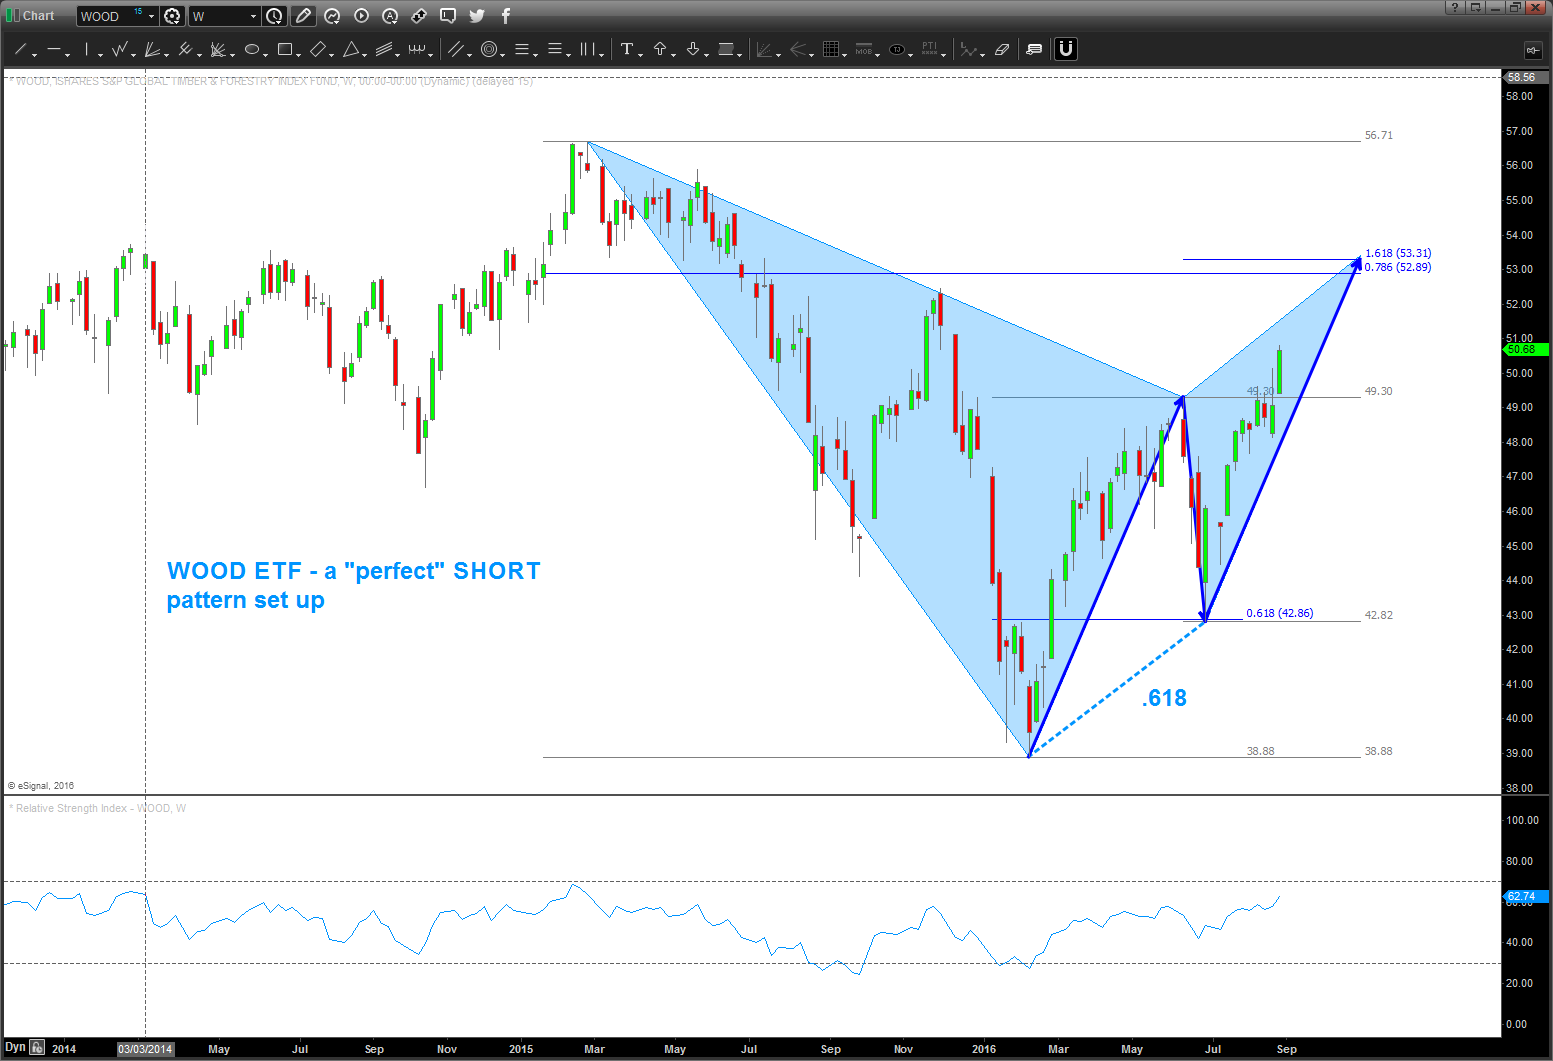
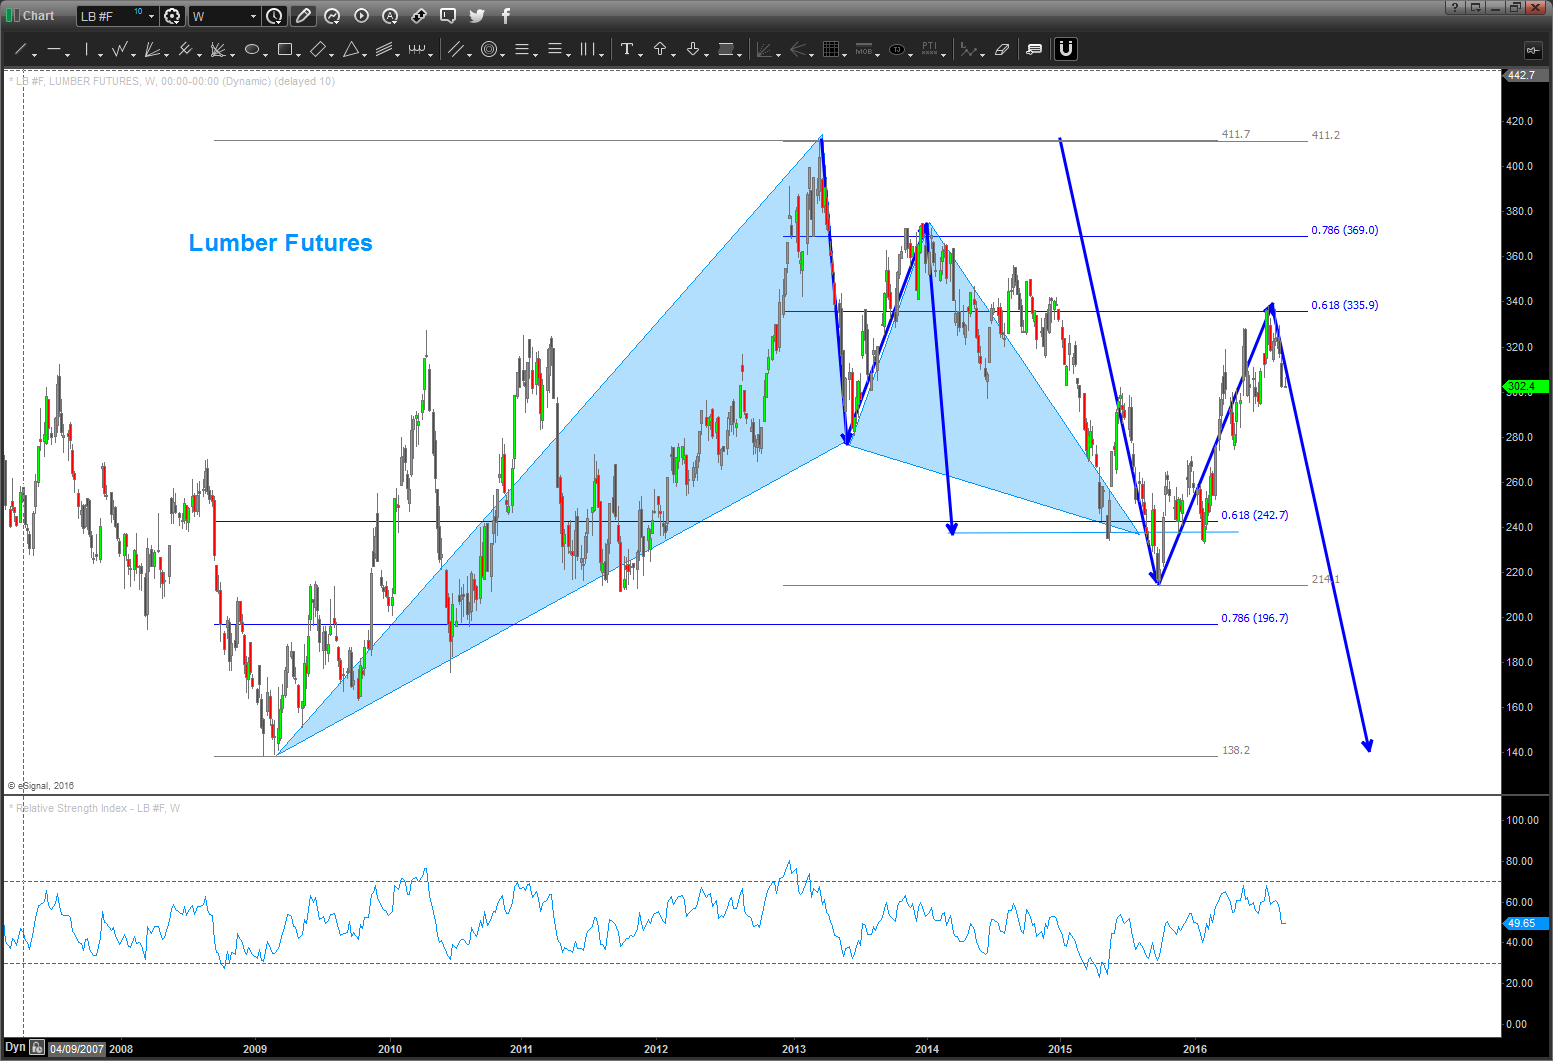
I know nothing about the harvesting techniques of wood/lumber.
The post below the two dashed lines is over a year old.
These targets were generated from harmonic pattern recognition.
Notice, there are NO oscillators, moving averages, bands or anything like that .. just PRICE and TIME.
They were all hit … sometimes they work, sometimes they don’t.
There is no “back tested” or “could of, would of, should of”
Patterns exist for only one reason … to let you know when your wrong.
What comes next? I don’t know, find a pattern …
Bart
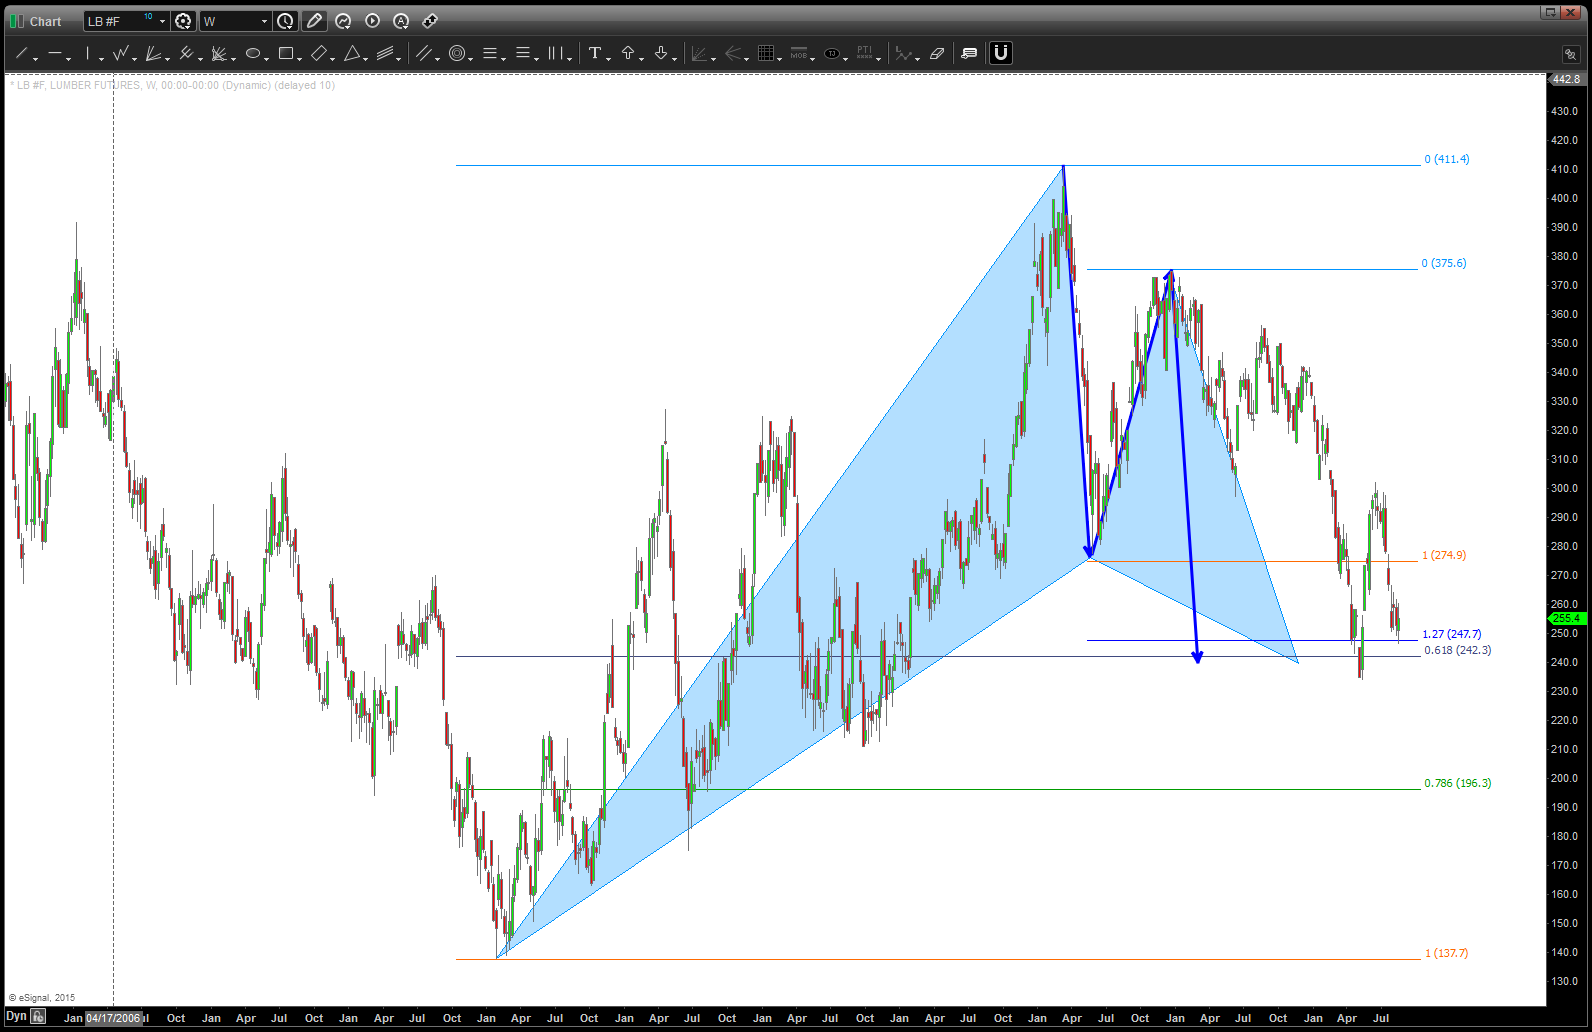
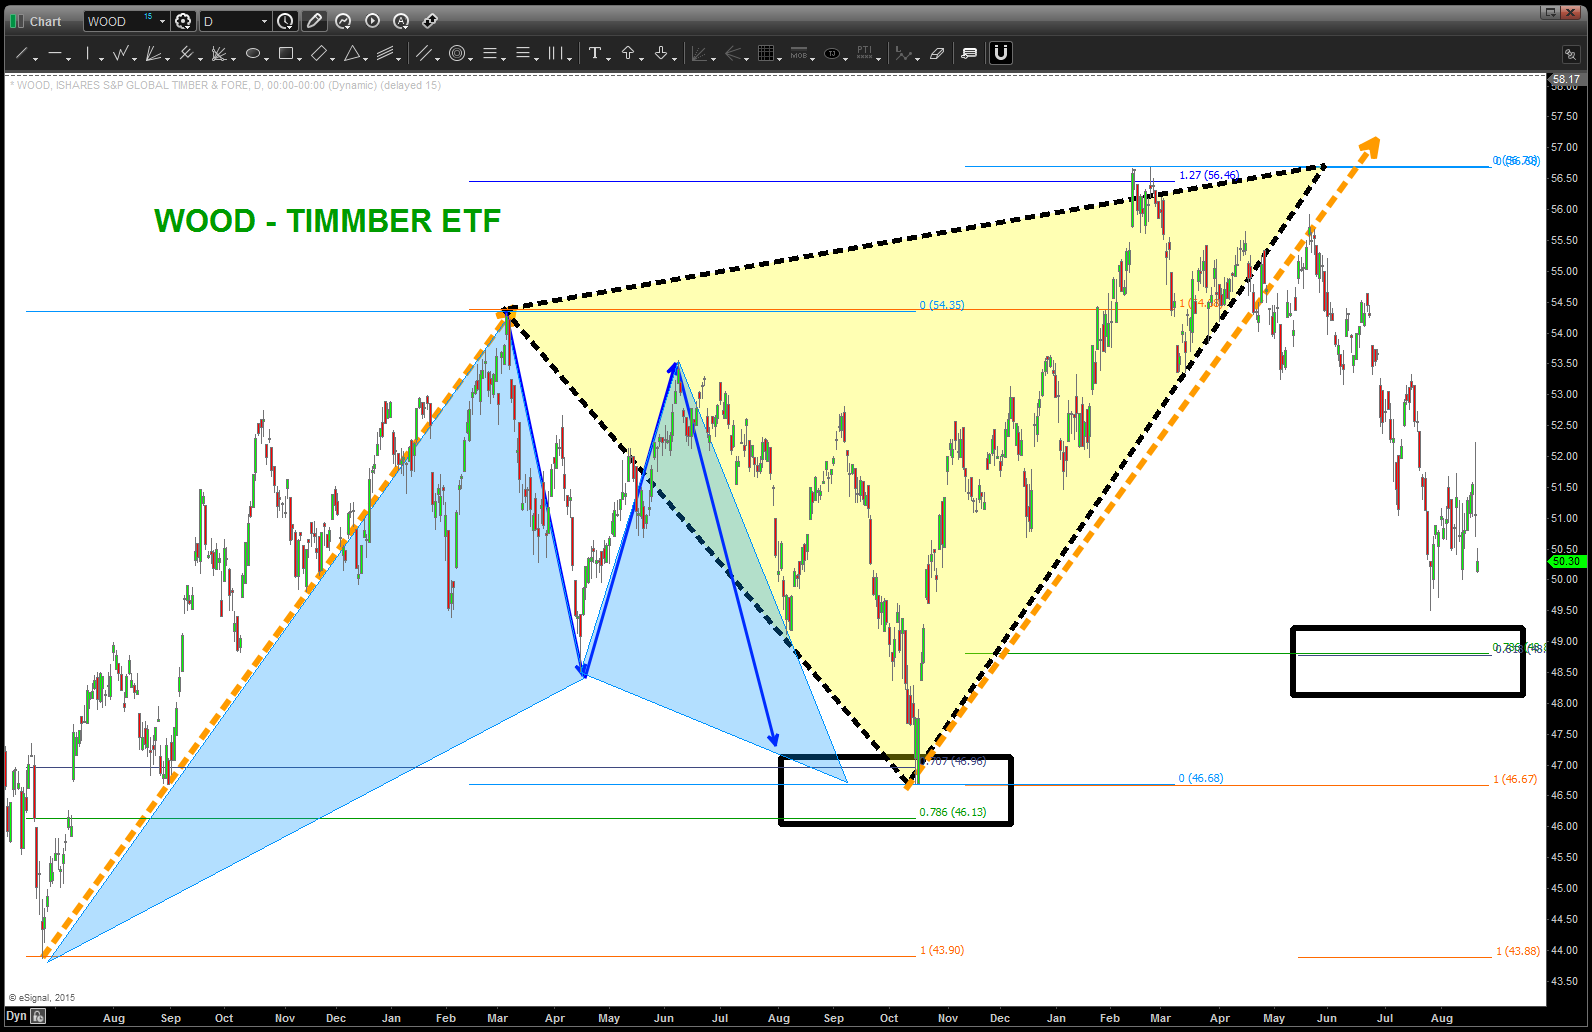
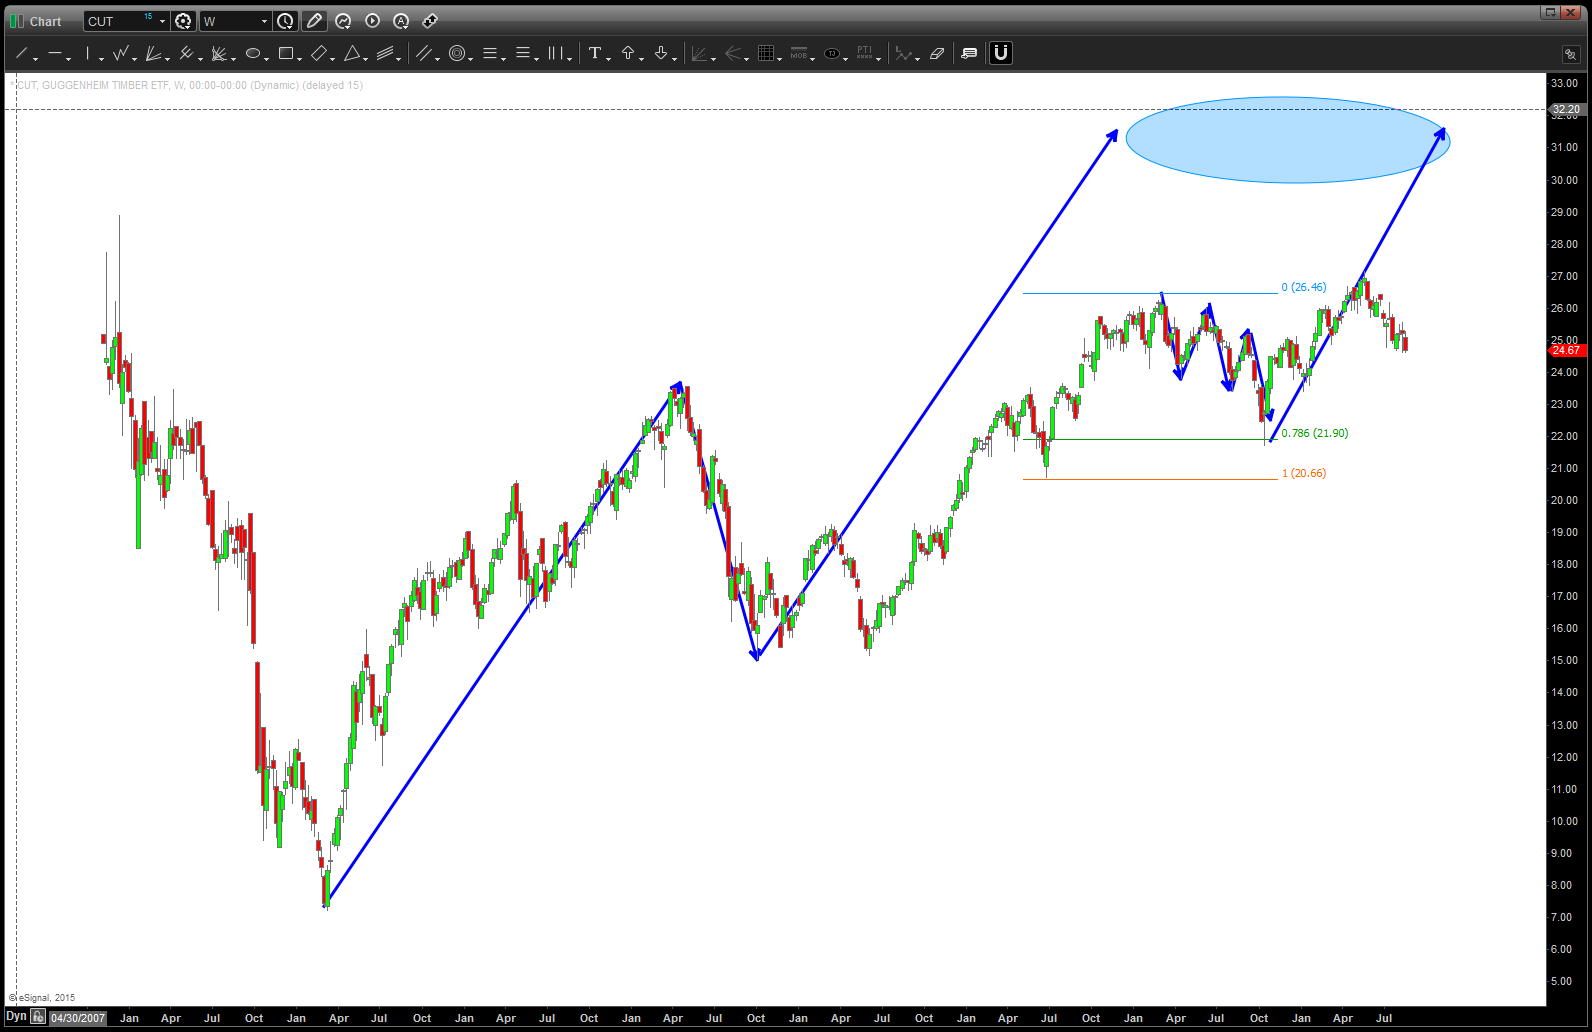
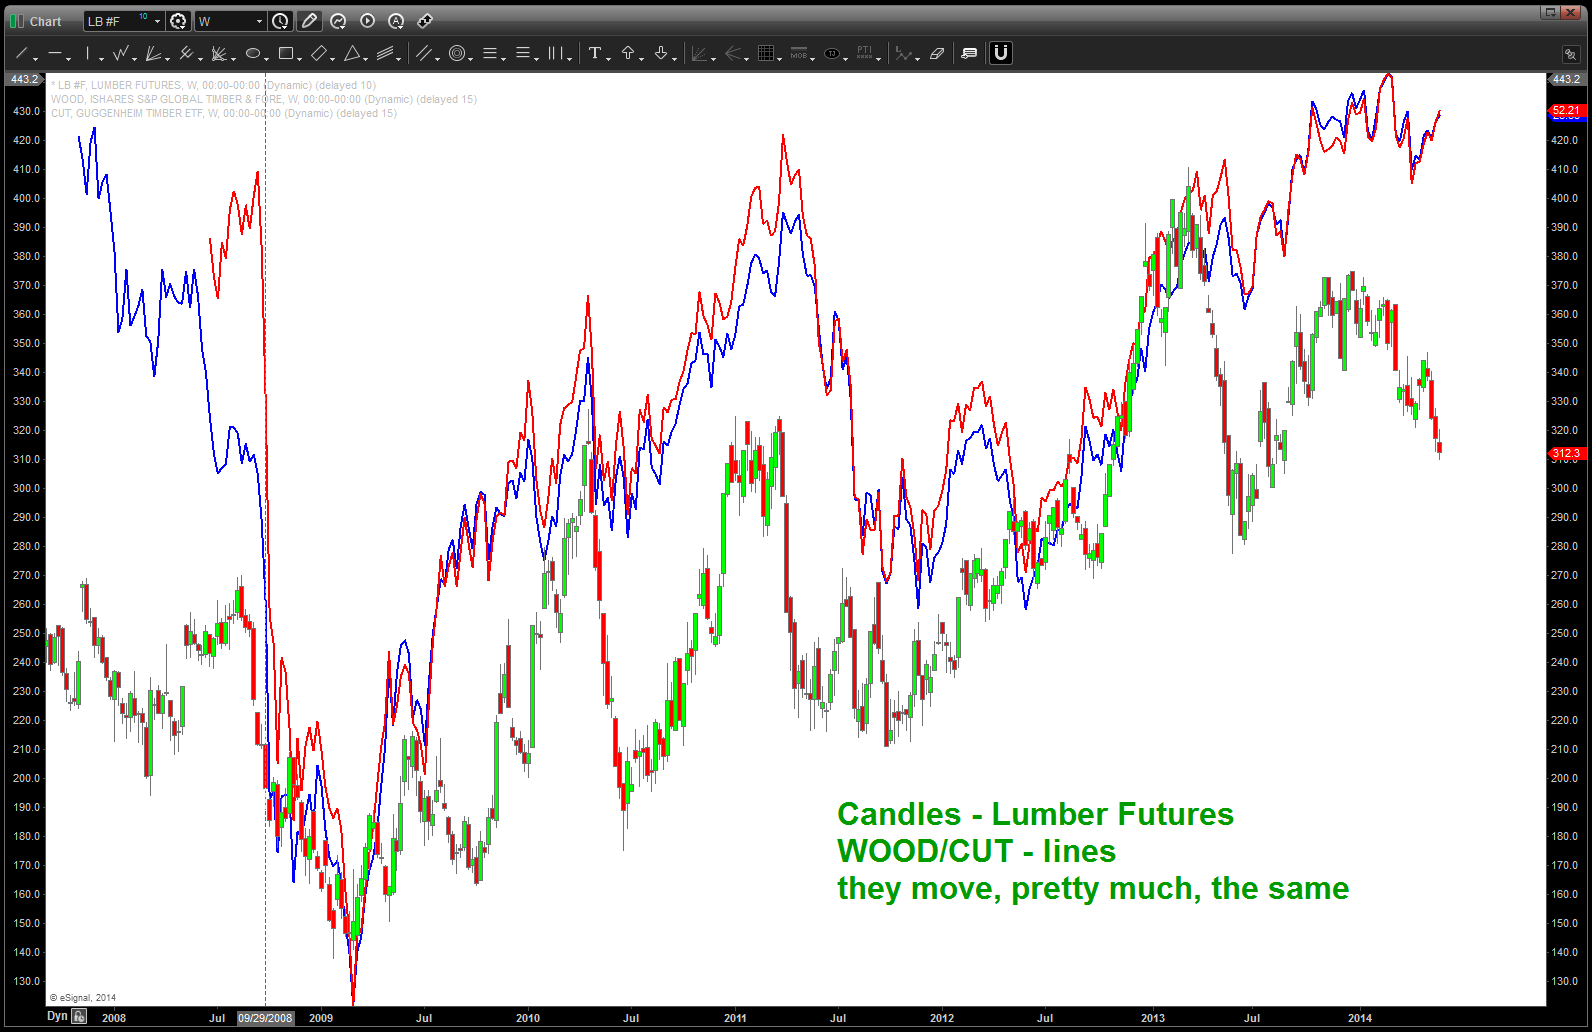
CLIFF NOTES: below is a weekly continuous contract of the lumber futures. all the ratios come together at 241-242. this is a very nice one….stay tuned. might/could find support a little lower and then it’s off to the races in/around here but the larger pattern is very nice. appears bullish from a WOOD/CUT/Lumber Futures perspective.

Lumber Futures
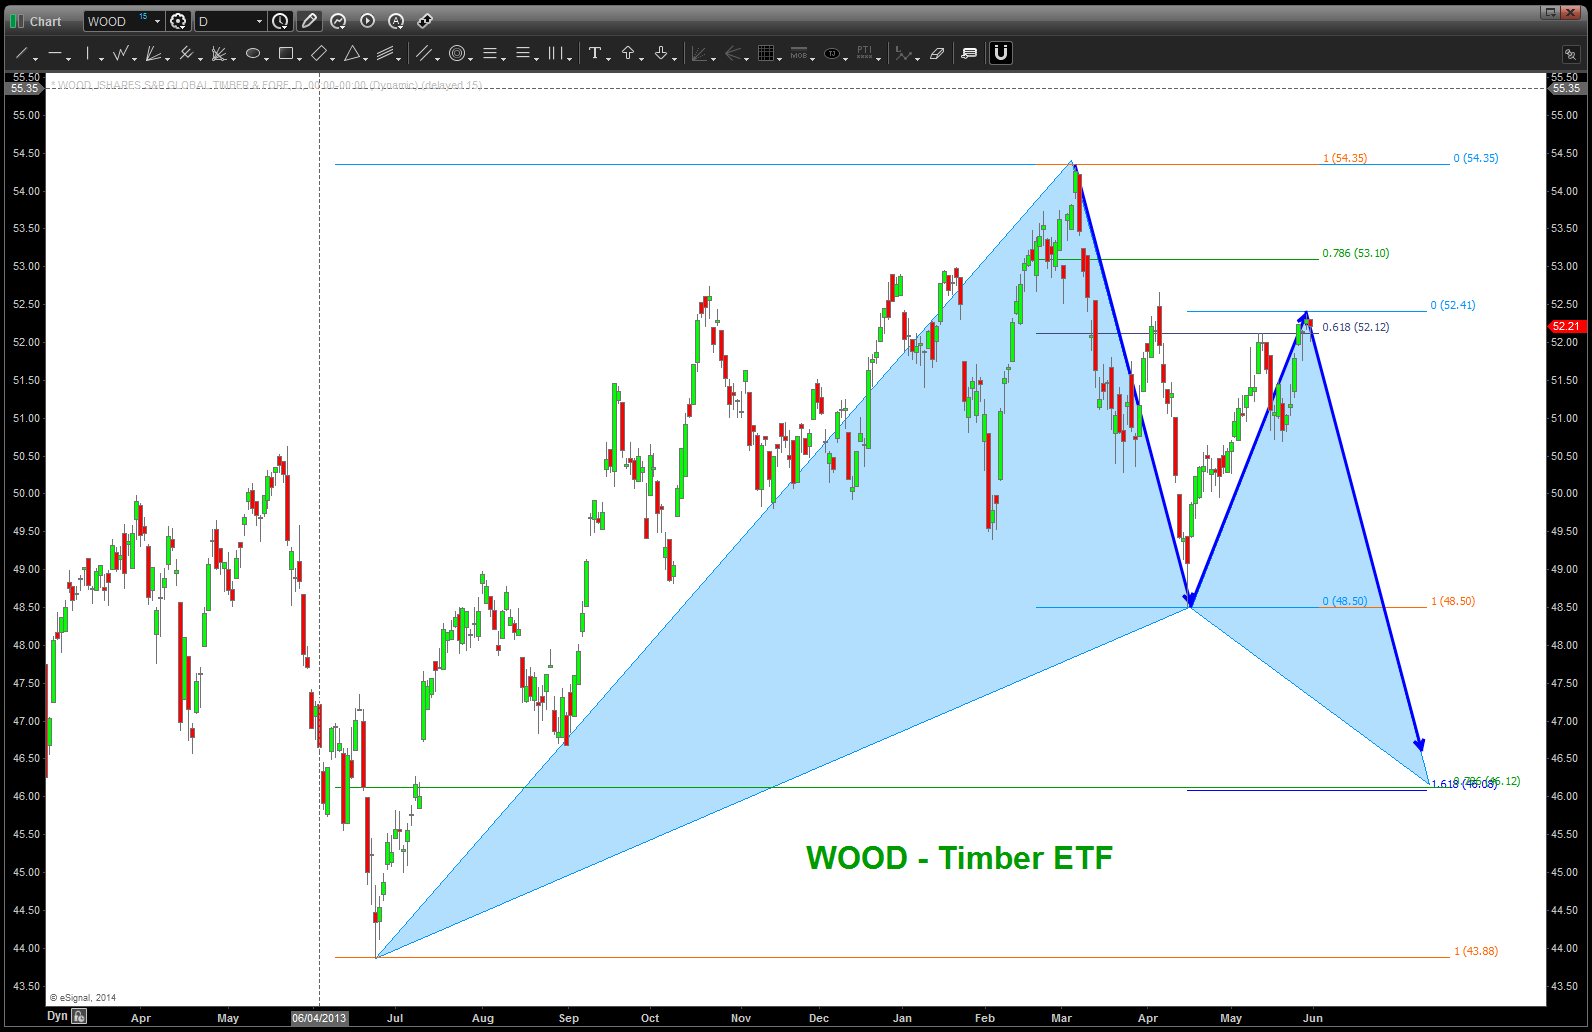
WOOD – Timber ETF
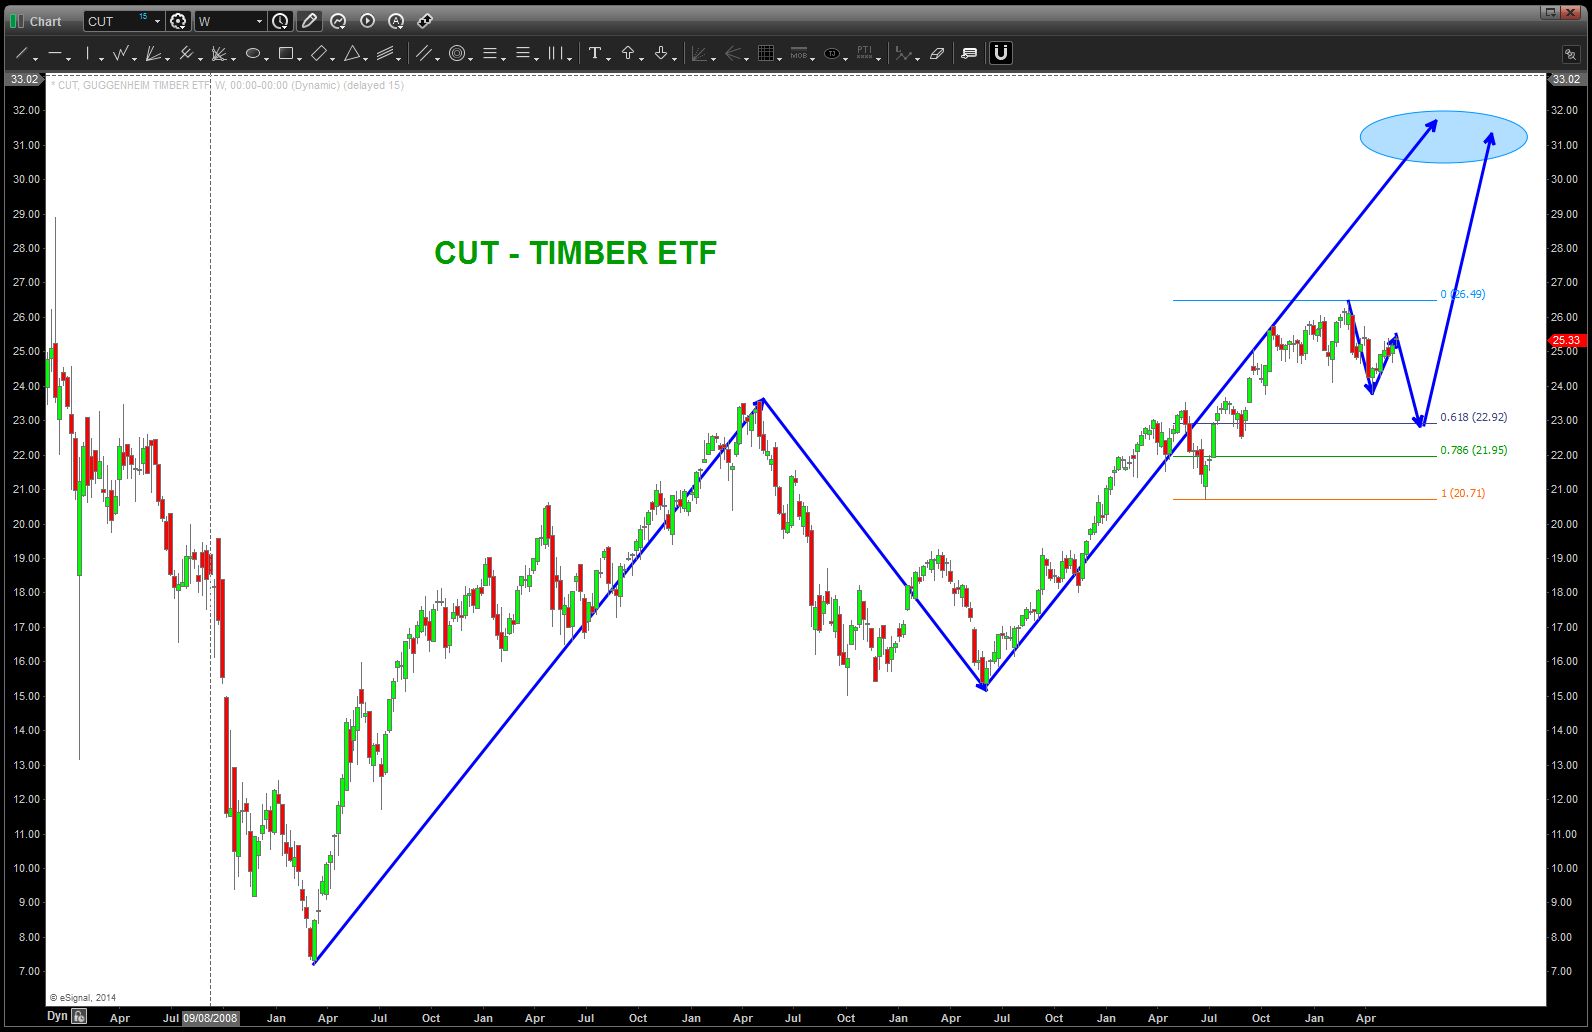
CUT
Housing … just keep your head in the sand OR are the clouds forming?
Posted on September 5, 2016 Leave a Comment

I sold my house in VA and moved out to SoCal to rent .. did it for a number of reasons. The NUMBER 1 reason was to learn how to Stand Up Paddle-board Surf and enjoy the weather. YES, I understand it’s financial suicide out here .. the taxes are crazy, the cost of living is crazy but the surf is good man …
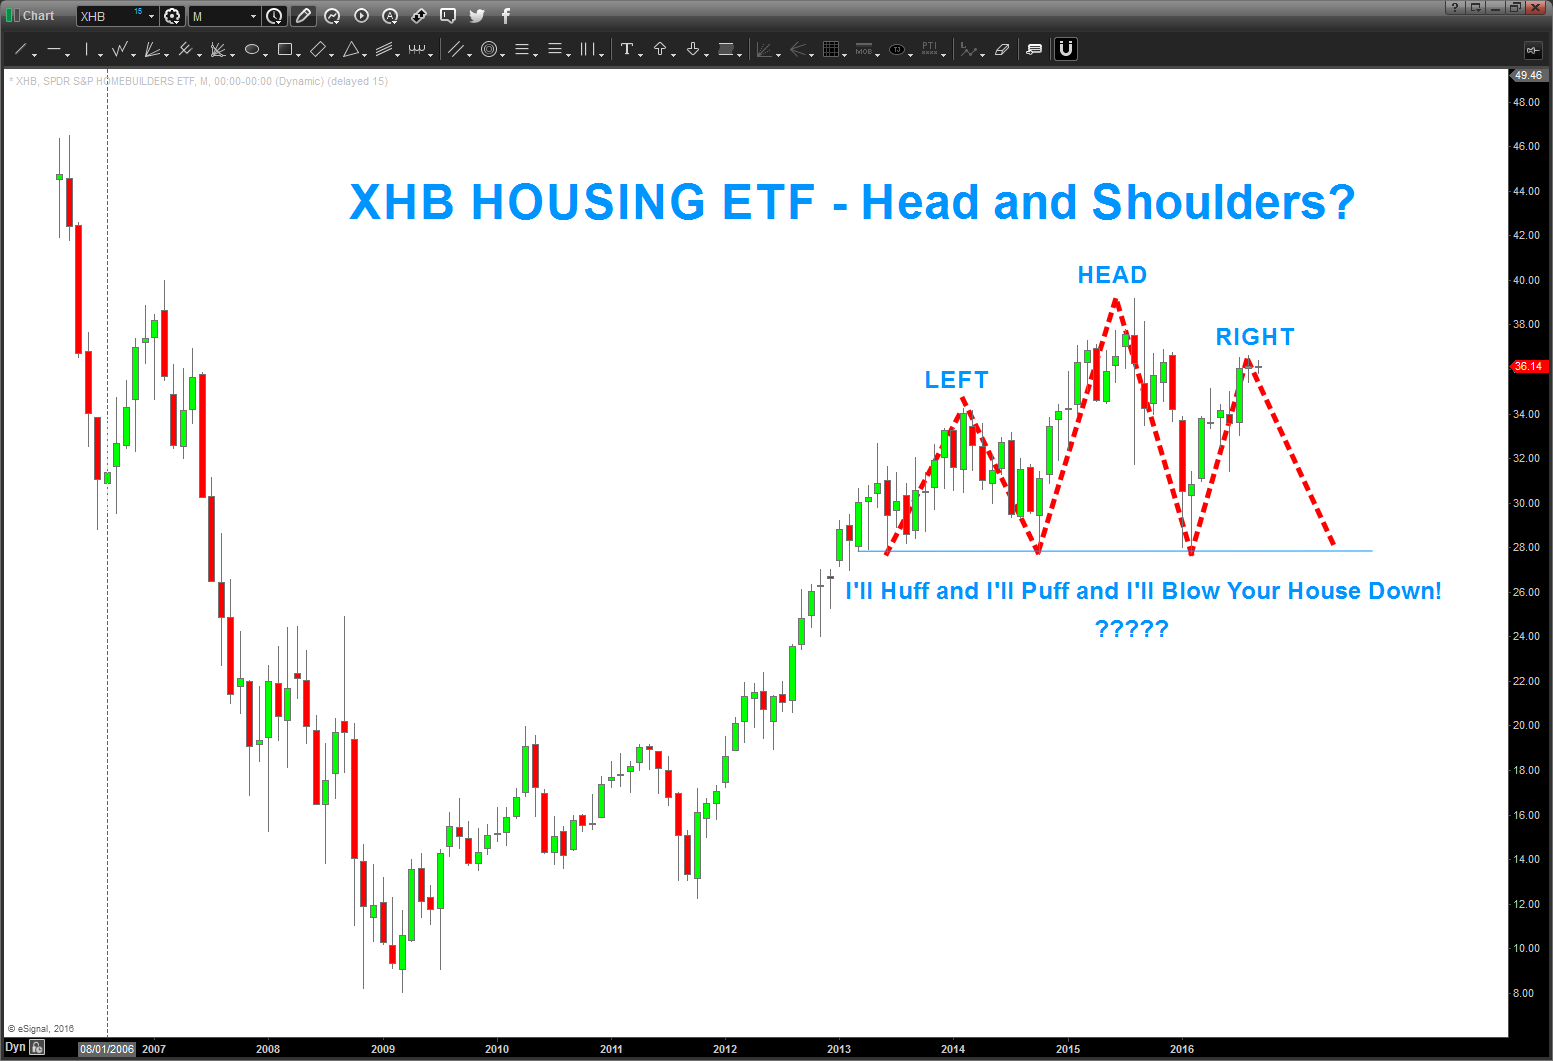
I was SO HAPPY to unload the house … why? Well, I think we are on the verge of another big old smack down in housing. Of note, my post from March 2013 (yes, 3+ years ago that the home builders had topped in/around 32 did not come to fruition. In essence the pattern failed .. so, it went up to the .786 and also completed the 1/8th signal reversal candle. Now, we’ve rallied right back up to the .786 level and are at the demarcation point.
Study:
- this ETF doesn’t want to go below 27. Big support …
- also, note the AB-CD projection down to 25.40 – if we crack from here expect support there and if BULLISH this will hold and bring it to new highs. If it fails … watch out below.
- THOSE are the levels to watch …
- sure looks like a MONTHLY H&S pattern for this ETF … doesn’t it?
To finish the story about San Diego … I was driving around the other day and noticed TONS of standing inventory …plus the houses were selling for 850K to 1.0 + MM. Folks, that dog don’t hunt man …
Also, the PATTERNS suggest a MAJOR top in bonds which means higher rates … so, it’s been 3+ years since my last post on home builders. It’s moved, a little, perhaps it will move more, but man this sure looks like a BIG top is coming in housing ….

Here’s the Home Construction and Home Builders ETF (ITB and EHF)
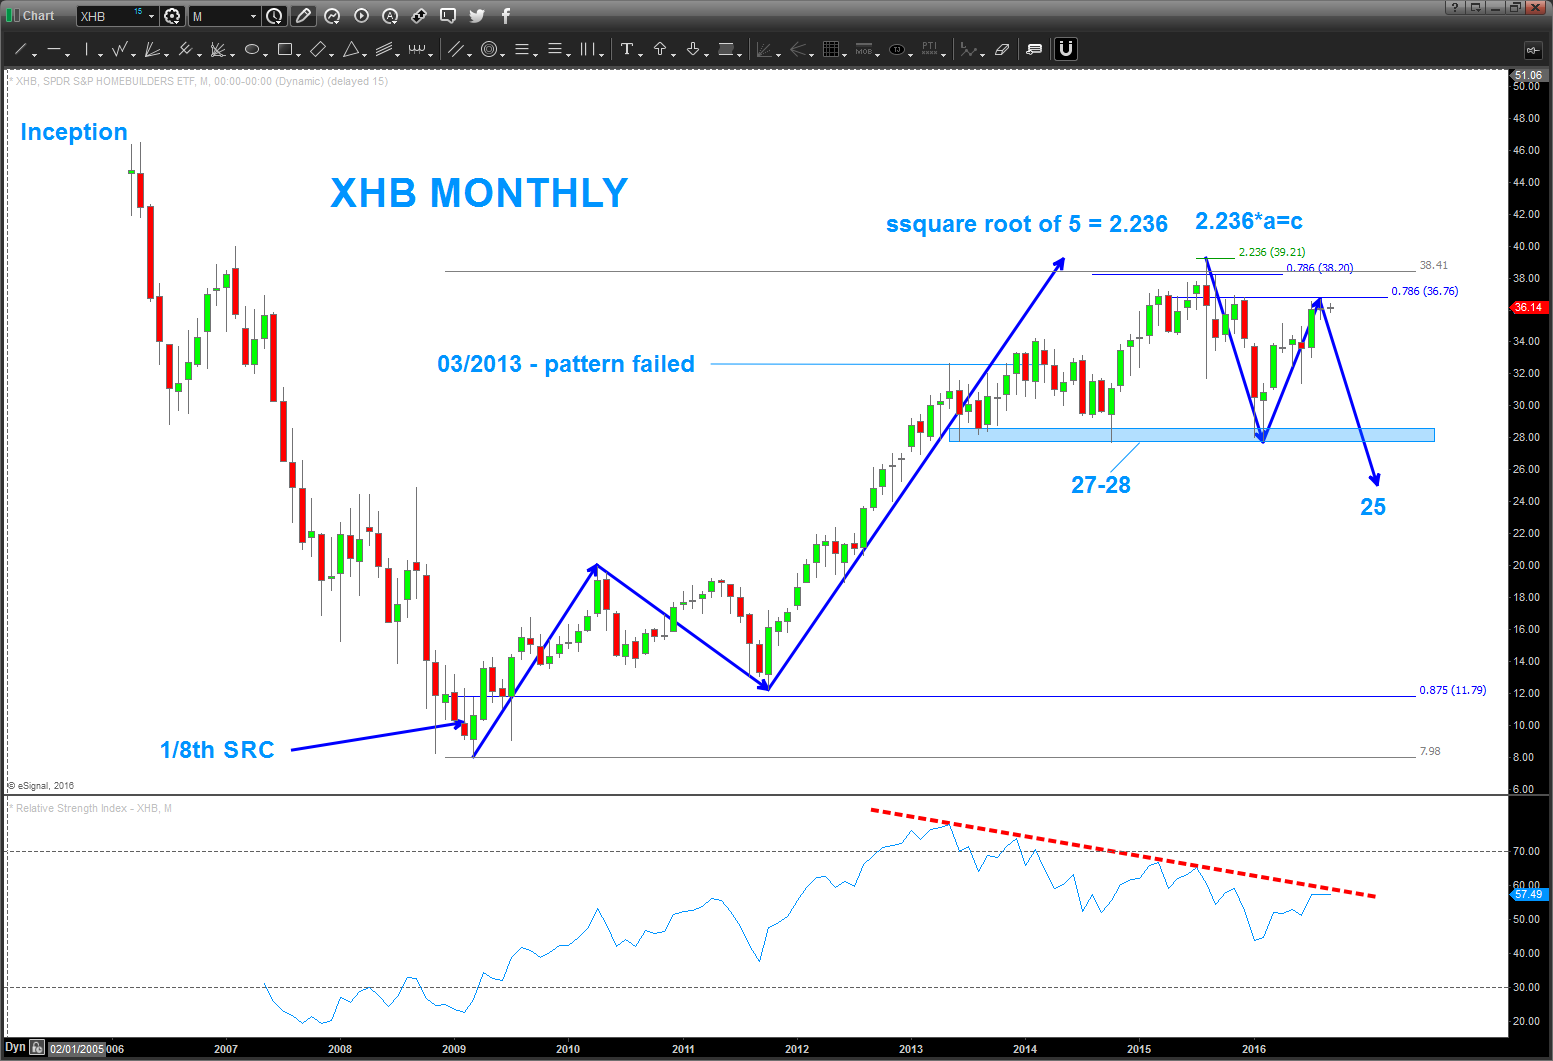
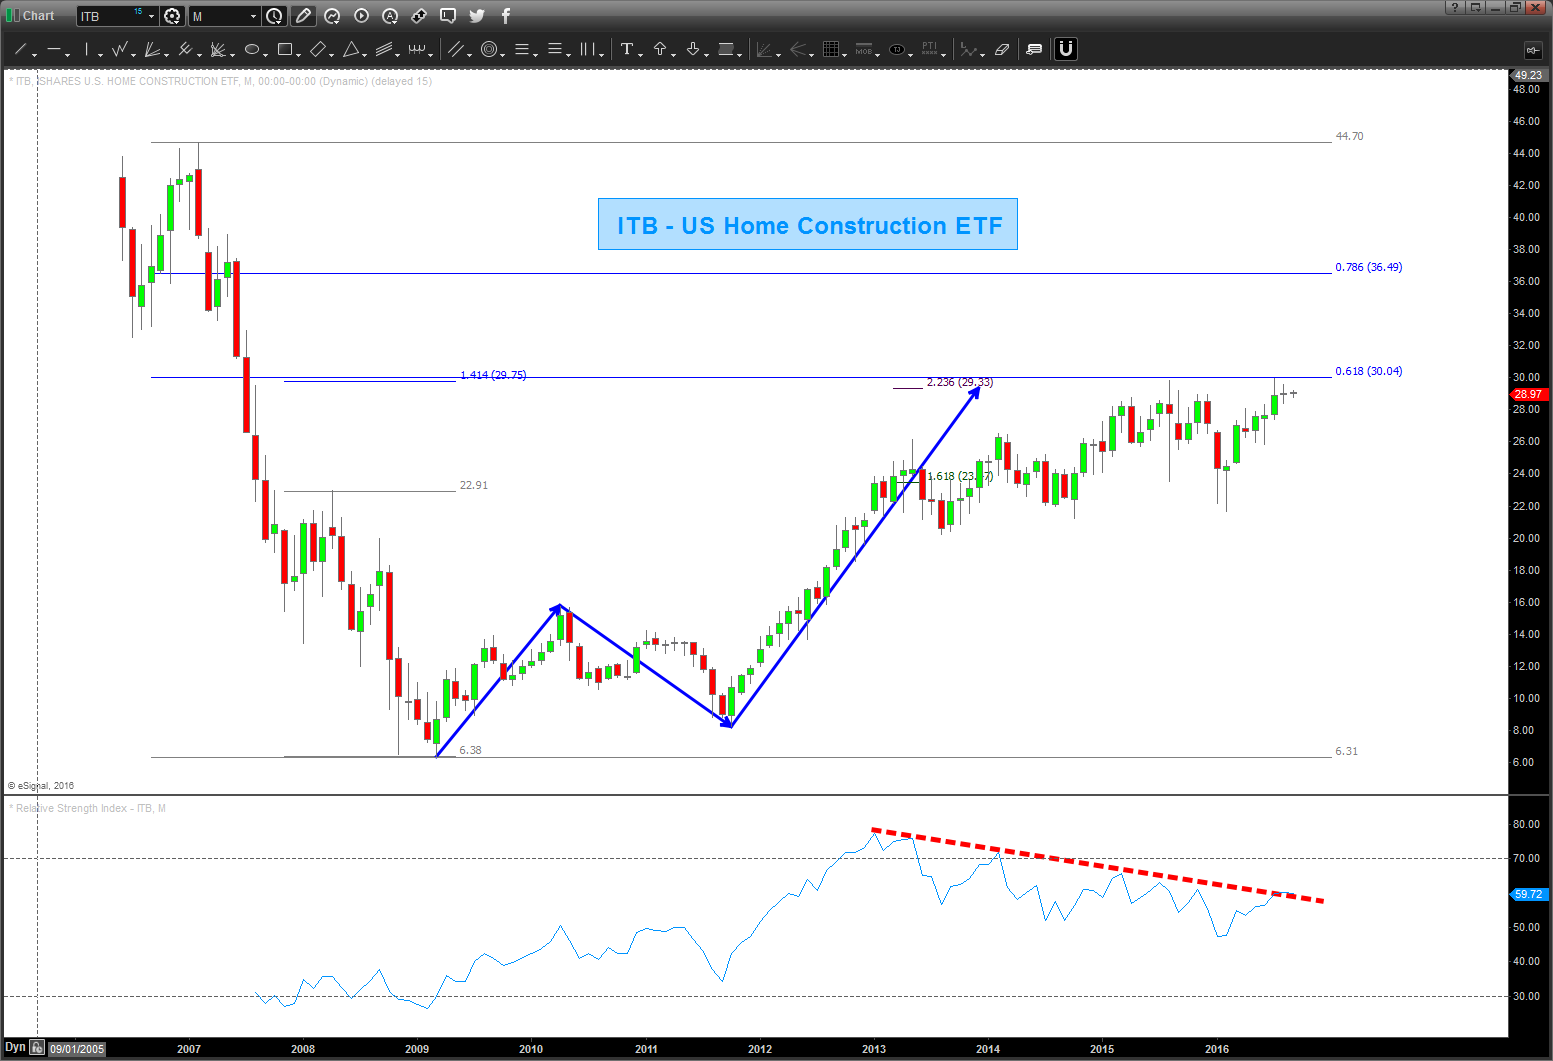
Again, folks, it’s just PATTERNS. Sometimes they work, sometimes they don’t … but at least we have some guides to support what could (could being the operative word) a BIG OLD THUMP in housing …
Bart
Have you ever been in a draw down?
Posted on September 4, 2016 1 Comment
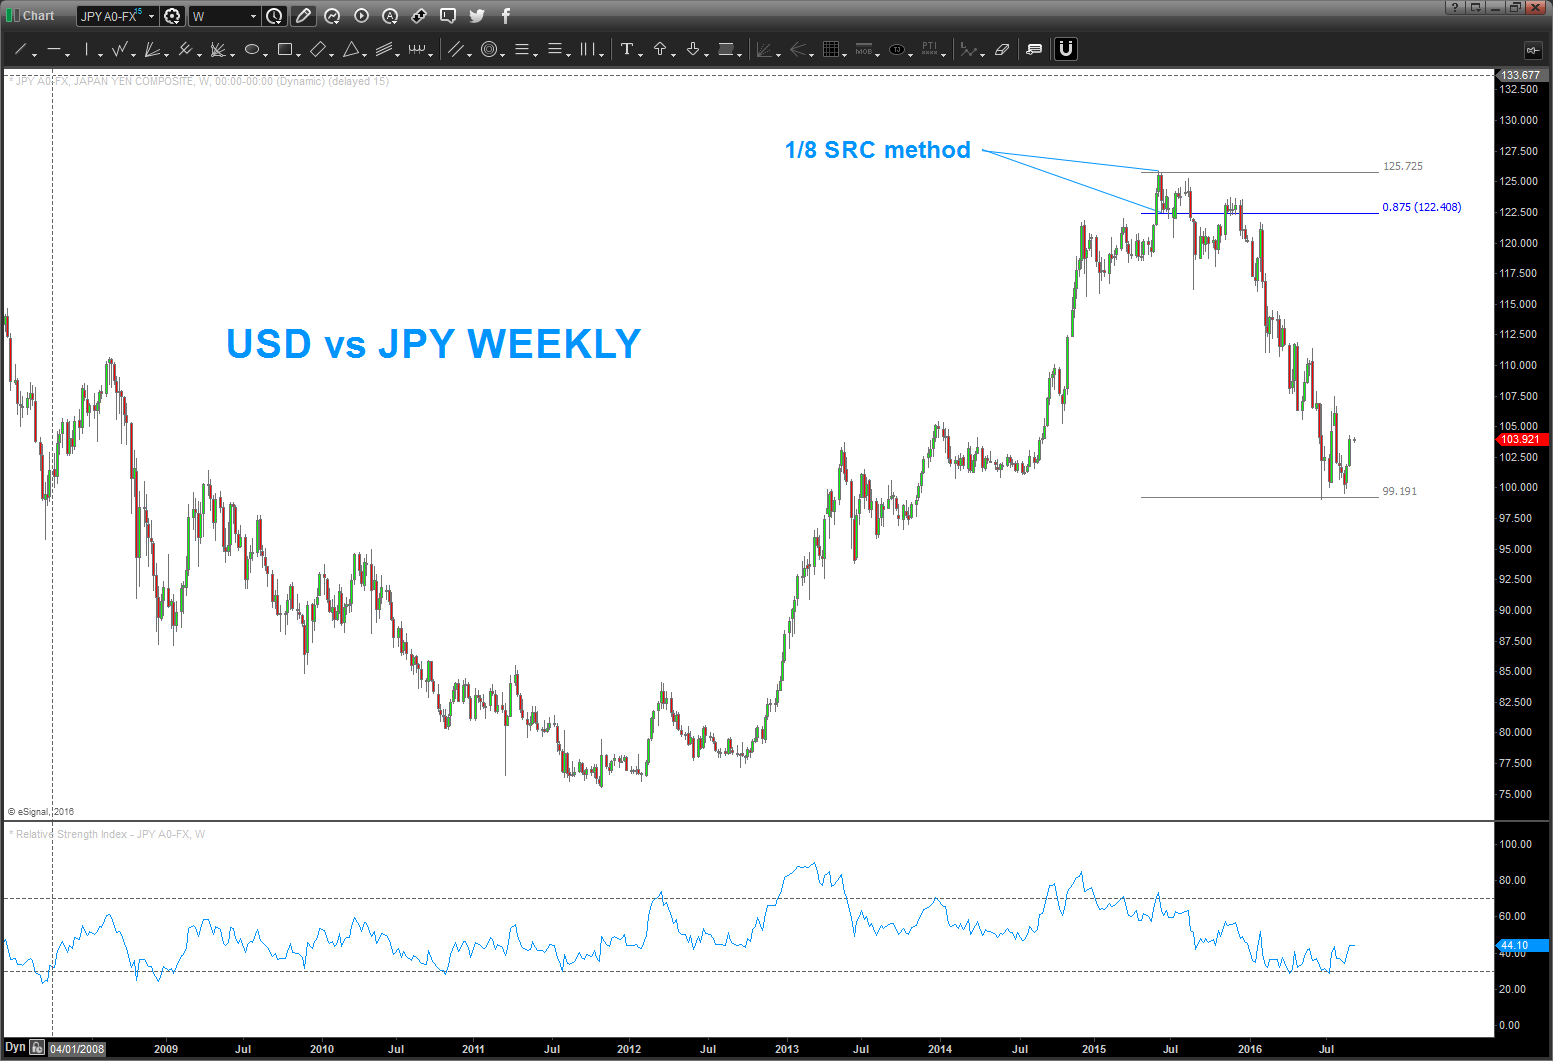
Note the title of this post … I know draw down and it hits you to the core. The reason I bring this up because, once again, I’m taking a hard look at the USD vs JPY. Why drawdown’s and the YEN? Well, because as a CTA I went into my first draw down – EVER – trying to go long the USD vs JPY in/around 75. TILT – all the way back down at 75? YES all the way down at 75. For those of you beginning this journey, you’ll say to yourself “you suck.” And for those of you who have been at it for a while you said “you’ll come away stronger …” I NEVER risk more than 1-2% on a trade … I didn’t then, I DO NOT now, but I lost something like 8 times in a row and went into an 18 percent draw down. It sucks … so anytime I start looking at the YEN I say “you sure you want to do this …?” YES, I DO and WILL ….
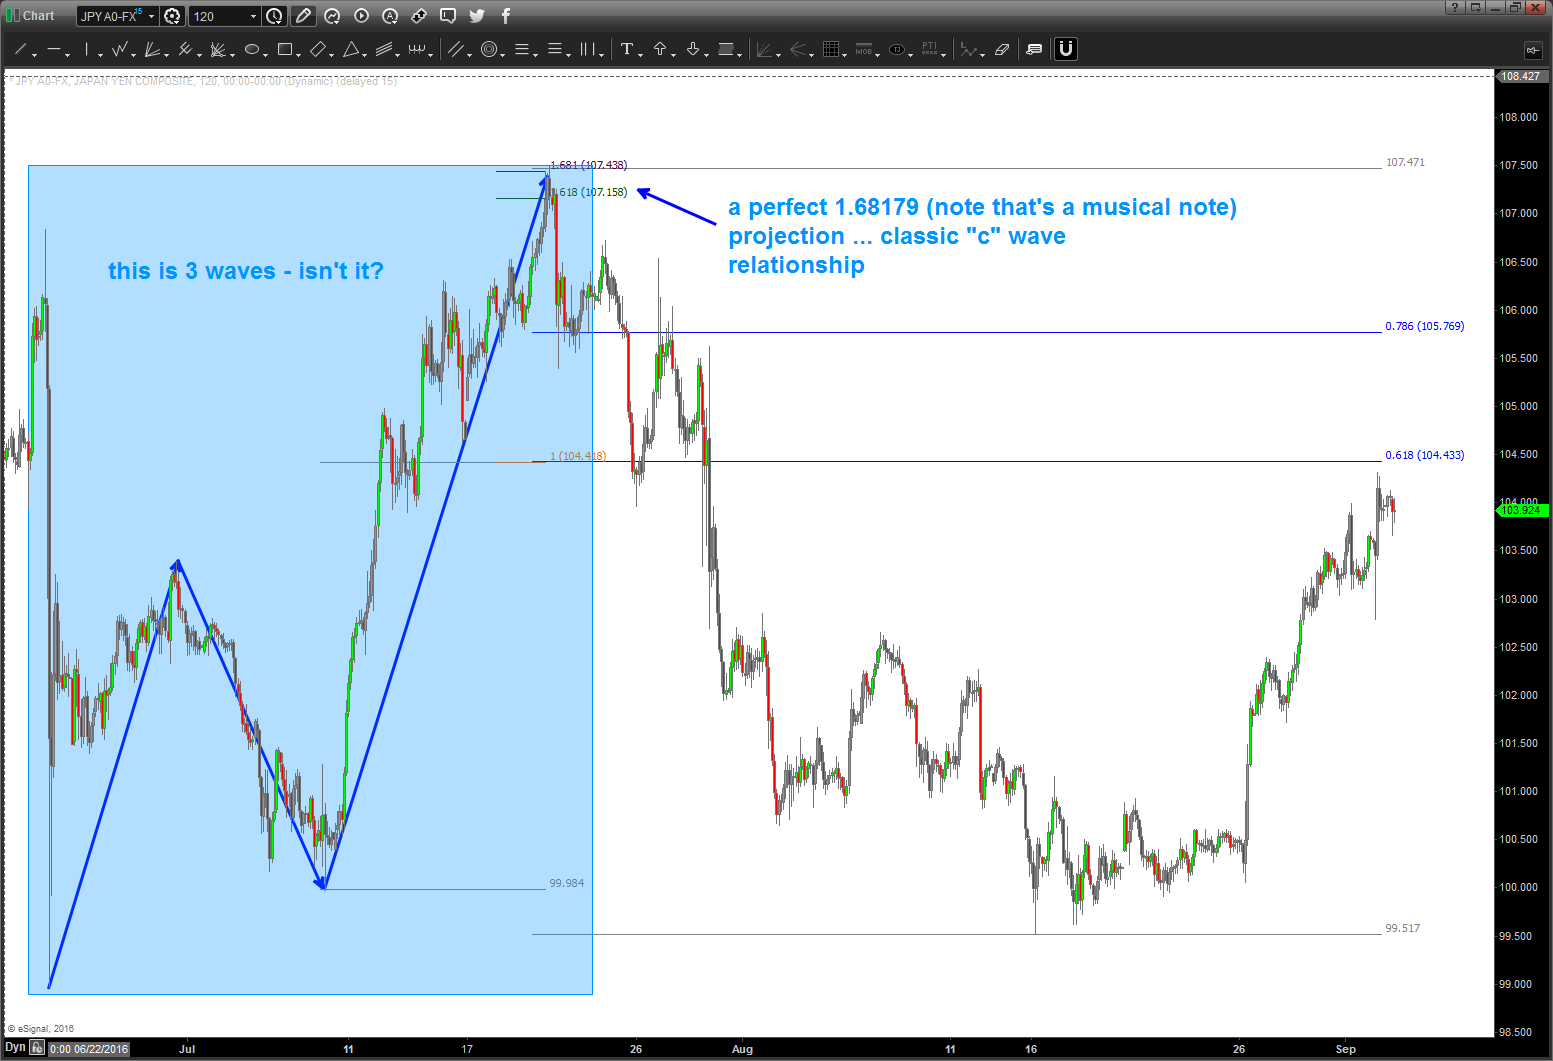
so, I really really like my count up at 125 …. and I really really like the long and deep retracement we are having. the question we have in front of us is … is this the end of it?
Michael Jenkins taught me his 1/8th Signal Reversal Candle technique – it’s SO SIMPLE yet the theory behind it’s so advanced. Let’s keep it simple:
- go to a weekly or monthly and look for the SIGNAL REVERSAL CANDLE. In this case, the LOW of the HIGH candle is taken out on close.
- from there simply subdivide that candle and bracket it w/ 7/8ths or .875. when you get to the last 1/8th division that SHOULD be big time support.
- note, in this case it was … try it, you’ll like it.
Here’s what I DO NOT like ... I DO NOT LIKE that the rally UP has been a clear three waves …so, crap that says one more low on the USD vs JPY. SO I WAIT … WHAT AM I MISSING HERE? 🙂
Great British Pound – the BUY case
Posted on September 4, 2016 Leave a Comment
September 4, 2016
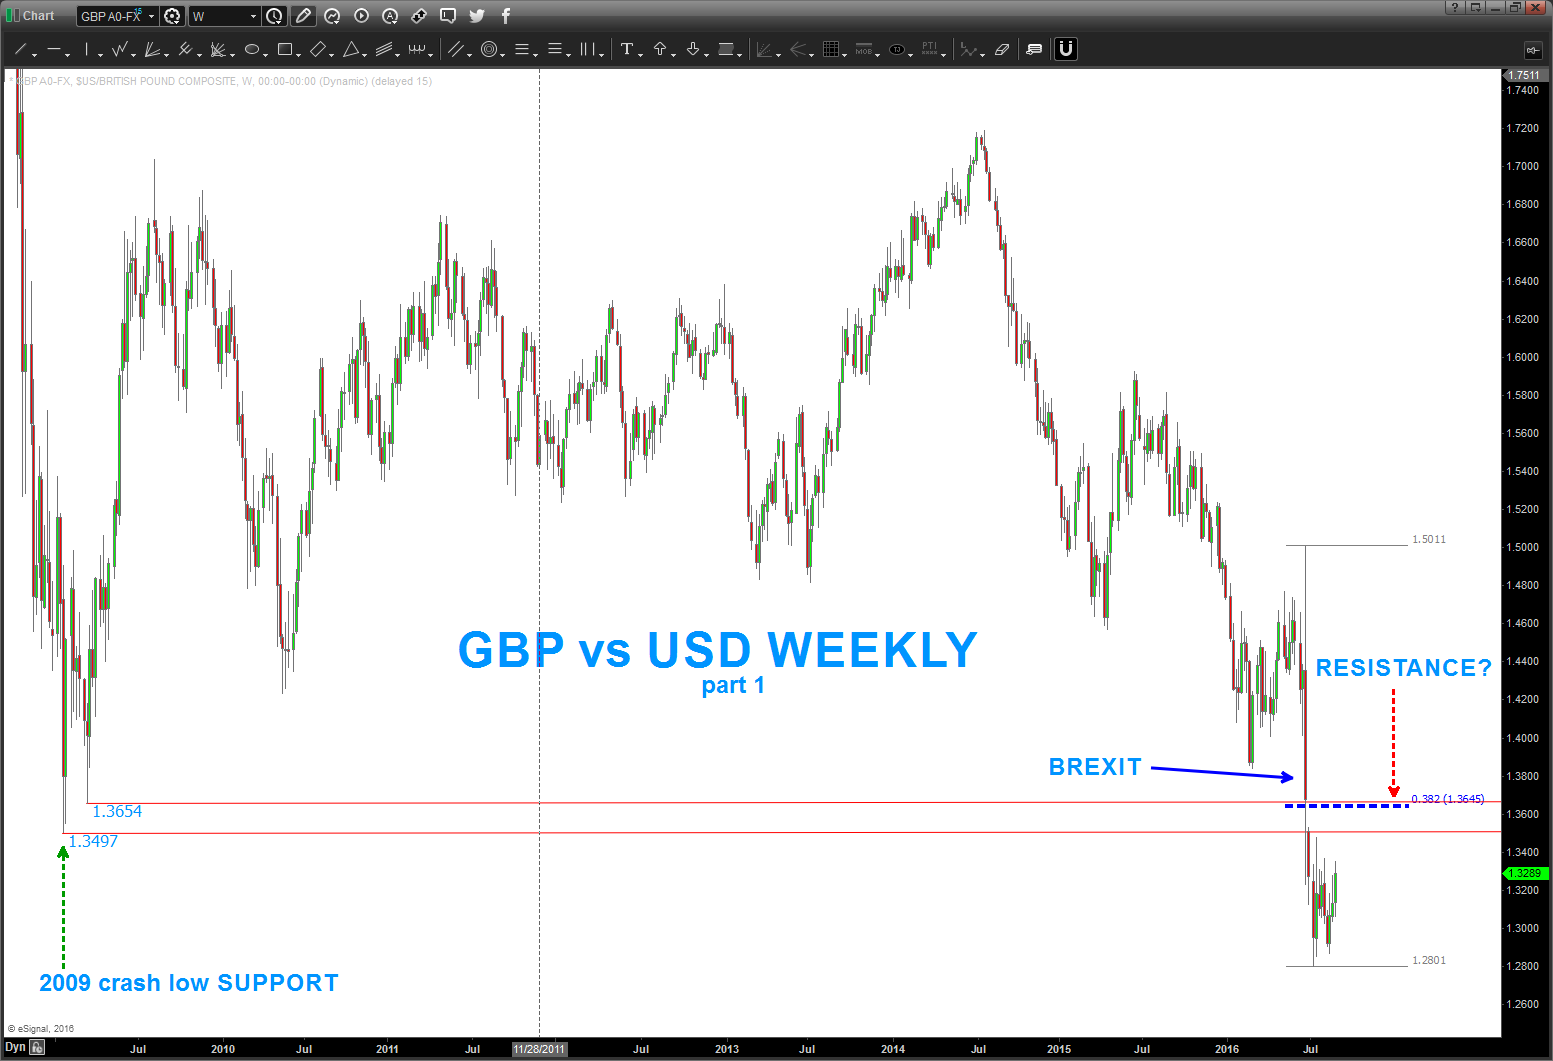
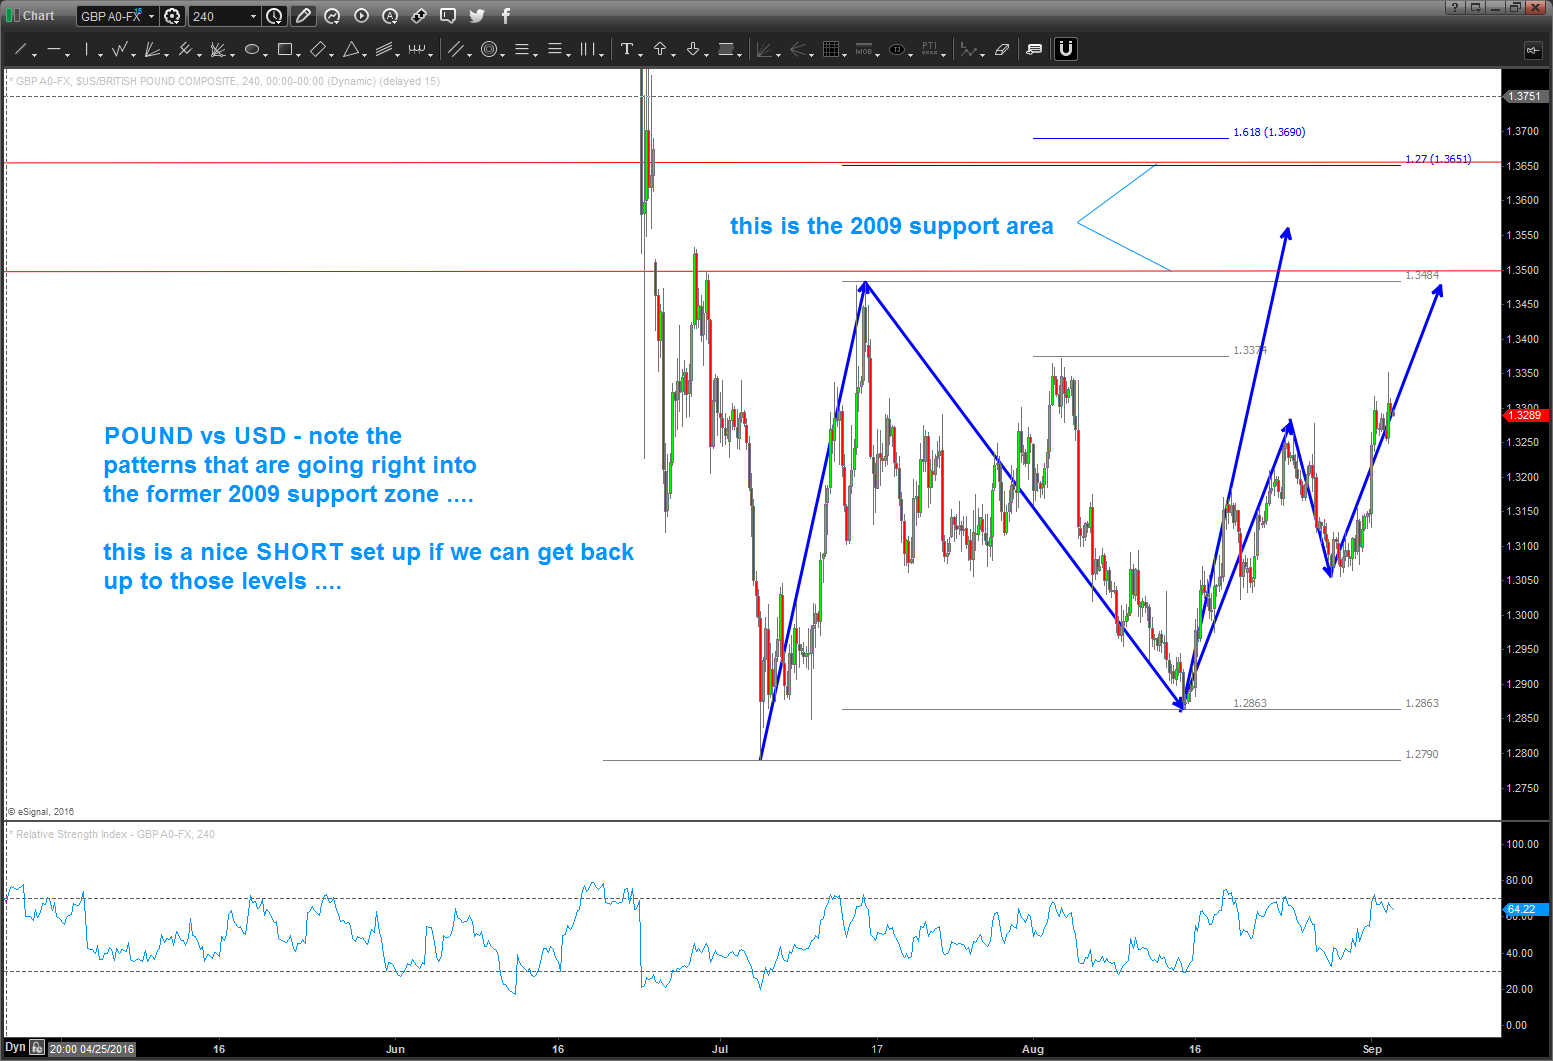
the Pound held the .786 and has rallied around 700-800 pips. Now, we find ourselves rolling up into the former 2009 support zone w/ a bunch of patterns coming into play. this should act as major resistance and the start of another leg down in the Pound vs USD.
just a pattern …
August 6, 2016
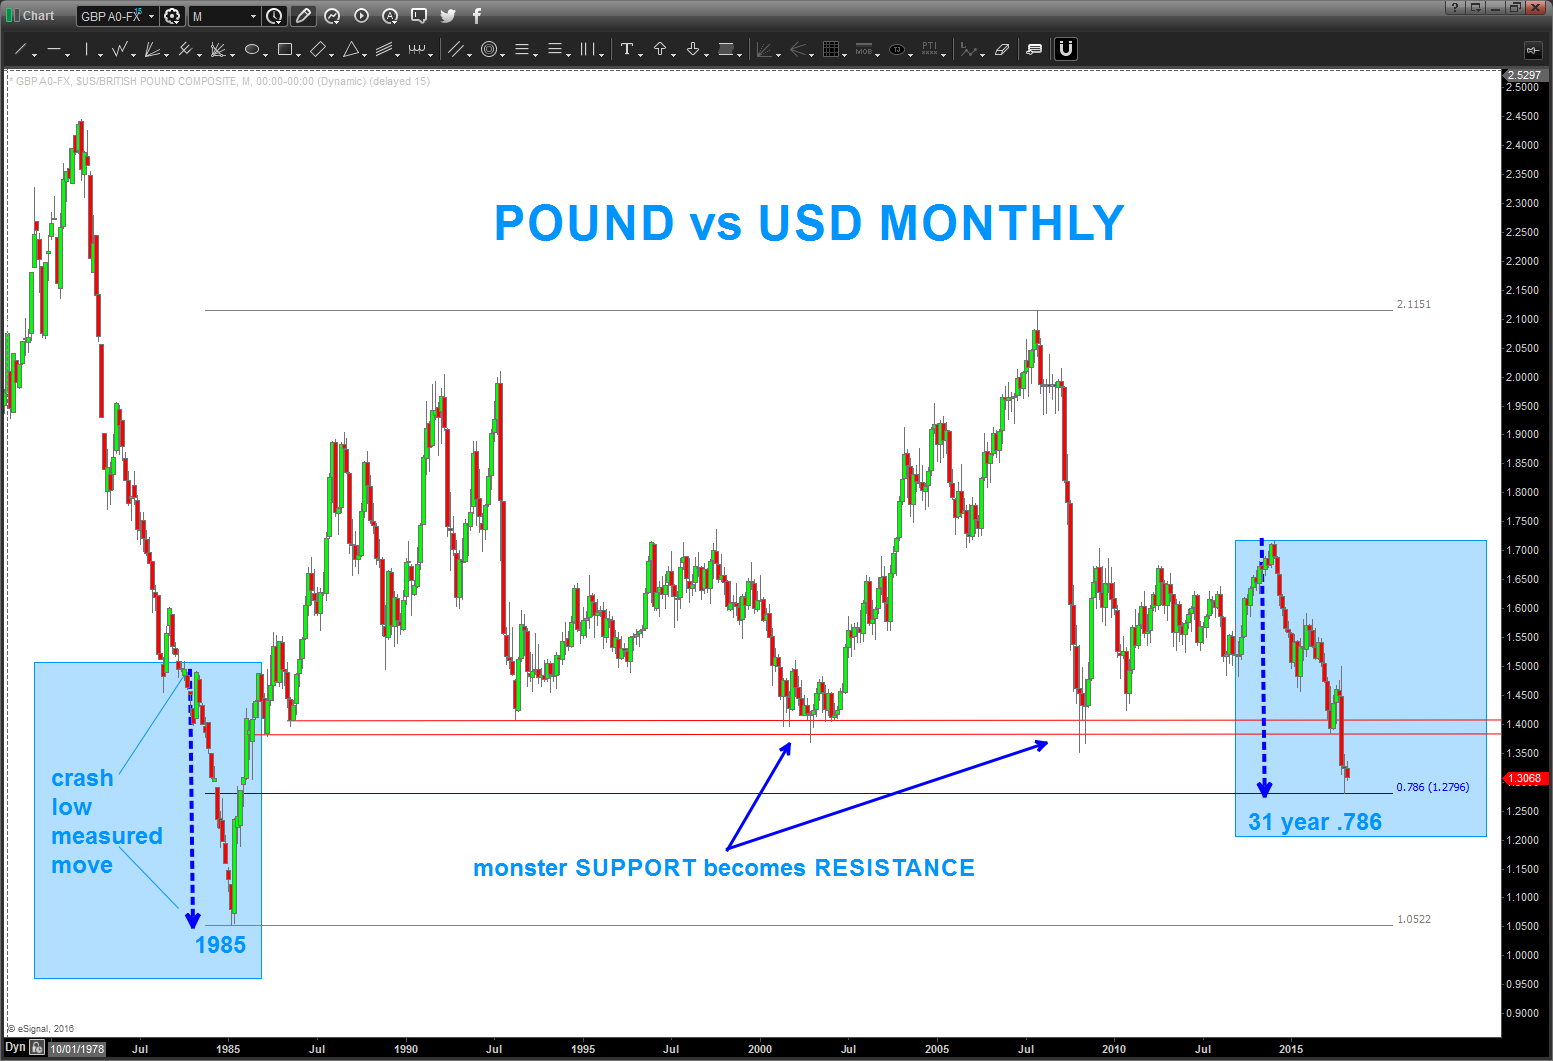
since the HUGE MONTHLY 31 year .78 node the pound move roughly 700 pips (note in 5 waves) and has been consolidating for a month.
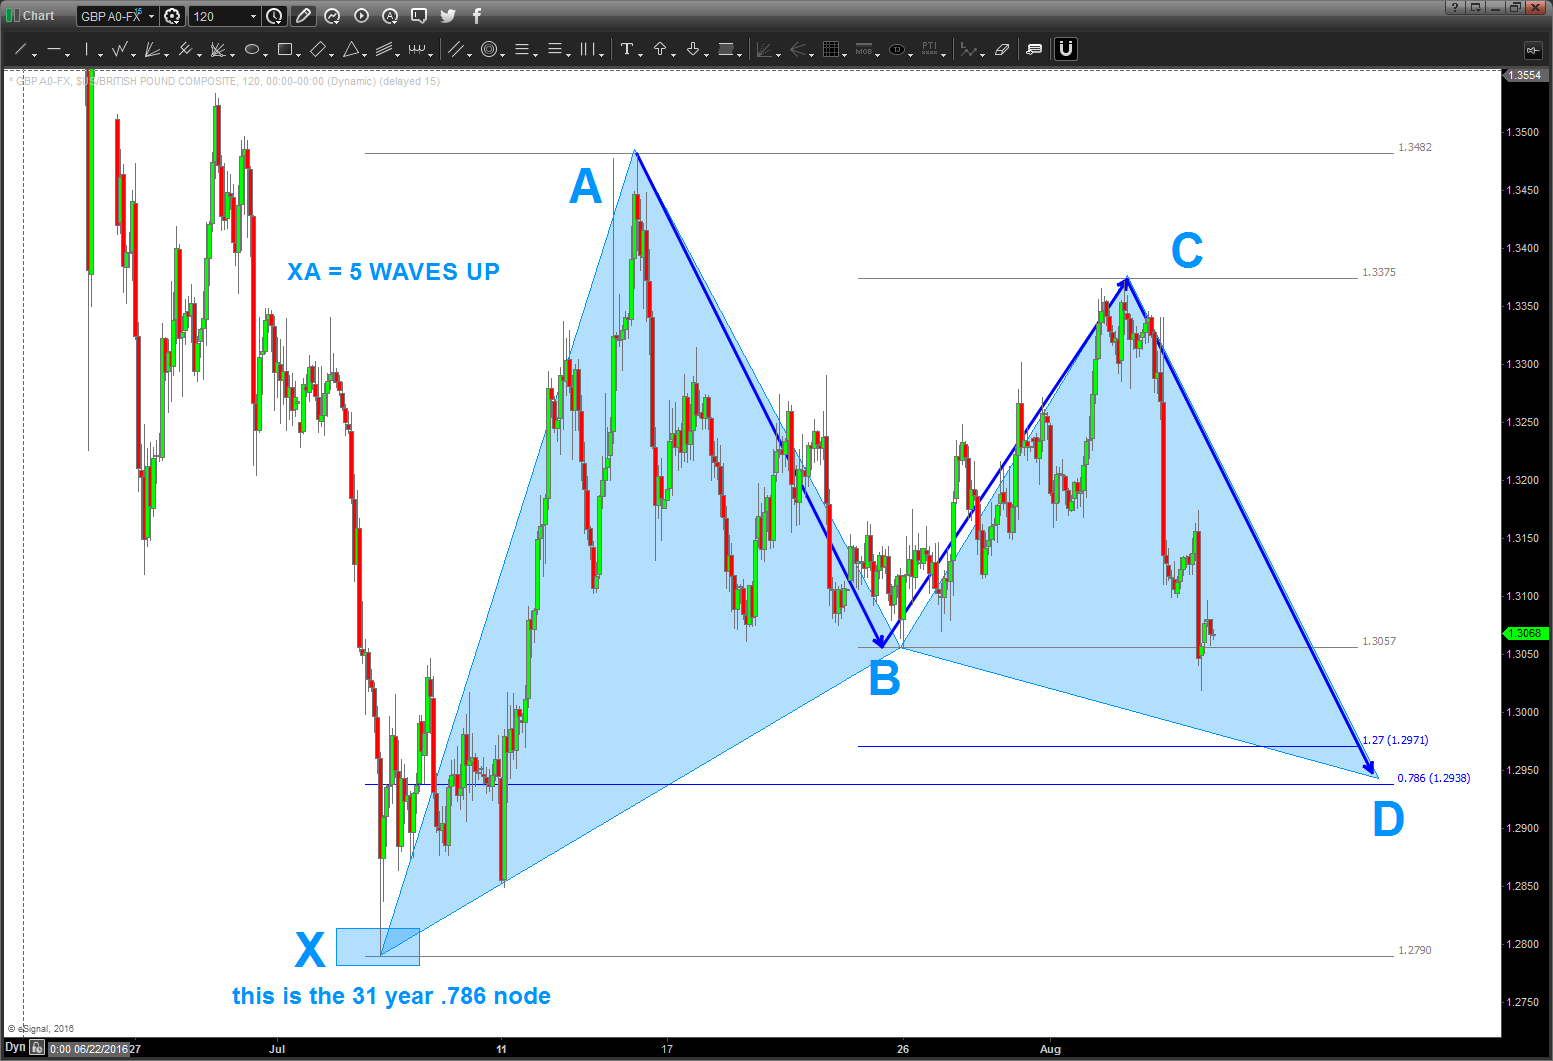
take a look at the BUY PATTERN present in the GBP a little lower … they don’t get better than this. What does that mean?
well after a 31 year .786 node of support we have a Gartley BUY occurring. all it means is it MIGHT work and it MIGHT not ..
I like the fact that it’s been working/consolidating for a bout a month .. that means the moon is at play! 🙂
wow .. what an amazing vacation in the Outer Banks this past week. W/ a clear head, I open my charts this AM ..
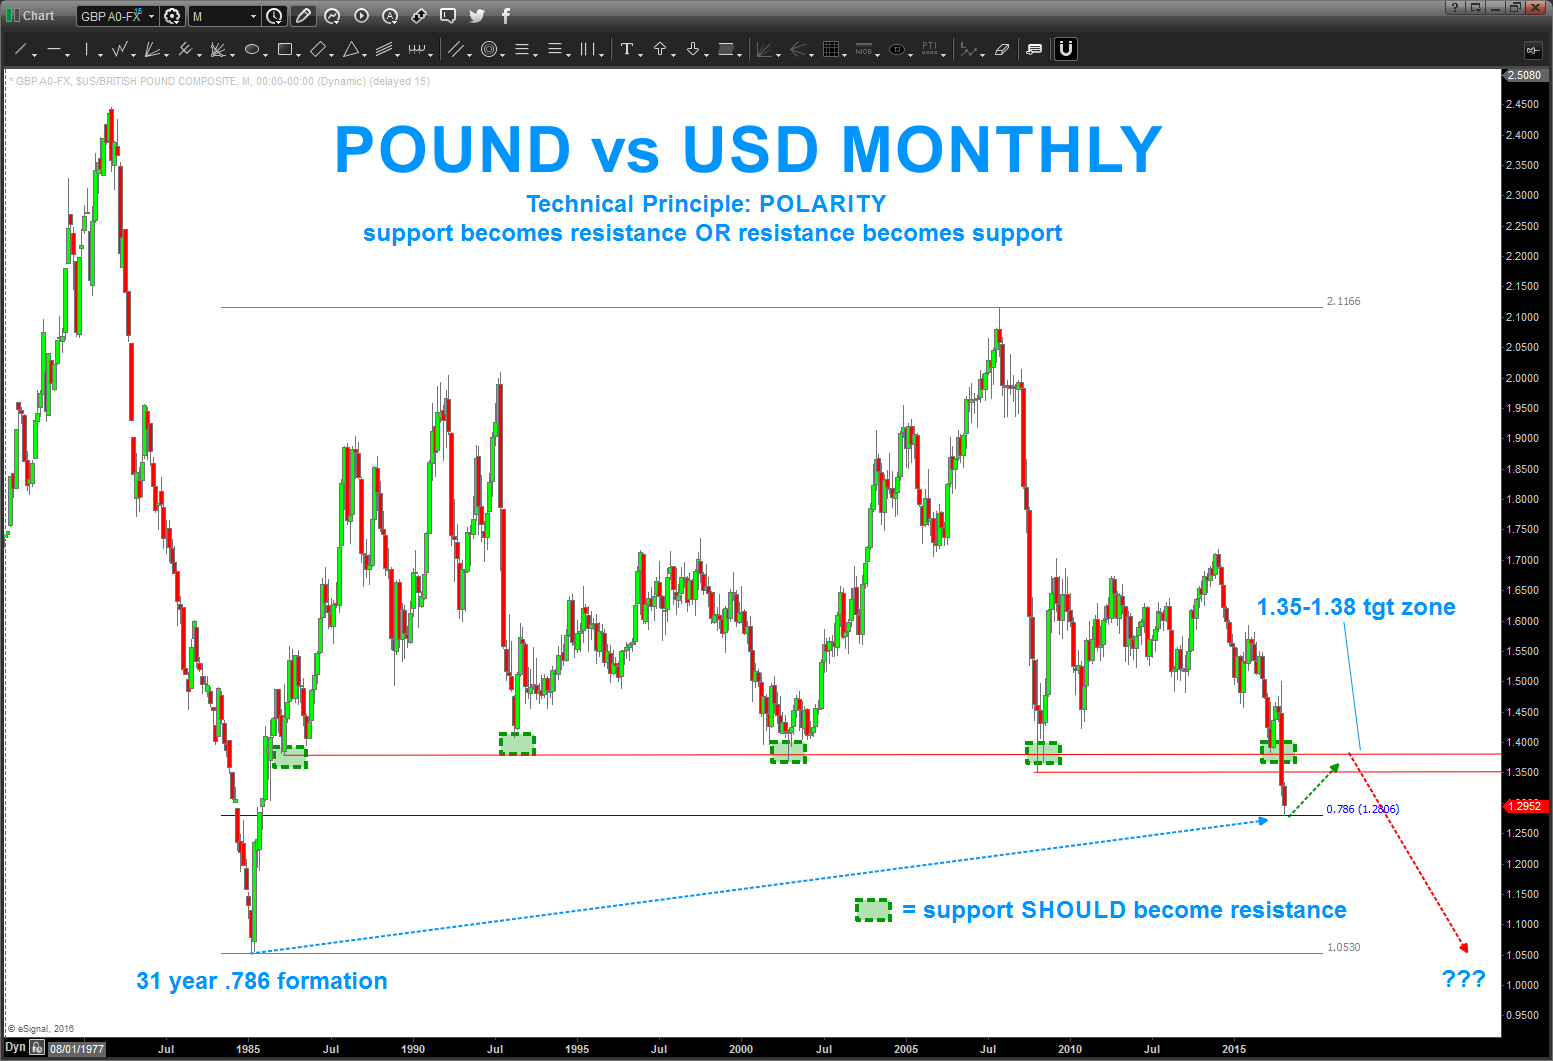
so, the Pound found support on a 31 year .786 retracement…it “should”. But, as we know, it doesn’t have to hold – at all. But so far it has …
now, if you’ve been following my blog you’ll find that this 30 year support in the 1.35-1.38 zone should not become resistance – polarity principle.
as for me, I’m going to look for a buy pattern (nibble) – folks – this is roughly 1000 pips away so, while it doesn’t look like much on the Monthly chart – it certainly could be a sizable rally right into the “wall of china” polarity principle.
hope you had a great week ….get some.
B
 Bart's Charts